Canopy Growth Corporation (CGC) Stock Analysis

Canopy Growth Corporation, together with its subsidiaries, engages in the production, distribution, and sale of cannabis and hemp-based products for recreational and medical purposes primarily in Canada, the United States, and Germany. It operates through two segments, Global Cannabis and Other Consumer Products. Based on the Canopy Growth Corporation stock forecasts from 15 analysts, the average analyst target price for Canopy Growth Corporation is USD 8.23 over the next 12 months. Canopy Growth Corporation’s average analyst rating is Under-perform. Stock Target Advisor’s own stock analysis of Canopy Growth Corporation is Bearish, which is based on 2 positive signals and 5 negative signals. At the last closing, Canopy Growth Corporation’s stock price was USD 4.97. Canopy Growth Corporation’s stock price has changed by +4.41% over the past week, -12.96% over the past month and -80.95% over the last year.

Recommended
Recommended
More Related Content
Similar to Canopy Growth Corporation (CGC) Stock Analysis
Similar to Canopy Growth Corporation (CGC) Stock Analysis (20)
More from Stock Target Advisor
More from Stock Target Advisor (20)
Recently uploaded
Recently uploaded (20)
Canopy Growth Corporation (CGC) Stock Analysis
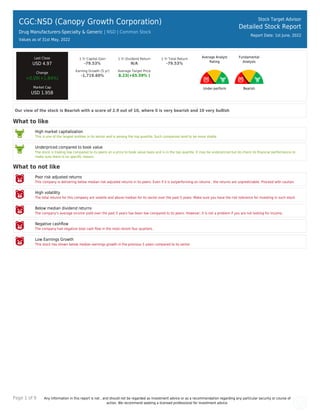
- 1. Page 1 of 9 Any information in this report is not , and should not be regarded as investment advice or as a recommendation regarding any particular security or course of action. We recommend seeking a licensed professional for investment advice. CGC:NSD (Canopy Growth Corporation) Drug Manufacturers-Specialty & Generic | NSD | Common Stock Values as of 31st May, 2022 Stock Target Advisor Detailed Stock Report Report Date: 1st June, 2022 Last Close USD 4.97 Change +0.09(+1.84%) Market Cap USD 1.95B 1 Yr Capital Gain -79.53% 1 Yr Dividend Return N/A 1 Yr Total Return -79.53% Earning Growth (5 yr) -1,719.60% Average Target Price 8.23(+65.59% ) Average Analyst Rating Under-perform Fundamental Analysis Bearish Our view of the stock is Bearish with a score of 2.9 out of 10, where 0 is very bearish and 10 very bullish What to like High market capitalization This is one of the largest entities in its sector and is among the top quartile. Such companies tend to be more stable. Underpriced compared to book value The stock is trading low compared to its peers on a price to book value basis and is in the top quartile. It may be underpriced but do check its financial performance to make sure there is no specific reason. What to not like Poor risk adjusted returns This company is delivering below median risk adjusted returns in its peers. Even if it is outperforming on returns , the returns are unpredictable. Proceed with caution. High volatility The total returns for this company are volatile and above median for its sector over the past 5 years. Make sure you have the risk tolerance for investing in such stock. Below median dividend returns The company’s average income yield over the past 5 years has been low compared to its peers. However, it is not a problem if you are not looking for income. Negative cashflow The company had negative total cash flow in the most recent four quarters. Low Earnings Growth This stock has shown below median earnings growth in the previous 5 years compared to its sector
- 2. Page 2 of 9 Any information in this report is not , and should not be regarded as investment advice or as a recommendation regarding any particular security or course of action. We recommend seeking a licensed professional for investment advice. CGC:NSD (Canopy Growth Corporation) Drug Manufacturers-Specialty & Generic | | Common Stock Stock Target Advisor Detailed Stock Report Report Date: 1st June, 2022 Adjusted Closing Share Volume Relative Returns Relative Performance (Total Returns) Security Capital Gain Dividend Return Total Return CGC Canopy Growth Corporation -81% 0 -81% QQQ Invesco QQQ Trust Series 1 -7.7% +0.4% -7.3% Company Overview Canopy Growth Corporation, together with its subsidiaries, engages in the production, distribution, and sale of cannabis and hemp-based products for recreational and medical purposes primarily in Canada, the United States, and Germany. It operates through two segments, Global Cannabis and Other Consumer Products. The company's products include dried cannabis flowers, oils and concentrates, and softgel capsules. It offers its products under the Tweed, Quatreau, Deep Space, Spectrum Therapeutics, First & Free, TWD, This Works, BioSteel, DNA Genetics CraftGrow, Tokyo Smoke, DOJA, Van der Pop, and Bean & Bud brands. The company also provides growth capital and a strategic support platform that pursues investment opportunities in the global cannabis sector. Canopy Growth Corporation has a clinical research partnership with NEEKA Health Canada and NHL Alumni Association to examine the efficacy of CBD-based therapies as part of the mitigation of persistent post-concussion symptoms. The company was formerly known as Tweed Marijuana Inc. and changed its name to Canopy Growth Corporation in September 2015. Canopy Growth Corporation is headquartered in Smiths Falls, Canada.
- 3. Page 3 of 9 Any information in this report is not , and should not be regarded as investment advice or as a recommendation regarding any particular security or course of action. We recommend seeking a licensed professional for investment advice. Company Website https://www.canopygrowth.com Address 1 Hershey Drive, Smiths Falls, ON, Canada, K7A 0A8 Fiscal Year End March Technical Indicators Value Value Beta 1.98 52 Week High 26.96 Short Ratio 8.34 52 Week Low 4.60 Shorted Shares 50,012,347 200 Day Moving Average 10.06 Shorted Shares Previous Month 54,422,269 50 Day Moving Average 6.31 Shares Held By Insiders 3,541.50% Short Percentage 8.00% Shares Held by Institutions 17.44 Dividend Yield N/A
- 4. Page 4 of 9 Any information in this report is not , and should not be regarded as investment advice or as a recommendation regarding any particular security or course of action. We recommend seeking a licensed professional for investment advice. CGC:NSD (Canopy Growth Corporation) Drug Manufacturers-Specialty & Generic | | Common Stock Stock Target Advisor Detailed Stock Report Report Date: 1st June, 2022 Market Performance Market Performance vs. Industry / Classification (Drug Manufacturers-Specialty & Generic) Market Performance vs. Exchange (Nasdaq Global Select) Value Sector Median Percentile Rank Grade Market Median Percentile Rank Grade YTD Capital Gain -43.07% -43.1% 49% -17.3% 27% Dividend Return N/A 8.4% N/A 0.9% N/A Total Return -43.07% -43.1% 49% -16.9% 27% Trailing 12 Months Capital Gain -79.53% -69.1% 35% -19.9% 12% Dividend Return N/A 12.0% N/A 2.2% N/A Total Return -79.53% -69.1% 35% -18.7% 12% Trailing 5 Years Capital Gain N/A -69.8% N/A 7.5% N/A Dividend Return N/A N/A N/A 11.0% N/A Total Return N/A -69.8% N/A 18.0% N/A Average Annual (5 Year Horizon) Capital Gain -11.62% -3.2% 35% 2.6% 14% Dividend Return N/A 4.3% N/A 1.8% N/A Total Return -11.62% -3.2% 35% 4.5% 14% Risk Return Profile Volatility (Standard Deviation) 51.08% 46.4% 44% 32.2% 29% Risk Adjusted Return -22.75% N/A 38% 20.7% 26% Market Capitalization 1.95B 0.11B 94% 0.36B 79%
- 5. Page 5 of 9 Any information in this report is not , and should not be regarded as investment advice or as a recommendation regarding any particular security or course of action. We recommend seeking a licensed professional for investment advice. Key Financial Ratios Ratios vs. Industry / Classification (Computer Hardware) Ratios vs. Exchange (Nasdaq Global Select) Value Sector Median Percentile Rank Grade Market Median Percentile Rank Grade Market Value peratio N/A 17.7 N/A 16.8 N/A pbratio 0.7 1.9 83% 1.6 88% pcfratio -3.6 -1.3 75% -0.2 67% pfcfratio N/A 10.3 N/A 10.1 N/A Management Effectiveness retequity -8.84% -57.6% 76% -0.1% 42% retinvcap -15.59% -39.6% 66% -0.6% 35% retass -5.94% -17.1% 67% 0.0% 35% debtequityratio N/A 35.2% N/A 32.3% N/A Technical Ratios yield N/A 13.2% N/A 2.6% N/A sratio 8.34 4.49 16% 3.08 13% spercent 19.88% 6.1% 7% 3.0% 9% beta 1.98 1.12 17% 1.10 12%
- 6. Page 6 of 9 Any information in this report is not , and should not be regarded as investment advice or as a recommendation regarding any particular security or course of action. We recommend seeking a licensed professional for investment advice. CGC:NSD (Canopy Growth Corporation) Drug Manufacturers-Specialty & Generic | | Common Stock Stock Target Advisor Detailed Stock Report Report Date: 1st June, 2022 Recent Analyst Ratings Price Action Rating Action Analyst Rating Price date Target Lowered by Canaccord Capital USD 6 » USD 4.5 2022-05-31 Target Lowered by CIBC Capital Markets USD 6.5 » USD 5 2022-05-31 Maintains Piper Sandler Underweight USD 6 » USD 4 2022-05-31 Target Down Stifel Nicolaus Research Sell USD 4 2022-05-30 Reiterates STA Research Hold USD 7 2022-05-30 Target Morningstar Buy USD 16 2022-05-30 Target Down Cowen Buy USD 5 2022-05-30 Reiterated by Cfra Hold USD 10 2022-05-28 Downgraded by Benchmark Hold » Sell 2022-05-27 Target Lowered by Alliance Global Partners USD 11 » USD 8 2022-05-20 Target Down Stifel Nicolaus Research Sell USD 4.5 2022-05-02 Target STA Research Buy USD 12 2022-03-23 Downgraded by Barclays Equal Weight » Underweight 2022-03-22 Maintains Barclays Equal-Weight USD 14 » USD 9 2022-03-01 Target Raised by Cantor Fitzgerald Securities USD 9.6 » USD 11 2022-02-18 Target Lowered by Canaccord Genuity USD 12 » USD 10 2022-02-10 Target Lowered by CIBC Capital Markets USD 12 » USD 9 2022-02-03 Target Lowered by Cantor Fitzgerald Securities USD 16.3 » USD 9.6 2022-01-28 Target Lowered by Alliance Global Partners Neutral » Neutral USD 18 » USD 11 2022-01-07 Downgrades Bank of America Underperform USD 19 » USD 10 2021-12-22 Downgraded by Piper Sandler Neutral » Underweight USD 11 » USD 7 2021-12-20 Initiates Coverage On Wells Fargo Underweight USD 8 2021-12-07 Downgraded by Eight Capital Neutral » Sell 2021-11-30 Target Lowered by Jefferies Financial LLC Positive » Hold USD 25.28 » USD 16.7 2021-11-23 Initiated by Barclays Equal Weight USD 14 2021-11-18
- 7. Page 7 of 9 Any information in this report is not , and should not be regarded as investment advice or as a recommendation regarding any particular security or course of action. We recommend seeking a licensed professional for investment advice. CGC:NSD (Canopy Growth Corporation) Drug Manufacturers-Specialty & Generic | | Common Stock Stock Target Advisor Detailed Stock Report Report Date: 1st June, 2022 Annual Financial (USD)
- 8. Page 8 of 9 Any information in this report is not , and should not be regarded as investment advice or as a recommendation regarding any particular security or course of action. We recommend seeking a licensed professional for investment advice. CGC:NSD (Canopy Growth Corporation) Drug Manufacturers-Specialty & Generic | | Common Stock Stock Target Advisor Detailed Stock Report Report Date: 1st June, 2022 Quarterly Financial (USD)
- 9. Page 9 of 9 Any information in this report is not , and should not be regarded as investment advice or as a recommendation regarding any particular security or course of action. We recommend seeking a licensed professional for investment advice. CGC:NSD (Canopy Growth Corporation) Drug Manufacturers-Specialty & Generic | | Common Stock Stock Target Advisor Detailed Stock Report Report Date: 1st June, 2022 Largest Industry Peers for Drug Manufacturers-Specialty & Generic Symbol Company Name Price(Change) Market Cap NBIX Neurocrine Biosciences Inc +0.39 (+0.4%) USD 8.59B MYL Mylan N.V N/A USD 8.59B APHA Tilray, Inc N/A USD 6.86B MNTA Momenta Pharmaceuticals, Inc N/A USD 6.24B ITCI Intra-Cellular Therapies Inc -0.88 (-1.5%) USD 5.50B PCRX Pacira BioSciences Inc -1.19 (-1.8%) USD 2.93B TLRY Tilray Inc -0.06 (-1.3%) USD 2.26B AMPH Amphastar Pharmaceuticals Inc -1.73 (-4.5%) USD 1.90B IRWD Ironwood Pharmaceuticals Inc -0.11 (-1.0%) USD 1.72B HCM HUTCHMED (China) Limited +0.96 (+10.0%) USD 1.65B ETFs Containing CGC Symbol Company Name Weight Mer Price(Change) Market Cap CROP IQ Global Agribusiness Small C.. 0.00 % 0.76 % N/A USD 6.04M MJ ETFMG Alternative Harvest ETF 0.00 % 0.75 % -0.09 (-1.2%) USD 0.49B YOLO AdvisorShares Trust - AdvisorS.. 0.00 % 0.00 % +0.06 (+-1.2%) USD 0.09B CNBS Amplify ETF Trust - Amplify Se.. 0.00 % 0.00 % +0.04 (+-1.2%) N/A THCX The Cannabis ETF 0.00 % 0.00 % N/A N/A MJJ MicroSectors Cannabis ETNs 0.00 % 0.00 % N/A N/A MJO MicroSectors Cannabis 2X Lever.. 0.00 % 0.00 % N/A N/A POTX Global X Funds - Global X Cann.. 0.00 % 0.00 % -0.04 (-1.2%) N/A The Stock Target Advisor platform run millions of calculations every day on over 30,000 Canadian and American stocks, comparing and ranking their financial and market performance against their sectors and exchange. We represent the percentile ranking using the following grading system. Letter Grade Percentage Letter Grade Percentage Letter Grade Percentage A+ 97%-100% A 93%-96% A- 90%-92% B+ 97%-89% B 83%-86% B- 80%-82% C+ 77%-79% C 73%-76% C- 70%-72% D+ 67%-69% D 63%-66% D- 60%-62% F 0%-59%