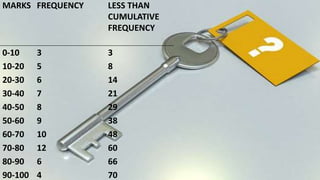
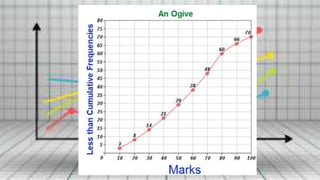
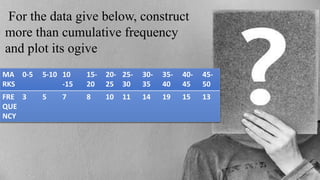
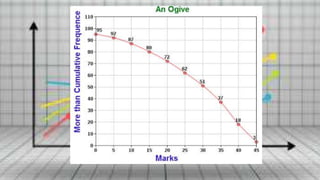
Ogives are cumulative histograms that help visualize data distribution, showing how many values lie above or below a specific threshold. The document details steps for plotting both 'less than' and 'more than' type ogives, outlining the importance of ogives in summarizing large datasets and analyzing data characteristics. However, it also notes several limitations, including complications in preparation and minimal descriptive power regarding central tendencies or distributions.


![Ogives wps office [autosaved]](https://cdn.slidesharecdn.com/ss_thumbnails/ogives-wpsofficeautosaved-190822094751-thumbnail.jpg?width=640&height=640&fit=bounds)
![Ogives wps office [autosaved]](https://cdn.slidesharecdn.com/ss_thumbnails/ogives-wpsofficeautosaved-190822095359-thumbnail.jpg?width=640&height=640&fit=bounds)


