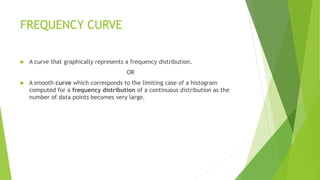
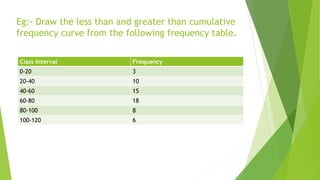
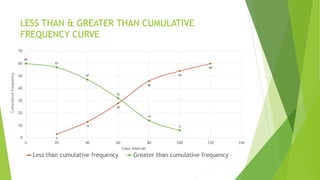
A frequency curve graphically represents a frequency distribution as a smooth curve. It depicts the limiting case of a histogram as the number of data points becomes very large. An ogive or cumulative frequency curve plots cumulative frequencies on the y-axis against class boundaries on the x-axis. It can show both less than and greater than cumulative frequencies based on a frequency table. The document provides an example of marks data to construct less than and greater than cumulative frequency curves from their respective tables.


![Ogives wps office [autosaved]](https://cdn.slidesharecdn.com/ss_thumbnails/ogives-wpsofficeautosaved-190822094751-thumbnail.jpg?width=640&height=640&fit=bounds)
![Ogives wps office [autosaved]](https://cdn.slidesharecdn.com/ss_thumbnails/ogives-wpsofficeautosaved-190822095359-thumbnail.jpg?width=640&height=640&fit=bounds)