Aag2015 seto

This document summarizes research on how OpenStreetMap (OSM) was used for crisis mapping and community rebuilding efforts in Japan following natural disasters. It provides two case studies: (1) an offline mapping party in Ishinomaki City after the 2011 earthquake to create reconstruction maps with volunteers and residents; and (2) crowdsourcing mapping during and after typhoons in Izu Island Town in 2013 and Hiroshima City in 2014. The research found that OSM activities allowed sharing of up-to-date situation information and suggested such activities could support new forms of community rebuilding. However, OSM remains difficult for beginners, so developing learning materials and paper maps is important to sustain participation. Future work includes open data

Recommended
Recommended
More Related Content
What's hot
What's hot (20)
Viewers also liked
Similar to Aag2015 seto
Similar to Aag2015 seto (20)
More from Toshikazu Seto
More from Toshikazu Seto (20)
Recently uploaded
Recently uploaded (20)
Aag2015 seto
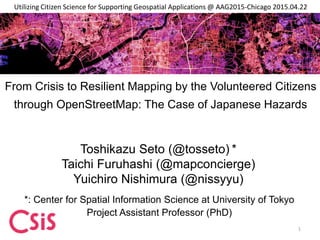
- 1. From Crisis to Resilient Mapping by the Volunteered Citizens through OpenStreetMap: The Case of Japanese Hazards Toshikazu Seto (@tosseto) * Taichi Furuhashi (@mapconcierge) Yuichiro Nishimura (@nissyyu) *: Center for Spatial Information Science at University of Tokyo Project Assistant Professor (PhD) Utilizing Citizen Science for Supporting Geospatial Applications @ AAG2015-Chicago 2015.04.22 1
- 2. Background • The Great East Japan Earthquake on March 11th, 2011 has brought catastrophic damage in the huge area of Japan. • On the other hand, Japanese IT volunteers were actively share the information of crisis response using GIS (Nishimura & Seto, 2012) 2 Sinsai.info (Ushahidi platform)Radiation Mapping (cf. safecast)
- 3. Purpose • The resilient mapping agnostic narrow sense of crisis mapping against the background of the natural disasters that frequently is performed became. • In addition, the mapping for the purpose of disaster mitigation is not only compatible to a variety of natural disasters has become so much in recent years. 3 • This presentation aim to compare in the Japanese before/after crisis mapping efforts for qualitative- quantitative approach that have been made in recent years using OSM data and platform.
- 4. Example: Open Cities Project: Resilient city by Open Data and Participatory Local Citizens
- 5. Approach and Case Studies • Qualitative Approach: Typical example is the mapping party for "Reconstruction" centered in the Ishinomaki city needs to create digital and paper based maps. • Quantitative Approach: Other examples, in the Izu Island (2013) and Hiroshima (2014) mapping by crowdsourcing- based from disaster earlier is performed, and led to crisis mapping during typhoon disaster. 5
- 6. 6
- 7. Case Study 1: Ishinomaki City Offline Mapping Party
- 8. Why is a reconstruction map needed ? • Response to local “Up-to-date” information • Official guide is so lately for regional restoration processes. • The possibility of collaboration by volunteers and residents Source: http://kamaishi-town.com/
- 10. Great East Japan Earthquake after one month
- 11. After the Mapping Party
- 12. Collected POI of the tourism attractiveness in Ishinomaki
- 13. Artwork: Shotaro Ishinomori’s Manga character statues 13
- 14. Case Study 2: Izu Island Town & Hiroshima City Crowdsourcing and Communication during/after disaster
- 15. 15 Source: http://on.fb.me/1e0z9HN Izu Island Crisis Mapping: Oct. 16th, 2013 Typhoon 26th
- 16. 16 Hiroshima Landslide Crisis Mapping: Aug. 20th 2014
- 17. Using OSM Tasking Manager 17
- 18. 18 14831.0' 8116.7' 2298.7' 33626.4' 2705.4' 362140.6' 338.9% 486.8% 1152.4% 450.2% 640.2% 3200.3% 0% 5000% 10000% 15000% 20000% 25000% 30000% 35000% 40000% 45000% 50000% 0% 500% 1000% 1500% 2000% 2500% 3000% 3500% Pre/period% Crisis% Response% (1month)% A>er%1%month% Pre/period% Crisis% Response% (1month)% A>er%1%month% Oshima% Hiroshima% ( ) OSM_'Average'of'Data'Crea>on' area% way%
- 19. 19
- 20. Key 20
- 21. 21
- 22. 22
- 23. 23
- 24. 24
- 25. Next Step for the Resilient Communities 25
- 26. 26 Source: http://weekly.ascii.jp/elem/000/000/245/245520/index-2.html Disaster Evacuation COaching Event • This disaster prevention training, the target to increase the interest in disaster prevention, and thought himself in the event of a disaster, that makes wearing a force that can practice self-help, mutual assistance. • Disaster Imagination Game (DIG) / Field work using OSM and tablet devices.
- 27. Conclusion and Future Works • Our research reveals that people’s disaster-response-related activities using OSM allow them to share the region’s latest situation that changes day by day on OSM. • Not only that, but our investigation also suggests that the activities of mapping in which the local residents get involved may develop to new forms of community rebuilding. • We also learned from our investigation is that OSM mapping is rather difficult for beginners to master. To keep their activities going, therefore, we need to develop e-learning materials and paper maps in good time. • In the future, and at the same time to promote the activities to collect the OSM data in the field, specific initiatives such as application development towards open data utilization (cf. Hackathon) becomes a challenge. 27
- 28. Questions and Comments ? 28 This research was suppported by JSPS KAKENHI Grant Numbers 25870907, 25244042. tosseto@csis.u-tokyo.ac.jp @tosseto
Editor's Notes
- Thank you chair. I am glad to talk about citizens engagement for crisis mapping and resilience activities . We are focusing Japanese OSM cases.
- The Great East Japan Earthquake on March 11th, 2011 has brought catastrophic damage in the huge area of Japan. On the other hand, Japanese IT volunteers were actively share the information of crisis response using GIS (Nishimura & Seto, 2012)
- This presentation aim to compare in the Japanese crisis mapping efforts for qualitative-quantitative approach that have been made in recent years using OSM data and platform. The resilient mapping agnostic narrow sense of crisis mapping against the background of the natural disasters that frequently is performed became. In addition, the mapping for the purpose of disaster mitigation is not only compatible to a variety of natural disasters has become so much in recent years.
- Qualitative Approach: Typical example is the mapping party for "Reconstruction" centered in the Tohoku region needs to create digital and paper based maps. Quantitative Approach: Other examples, in the Izu Island (2013) and Hiroshima (2014) mapping by crowdsourcing-based from disaster earlier is performed, and led to large-scale crisis mapping during typhoon disaster.
- n this presentation I pick up the three regions. Ishinomaki in the greater damage in the Great East Japan Earthquake, Izu Island and Hiroshima has occurred in the typhoon of the last two years.
- Why is need to make restoration map ? To response for local information “Up-to-date”, because Official guide is so lately for regional restoration processes. Moreover, making maps are basically activities of residents, because the possibility of collaboration of IT volunteer and residents. we focused collaborate many social groups and more easily making OSM mapping party.
- This event mainly use pushpin application in mapping party. This is iOS based OSM POI’s collective application. Japanese smartphone user likely to literate application even beginners in OSM.
- After the Great East Japan Earthquake, Ishinomaki did not most data is input because there was no OSM community,
- On the other hand, through the mapping party, especially the POI many data has been input.
- This mapping party mainly focused the tourism attractiveness in Ishinomaki on this mapping party. Because mainly discussed and collected tourism related POI with local participant.
- For example Ishinomaki situated many Japanese Manga’s artwork in this town. This party focused using OSM for tourism activities.
- Case study 2 is mainly through communication in SNS and online, we take up for continuous mapping. This is Izu Island version’s Facebook group. Japanese OSM users, however communication in mailing lists and Wiki was the center, in the disaster since the Great East Japan Earthquake was in cooperation with the outside of the user's actively use.
- Also, This is Hiroshima version
- In addition, became the cooperation support that crowdsourcing tool has been equipped. This is the OSM-tasking manager that has been launched in 2012, work sharing online was efficient.
- This figure shows comparison of the before and after of data creation amount of crisis mapping. If the distance and area aggregates based around the road data “way” is, after crisis mappings are continuously mapped. Number is not large because the IzuIsland has a small land, but it is a rare example of all is mapped almost island.
- This is the user of transition before and after the crisis mapping. Coloring are period of crisis mapping. The green is just 1 month of crisis response. In the Izu island has been mapping local mapper a few people continued. Also, the same number of mapper has continued to continuously activities after crisis mapping in Hiroshima.
- Range of mapping are concentrated in town areas of northwest. After Crisis mapping, reconstruction was the shop detail information and road.
- In Hiroshima, such as roads and land use have been continuously mapping because there was damage in a wide range. In particular is more data about the infrastructure.
- Finally, we will introduce the resilient activities other than mapping party after the Great East Japan Earthquake.
- This disaster prevention training, the target to increase the interest in disaster prevention, and thought himself in the event of a disaster, that makes wearing a force that can practice self-help, mutual assistance. Disaster Imagination Game (DIG) / Field work using OSM and tablet devices.
- Our investigation suggests that the activities of mapping in which the local residents get involved may develop to new forms of community rebuilding. We also learned from our investigation is that OSM mapping is rather difficult for beginners to master. To keep their activities going, therefore, we need to develop e-learning materials and paper maps in good time. In the future, and at the same time to promote the activities to collect the OSM data in the field, specific initiatives such as application development towards open data utilization (cf. Hackathon) becomes a challenge.