Asking Better Questions How Presentation Formats Influence Information Search
•
0 likes•2 views

Assignment Writing Service http://StudyHub.vip/Asking-Better-Questions--How-Presentati 👈

Recommended
Recommended
More Related Content
Similar to Asking Better Questions How Presentation Formats Influence Information Search
Similar to Asking Better Questions How Presentation Formats Influence Information Search (20)
More from Scott Bou
More from Scott Bou (20)
Recently uploaded
Recently uploaded (20)
Asking Better Questions How Presentation Formats Influence Information Search
- 1. Asking Better Questions: How Presentation Formats Influence Information Search Charley M. Wu and Björn Meder Max Planck Institute for Human Development, Berlin, Germany Flavia Filimon Max Planck Institute for Human Development, Berlin, Germany, and Humboldt University Jonathan D. Nelson Max Planck Institute for Human Development, Berlin, Germany While the influence of presentation formats have been widely studied in Bayesian reasoning tasks, we present the first systematic investigation of how presentation formats influence information search decisions. Four experiments were conducted across different probabilistic environments, where subjects (N ⫽ 2,858) chose between 2 possible search queries, each with binary probabilistic outcomes, with the goal of maximizing classification accuracy. We studied 14 different numerical and visual formats for presenting information about the search environment, constructed across 6 design features that have been prominently related to improvements in Bayesian reasoning accuracy (natural frequencies, posteriors, complement, spatial extent, countability, and part-to-whole information). The posterior variants of the icon array and bar graph formats led to the highest proportion of correct responses, and were substantially better than the standard probability format. Results suggest that presenting information in terms of posterior probabilities and visualizing natural frequencies using spatial extent (a perceptual feature) were especially helpful in guiding search decisions, although environments with a mixture of probabilistic and certain outcomes were challenging across all formats. Subjects who made more accurate probability judgments did not perform better on the search task, suggesting that simple decision heuristics may be used to make search decisions without explicitly applying Bayesian inference to compute probabilities. We propose a new take-the-difference (TTD) heuristic that identifies the accuracy-maximizing query without explicit computation of posterior probabilities. Keywords: information search, presentation formats, Bayesian reasoning, probability gain, optimal experimental design Supplemental materials: http://dx.doi.org/10.1037/xlm0000374.supp Before it is possible to arrive at the correct answer, one must first find the right question. The ability to ask good questions is essential for cognition and decision-making, because the choice of query determines what information is acquired, influencing all subsequent inferences and decisions. Consider a doctor choosing a test for diagnosing a patient, where a medical test is an example of a search query with binary outcomes (e.g., positive or negative test results). Not all tests are equally useful, and a doctor must consider the probabilities and diagnostic implications of each test outcome to identify the best test for diagnosing a patient. The term “infor- mation search” applies to any decision-making task where the goal is to actively acquire information, including directing eye move- ments toward informative parts of a scene (Legge, Klitz, & Tjan, 1997; Najemnik & Geisler, 2005, 2008; Nelson & Cottrell, 2007; Renninger, Verghese, & Coughlan, 2007) or conducting experi- ments to differentiate between competing hypotheses (Lindley, 1956; Slowiaczek, Klayman, Sherman, & Skov, 1992). Choosing the right search query requires evaluating the useful- ness, or, more precisely, expected usefulness of each potential query, because the outcome of a query is not known before it is This article was published Online First March 20, 2017. Charley M. Wu and Björn Meder, Center for Adaptive Behavior and Cognition, Max Planck Institute for Human Development, Berlin, Ger- many; Flavia Filimon, Center for Adaptive Behavior and Cognition, Max Planck Institute for Human Development and Berlin School of Mind and Brain, Humboldt University; Jonathan D. Nelson, Center for Adaptive Behavior and Cognition, Max Planck Institute for Human Development. This research was supported by Grant ME 3717/2-2 to BM and Grant NE 1713/1-2 to JDN from the Deutsche Forschungsgemeinschaft (DFG) as part of the priority program “New Frameworks of Rationality” (SPP 1516). This article is based in part on CMW’s master’s thesis at the University of Vienna, and early results were presented at the SPUDM 2015 conference in Budapest, Hungary. We thank Matthias Gloel for designing and piloting a preliminary version of the Turtle Island experimental scenario, and Gary Brase, Michelle McDowell, Patrice Rusconi, Laura Martignon, Katya Tentori, and Vincenzo Crupi for useful feedback. Correspondence concerning this article should be addressed to Charley M. Wu, Center for Adaptive Behavior and Cognition (ABC), Max Planck Institute for Human Development, Lentzeallee 94, 14195 Berlin, Germany. E-mail: cwu@mpib-berlin.mpg.de This document is copyrighted by the American Psychological Association or one of its allied publishers. This article is intended solely for the personal use of the individual user and is not to be disseminated broadly. Journal of Experimental Psychology: Learning, Memory, and Cognition © 2017 American Psychological Association 2017, Vol. 43, No. 8, 1274–1297 0278-7393/17/$12.00 http://dx.doi.org/10.1037/xlm0000374 1274
- 2. posed. Forming an expectation about the usefulness of a query depends on the probabilities of each outcome and their implica- tions for the hypotheses under consideration (a preposterior anal- ysis; Raiffa & Schlaifer, 1961). Computationally, calculating the expected usefulness of a query can be demanding, with part of the complexity arising from the derivation of posterior probabilities (e.g., probability that a patient has the disease given a positive test result). There is a large literature on elementary Bayesian reason- ing (for reviews see Barbey & Sloman, 2007; Brase & Hill, 2015; Koehler, 1996), studying the influence of presentation formats on the ability to derive a posterior probability; however, little is known about how presentation formats affect human behavior in other kinds of probabilistic reasoning tasks, such as information search. Currently, the only literature on this topic has shown that 1–2 hr of experience-based learning (i.e., sequential presentation of naturally sampled stimuli with immediate feedback) greatly increased the proportion of accuracy-maximizing search queries when compared with using numerical conditional probabilities (Nelson, McKenzie, Cottrell, & Sejnowski, 2010). Our key goal was to fill this gap in the literature by systematically investigating how various design features of presentation formats influence information search behavior. We specifically focused on descrip- tive presentation formats, including both numerical and visual formats, because they have the advantage of not requiring the extensive training time of experience-based learning. Presentation Formats and Bayesian Reasoning Human performance in Bayesian reasoning tasks can be sub- stantially improved by presenting information in terms of natural frequencies (Gigerenzer & Hoffrage, 1995; Meder & Gigerenzer, 2014; for a meta-analysis see McDowell & Jacobs, 2016). Natural frequencies represent the Bayesian reasoning problem in terms of joint frequencies (e.g., number of patients who test positive and have the disease), which resembles how an individual experiences events in daily life (Cosmides & Tooby, 1996). Natural frequen- cies also simplify the calculations necessary to apply Bayes’s rule for deriving a posterior probability, because base rate information is preserved (Hoffrage, Gigerenzer, Krauss, & Martignon, 2002; Kleiter, 1994). This is in contrast to the standard probability format, which provides information in terms of conditional prob- abilities (e.g., probability of a positive test result given that the individual has the disease), which requires introducing base rate information via Bayes’s rule (Gigerenzer & Hoffrage, 2007). To illustrate, consider a Bayesian reasoning task with binary hypoth- eses (disease or no disease) and a single binary outcome (positive or negative test result). The posterior probability that a patient has the disease given a positive test result can be computed using Bayes’s rule: P(diseaseⱍpos) ⫽ P(disease)P(posⱍdisease) P(disease)P(posⱍdisease) ⫹ P(no disease)P(posⱍno disease) (1) In Equation 1, the use of conditional probabilities requires explicitly considering base rate information, P(disease) and P(no disease). Substituting natural frequencies for conditional probabil- ities, the same posterior probability can be computed without reintroducing the base rate: P(disease|pos) ⫽ N(pos disease) N(pos disease) ⫹ N(pos no disease) (2) where N denotes the number of cases for each combination of disease and positive test result. The set of presentation formats that have been shown to improve Bayesian reasoning also includes formats that visualize natural frequencies (e.g., bar graphs and icon arrays), which have system- atically yielded superior estimation accuracy over numerical rep- resentations (using only words and numbers) in Bayesian inference tasks (Ancker, Senathirajah, Kukafka, & Starren, 2006; Brase, 2009; Galesic, Garcia-Retamero, & Gigerenzer, 2009; Garcia- Retamero & Hoffrage, 2013; Sedlmeier & Gigerenzer, 2001; but see Martire, Kemp, Sayle, & Newell, 2014). Additionally, studies where subjects sequentially experienced single events naturally sampled from the environment also yielded improvements over the standard probability format (Lindeman, van den Brink, & Hoog- straten, 1988; Medin & Edelson, 1988). From Bayesian Reasoning to Information Search While many Bayesian reasoning tasks in cognitive psychology deal with probability judgments about a single binary outcome, here we are concerned with information search in classification problems (Skov & Sherman, 1986), which are more complex probabilistic reasoning tasks. In the studies presented here, sub- jects were asked to choose between two information search que- ries, each with binary outcomes. The goal was to choose the query that would be most useful for improving classification accuracy. To determine which query is most useful, one must consider the probability of each outcome (e.g., probability of a positive or negative test result), as well as the usefulness of each outcome (e.g., the informational value of a test result for diagnosing a patient) for the purpose of making a classification decision. Thus, this type of information search task is considerably more complex than elementary Bayesian reasoning tasks, because it requires reasoning about two binary outcomes instead of one, interpreting the usefulness of each outcome, and forming an expectation to derive the overall usefulness of the query. There are many ways to define the usefulness of a query outcome (e.g., the reduction of uncertainty or improvement of classification accuracy), corresponding to different information search goals (for reviews, see Nelson, 2005, 2008). Because it is outside the scope of this study to determine which goal is normatively appropriate or optimal, or which goal is the most accurate description of human search behavior in general, we used an information search task where the goal was explicitly defined as the maximization of classification accuracy. This goal corresponds to selecting queries according to their ex- pected increase in classification accuracy (i.e., probability gain or any equivalent metric; Baron, 1985). Nelson and colleagues (2010) found probability gain to be the best account for how humans select queries in probabilistic categorization tasks, when information about the search environment was acquired through experience-based learning. Goals and Scope How do presentation formats influence information search decisions? We systematically examine both numerical and vi- This document is copyrighted by the American Psychological Association or one of its allied publishers. This article is intended solely for the personal use of the individual user and is not to be disseminated broadly. 1275 ASKING BETTER QUESTIONS
- 3. sual methods of presenting probabilistic information to assess the important design features that could help facilitate better information search decisions. We address two main questions. First, how are search decisions influenced by presentation for- mats and design features? Second, is search behavior mediated by probabilistic reasoning, numeracy skill, or both? The first question serves the practical purpose of identifying how infor- mation should be presented to improve search behavior. Be- cause natural frequencies and visualizations thereof have been shown to improve people’s ability to calculate posterior prob- abilities (Gaissmaier, Wegwarth, Skopec, Müller, & Broschin- ski, 2012; Gigerenzer & Hoffrage, 1995; Hoffrage et al., 2002; Micallef, Dragicevic, & Fekete, 2012), these formats may also positively influence information search behavior. Our second question examines the basis of how information search is re- lated to probabilistic reasoning and numeracy skill. Because the usefulness of a query depends on the statistical structure of the environment, we elicited judgments about the relevant proba- bilistic variables that made up the search environment, with the hypothesis that more accurate probability judgments would be a predictor for better search decisions. We also hypothesized that probability judgment accuracy would be a function of both presentation format and individual numeracy skill, as numeracy has been found to be positively related with Bayesian reasoning accuracy (Chapman & Liu, 2009; Hill & Brase, 2012; McNair & Feeney, 2015) and other decision making tasks (Bodemer, Meder, & Gigerenzer, 2014; Peters et al., 2006; Reyna, Nelson, Han, & Dieckmann, 2009). Figure 1 summarizes our initial hypotheses about the relationships between key variables. In the following section, we present prominent models of information search and describe how they can make different predictions about which query is most useful. Subsequently, we describe the theoretical motivations behind the presentation formats we investigated and present them in detail. Finally, we describe four experiments investigating the influence of these presentation formats on human search behavior, each using the same stimulus and procedure, but with different probabilistic environments. Models of Information Search We considered both Bayesian statistical models and simple heuristic strategies for modeling search behavior. Bayesian Opti- mal Experimental Design (OED) models provide a means to quantify the usefulness of a query, based on the probabilistic structure of the environment. The OED framework has been widely used to construct normative and descriptive models of human information acquisition (Baron, 1985; Bramley, Lagnado, & Speekenbrink, 2015; Klayman & Ha, 1987; Nelson, 2005; Savage, 1954; Skov & Sherman, 1986; Slowiaczek et al., 1992). OED models currently provide the best available computational- level description (Marr, 1982) of many probabilistic information search tasks (Gureckis & Markant, 2012; Nelson et al., 2010; Ruggeri, Lombrozo, Griffiths, & Xu, 2016; Ruggeri & Lombrozo, 2015; for reviews see Markant & Gureckis, 2012; Nelson, 2005). Yet, it has also been shown in some cases that simple heuristic strategies can approximate or even exactly implement particular OED models, thereby establishing a link to psychologically plau- sible mechanisms (Navarro & Perfors, 2011; Nelson, 2005, 2008; Nelson, Meder, & Jones, 2016). In the following sections, we introduce prominent OED and heuristic models of information search. OED Models OED models quantify the expected usefulness of possible que- ries within a Bayesian decision-theoretic framework (Savage, 1954). For the purposes of our study, each OED model is a candidate descriptive model of how people might intuitively eval- uate the expected usefulness of a query. We describe several OED models, each using a distinct informational utility function1 (also known as sampling norm; Nelson, 2005). We use capital Q to denote a query, where lowercase q1, . . . , qm are the m possible outcomes of the query (e.g., medical test results, or forms of a features). Because the search tasks presented in our experiments are classification tasks, we use C ⫽ {c1, . . . , cn} to denote the different hypotheses (i.e., categories). Equation 3 shows the gen- eral framework used by all OED models to quantify the expected usefulness of a query, eu(Q): eu(Q) ⫽ 兺 j⫽1 m P(qj)u(qj) (3) The various OED models differ in how they calculate the usefulness of each individual query outcome, u(qj), which may lead to disagreements about which query is most useful, corre- sponding to different information acquisition goals (Nelson, 2005; see Figure 2). We describe several prominent OED models below. Probability gain. Probability gain (PG; Baron, 1985; Nelson, 2005) values a query in terms of its expected improvement in classification accuracy, assuming that the most probable category will always be chosen. The model’s informational utility function is shown in Equation 4, where the max operators choose the leading (i.e., most likely) hypothesis given the outcome of a query and the initially leading hypothesis before any query. The differ- ence between the two terms is the probability gain of a query outcome: uPG(qj) ⫽ max i P(ci |qj) ⫺ max i P(ci) (4) Probability gain corresponds to what Martignon and Krauss (2003) have called average validity. The highest probability gain 1 Note that we only consider disinterested utility functions, which do not factor in situation-specific payoffs or search costs (see Meder & Nelson, 2012). Our experiments use a cover story where payoffs correspond to classification accuracy and there are no explicit search costs. Figure 1. The hypothesized relationships between presentation format, numeracy, probability judgment accuracy, and information search. This document is copyrighted by the American Psychological Association or one of its allied publishers. This article is intended solely for the personal use of the individual user and is not to be disseminated broadly. 1276 WU, MEDER, FILIMON, AND NELSON
- 4. query is the query that results in the highest expected improvement in classification accuracy over the initial best guess (i.e., relying solely on base rate information). Probability gain has been used as model for a variety of information acquisition tasks, such as experience-based categorization (Nelson et al., 2010), the predic- tion of eye movements where the goal is to find a target in a cluttered environment (Najemnik & Geisler, 2008), and in medical test selection (Baron, Beattie, & Hershey, 1988). In all of our experiments in this article, we explicitly identify the goal of the information search task as the maximization of classification ac- curacy, which implies that probability gain should be used to identify the most useful query. Information gain. Information gain (IG) quantifies how much a query outcome reduces the uncertainty about the hypoth- eses, where uncertainty is measured using Shannon (1948) en- tropy2 (Lindley, 1956): uIG(qj) ⫽ 兺 i⫽1 n P(ci) log2 1 P(ci) ⫺ 兺 i⫽1 n P(ci |qj) log2 1 P(ci ⱍqj) (5) While the reduction of Shannon entropy can correspond to improved classification accuracy, sometimes information gain and probability gain strongly disagree about which query is more useful (Figure 2; see Nelson, 2005; Nelson et al., 2010). In Ex- periments 1 and 2, we specifically studied search behavior in environments where the query with the highest expected reduction of Shannon entropy does not increase expected classification ac- curacy at all. It should also be noted that the expected Kullback- Leibler (KL) divergence of a query (Kullback & Leibler, 1951) is exactly equivalent to its expected information gain (Oaksford & Chater, 1996), although the usefulness of individual outcomes may differ. Therefore, when we describe information gain making a prediction about query selection, it should be understood that KL divergence always makes the same prediction. Impact. Impact quantifies the usefulness of a query as the absolute change in beliefs (Nelson, 2005, 2008; Wells & Lindsay, 1980), from the prior probability to the posterior probability of the hypotheses conditional on a query outcome (Equation 6): uImpact(qj) ⫽ 兺 i⫽1 n |P(ci|qj) ⫺ P(ci)| (6) In the case of a binary category classification task where the base rates are equiprobable (Experiment 4), the highest impact query also has the highest probability gain (Nelson, 2005). If the base rates are not equiprobable, probability gain and impact can disagree about which query is more useful, as illustrated by the search environments used in Experiments 1 and 2. Heuristic Models In addition to several OED models, we considered the possibil- ity that human search behavior might be best described with simple heuristic strategies. In principle, all of the strategies we consider, OED models and heuristics alike, can be applied to all presentation formats and probabilistic environments in our exper- iments. However, the heuristics operate directly on specific subsets of the environmental probabilities, for example test likelihoods, and may be easier to use given particular presentation formats. More important, under certain conditions heuristic strategies im- plement the same behavior as OED models (Klayman & Ha, 1987; Navarro & Perfors, 2011; Nelson, 2005; Nelson, Divjak, Gud- mundsdottir, Martignon, & Meder, 2014; Nelson et al., 2016). Likelihood difference heuristic. The likelihood difference heuristic (likDiff; Nelson, 2005; Slowiaczek et al., 1992) chooses the query with the largest absolute difference in feature likelihoods (i.e., test outcomes), for either query outcome. We can describe this using an expected usefulness function, analogous to the OED models, even though the likelihood difference heuristic does not explicitly compute expectations: eulikDiff(Q) ⫽ ⱍP(q1ⱍc1) ⫺ P(q1ⱍc2)ⱍ⫽ ⱍP(q2ⱍc1) ⫺ P(q2ⱍc2)ⱍ (7) The likelihood difference heuristic has been proven to invariably select the query with the highest impact3 (Nelson, 2005). In a medical diagnosis scenario, one could apply the likelihood difference heuristic by selecting the test with the largest absolute difference between the 2 We use Shannon entropy with log2 to measure information gain in bits, although the choice of logarithm base is arbitrary. 3 One caveat is that the likelihood difference heuristic only applies for binary classification tasks with binary features, whereas impact can apply in situations with multivalued features and any number of categories (Nelson, 2005). Figure 2. An illustration of how models can make divergent predictions about which query is more useful. In Experiment 1, probability gain predicts selection of the DE test, while information gain predicts selection of the LM test. Probability gain measures the usefulness of a query based on how much the outcome is expected to increase the probability of making a correct classification, P(correct)post – P(correct)prior, while information gain measures usefulness in terms of the reduction in Shannon entropy (in bits), Entropyprior – Entropypost. Although the LM test has a larger expected reduction in entropy, there is no change in expected classification accuracy, whereas both outcomes of the DE test result in an increase in classification accuracy. Thus, probability gain predicts selection of the DE test, while information gain predicts the LM test. See the online article for the color version of this figure. This document is copyrighted by the American Psychological Association or one of its allied publishers. This article is intended solely for the personal use of the individual user and is not to be disseminated broadly. 1277 ASKING BETTER QUESTIONS
- 5. true positive, P(positive|disease), and the false positive rate, P(positive|no disease). Probability of certainty heuristic. The probability of cer- tainty heuristic (ProbCertainty) selects the query (if any) with the highest probability of an outcome granting certainty about the true hypothesis (Nelson et al., 2010). A query outcome has certainty when the posterior probability of one of the hypotheses given an outcome qj is 1. Analogous to the likelihood difference heuristic, we can describe the probability of certainty heuristic using the OED framework by assigning the usefulness of a query outcome to 1 if it implies certainty about a hypothesis, and zero otherwise: uProbCertainty(qj) ⫽ 再1 if maxi⫽1 n P(ci|qj) ⫽ 1 0 otherwise (8) Note that an informational utility function numerically very similar to probability of certainty can be derived by substituting a high order Tsallis (1988) entropy in place of Shannon entropy within the information gain model (Crupi, Nelson, Meder, Cevolani, & Tentori, 2016). Thus, probability of certainty could also be viewed as a type of generalized information gain model. The probability of certainty heuristic was tested in Experiments 2 and 3, where we introduced certain query outcomes, and explored how the possibility of obtaining a certain outcome influenced search behavior. Information Search Scenario We devised an information search task involving the classifica- tion of artificial turtle stimuli to examine the influence of presen- tation formats on search behavior.4 In all experiments, participants were told that 100 turtles live on a remote island, with each turtle belonging to either the “Freqosian” or “Bayosian” species. The two species of turtles look identical, but differ in their genetic makeup. Thus, identification of a turtle can be aided with the help of one of two genetic tests, which constitute the available infor- mation search queries. The DE test yields truthful information about whether the D form or the E form of the DE gene is present in the turtle, while the LM test yields truthful information about the L form or the M form of the LM gene. While each turtle possesses one form of the DE gene and one form of the LM gene, the extent to which these gene forms are present varies between the two species of turtles. Thus, each test outcome provides probabilistic information about the true species of the turtle. This is a binary information search task, where there are two possible classes, C ⫽ {Bayosian, Freqosian}, and two possible search queries, QDE and QLM, with each query having two possible outcomes, QDE ⫽ {D, E} and QLM ⫽ {L, M}. Participants were given the explicit goal of choosing the test that maximizes the probability of correctly clas- sifying a randomly encountered turtle from the island. Presentation Formats We presented information about the search scenario using 14 different numeric and visual formats. While many presentations formats have been studied in the context of Bayesian reasoning, including tree diagrams (Binder, Krauss, & Bruckmaier, 2015; Sedlmeier & Gigerenzer, 2001), signal detection curves (Cole, 1989; Cole & Davidson, 1989), and Bayesian boxes (Burns, 2004), our formats were chosen for the purpose of systematically studying the influence of six design features (see Table 1) that have been prominently related to improvements in elementary Bayesian rea- soning. All design features are binary and are linked to theories about how people perform probabilistic reasoning, such as pre- senting natural frequencies instead of conditional probabilities, or highlighting part-to-whole information. All formats provide com- plete information about the probabilistic search environment, and can be used to implement any of the OED or heuristic strategies. However, the formats are not equivalent in the ease of extracting or computing specific pieces of information about the search environment, such as test likelihoods or posterior probabilities. In Herbert Simon’s (1978) terms, the formats are informationally equivalent, but not necessarily computationally equivalent. Thus, people’s tendency to use particular heuristic or OED strategies could depend on which format is used to present the probabilistic task information. Numerical formats. Four conditional probability formats and four natural frequency formats collectively comprise the numerical formats, which use words and numbers to express probabilistic information (see Table 2). All conditional probabilities were rounded to the nearest whole percentage point, while natural frequencies were derived from a population of 100 turtles. Each set of four formats was constructed using a 2 ⫻ 2 factorial design, (a) varying the type of information presented (either likelihoods or posteriors) and (b) varying the presence or absence of complement information about each binary variable. These two factors are described in detail in the subsequent design feature section. Visual formats. We tested six different visual formats, com- prised of two types of icon arrays, two types of bar graphs, and two types of dot diagrams (see Table 3). Each visual format has a likelihood variant and a posterior variant, providing a visual rep- resentation of the corresponding natural frequency format (Freq- Lik⫹ or FreqPost⫹). Stimuli were grouped by species (likeli- hoods) or by test outcome (posteriors) in the same way as the numerical natural frequency formats. The colors used in all visual formats were defined using a tool called Paletton (http://paletton .com), which allowed us to construct a symmetrically divergent and colorblind-friendly palette. Icon arrays and bar graphs are two of the most common visualizations explored in the Bayesian reasoning literature (An- cker et al., 2006; Brase, 2009; Gaissmaier et al., 2012; Galesic et al., 2009), using the number of icons or the length of a bar to represent the number of data points with each joint outcome (i.e., each relationship between species and test outcome). Icon arrays and bar graphs are unique out of the 14 formats, because they utilize spatial extent (i.e., the length of a bar or icon array) to visualize natural frequency information. We used a variant of icon arrays that are more comparable with bar graphs (i.e., a separate array for each joint outcome), rather than stacked into a single unit (in contrast to Brase, 2009; Galesic et al., 2009; Garcia-Retamero & Hoffrage, 2013), allowing us to examine differences in count- ability (see Table 1). We introduce the dot diagram as a novel format inspired by Euler diagrams (alternatively called “Venn diagrams”), which have been found to be successful at improving Bayesian reasoning 4 For screenshots of the experiment see supplemental material Figures 1–3. This document is copyrighted by the American Psychological Association or one of its allied publishers. This article is intended solely for the personal use of the individual user and is not to be disseminated broadly. 1278 WU, MEDER, FILIMON, AND NELSON
- 6. (Brase, 2009; Micallef et al., 2012; Sloman, Over, Slovak, & Stibel, 2003). One main difference is that Euler diagrams present only one particular result of a binary query, whereas the dot diagram is designed to show both of the possible test outcomes equivalently, to fairly present an information search task, as op- posed to a Bayesian reasoning task. The dot diagram uses Uniform Poisson Disk Sampling (Lagae & Dutré, 2008) to place the indi- vidual dots in an approximation of a uniform random distribution. Dots (each representing a single item) are distributed within con- tainers that highlight the part-to-whole relationships between spe- cies and test outcomes. To avoid idiosyncrasies of a particular random distribution of dots affecting search behavior, we gener- ated 20 dot diagrams for each set of probabilities and selected one at random for each participant assigned to the dot diagram condi- tion. Design Features Natural frequencies. Conditional probabilities present differ- ent quantitative information than natural frequencies (both nu- meric and visual representations, where all visual formats in this investigation are representations of natural frequencies). Condi- tional probability formats normalize likelihoods and posterior probabilities (i.e., to the interval [0, 1]) irrespective of the prior or marginal probabilities (Gigerenzer & Hoffrage, 2007), whereas natural frequencies express information about likelihoods and posteriors without normalization, incorporating the base rate and marginal probabilities. Natural frequencies are constructed as out- comes of natural sampling (Kleiter, 1994) and are frequently associated with higher Bayesian reasoning accuracy than condi- tional probabilities (Gigerenzer & Hoffrage, 1995; Hoffrage et al., 2002; Zhu & Gigerenzer, 2006; for reviews see Brase & Hill, 2015; McDowell & Jacobs, 2016). We hypothesized that the advantage of natural frequencies would also carry over to our information search task. Posterior information. For all formats, we tested a variant presenting information in terms of likelihoods and a variant pre- senting posterior probabilities. The likelihood variants provide information about the base rates (i.e., the distribution of the turtle species before any tests being performed), along with the likeli- hoods of each test outcome relative to a given species (e.g., the likelihood of a D outcome of the DE test if the turtle is Bayosian). The posterior variants provide information about the marginals (i.e., the marginal probability of a test outcome independent of species), as well as the posterior probability of a turtle belonging to a species given a specific outcome (e.g., the probability that a turtle is Bayosian given the D outcome of the DE test). It should be understood that because natural frequencies do not renormalize information, the same set of numerical quantities are presented in both likelihood and posterior variants, but are grouped differently (grouped by species or by outcome, respectively), whereas the conditional probability formats present distinctly different numer- ical quantities (because of normalization). We hypothesized that posterior variations may be more helpful for information search tasks, since all of the OED models make use of the posterior probabilities in the calculation of usefulness. If the posteriors do not need to be inferred, this simplifies the required computations. However, the likelihood difference heuristic does not require pos- terior probabilities, and it is possible that other heuristic strategies Table 1 Design Features of Presentation Formats Design feature Numerical formats Visual formats Conditional probabilities Natural frequencies Icon arrays Bar graphs Dot diagrams ProbLik ProbLik⫹ ProbPost ProbPost⫹ FreqLik FreqLik⫹ FreqPost FreqPost⫹ IconLik IconPost BarLik BarPost DotLik DotPost Natural frequencies 0 0 0 0 1 1 1 1 1 1 1 1 1 1 Posteriors 0 0 1 1 0 0 1 1 0 1 0 1 0 1 Complement 0 1 0 1 0 1 0 1 1 1 1 1 1 1 Spatial extent 0 0 0 0 0 0 0 0 1 1 1 1 0 0 Countability 0 0 0 0 1 1 1 1 1 1 0 0 1 1 Part-to-whole information 0 0 0 0 1 1 1 1 0 0 0 0 1 1 Note. 1 denotes the presence of a design feature and 0 denotes the absence. This document is copyrighted by the American Psychological Association or one of its allied publishers. This article is intended solely for the personal use of the individual user and is not to be disseminated broadly. 1279 ASKING BETTER QUESTIONS
- 7. making the same predictions as OED models would not need to compute posteriors either. Complement. Each variable in the probabilistic search envi- ronment is binary, that is, a turtle is either Bayosian or Freqosian. We tested the differences between presenting information with complement (e.g., 70% of turtles are Bayosian and 30% of turtles are Freqosian) and presenting information without complement (e.g., 70% of turtles are Bayosian). Rusconi and McKenzie (2013) have shown that the inclusion of complement information with the standard probability format improved sensitivity to the informa- tiveness of an answer, which we hypothesized would also be helpful for making search decisions. This design feature was not manipulated in the visual formats, all of which intrinsically include complement information. Spatial extent. The icon arrays and bar graphs presented in this investigation convey quantitative information using the spatial extent of an array of icons or the length of a bar, where there is a fixed ratio of area to length. In contrast, the numerical formats use words and numbers to convey information, and the dots in the dot diagrams are restricted to a container of fixed size, conveying quantitative information using density rather than spatial extent. Empirical work by Cleveland and McGill (1985; Heer & Bostock, 2010) has shown that graphical repre- sentations exploiting basic perceptual abilities, such as length comparisons, can engage automatic visual perceptual mecha- nisms, thus, reducing the required mental computation and leading to higher quantitative reasoning capabilities. Perceptual accuracy is highest when judging lengths against a common scale (e.g., when comparing the lengths of bars in a bar graph with a common axis), and progressively worse for comparing area (e.g., circles) and volumes or densities (Ancker et al., 2006). This would suggest that visualizations of natural fre- quencies using spatial extent (icon arrays and bar graphs) would reduce the computational complexity of the task and lead to better search decisions than formats using numbers (conditional probabilities and natural frequencies) or density (dot diagrams). Countability. By countability we refer to the presentation of quantitative information in discrete units. Conditional prob- abilities are not countable because they represent statistical information on a continuous scale (i.e., range from 0 to 1), whereas the numerical natural frequencies use words and num- bers to present discrete frequencies. However, when natural frequencies are translated into visualizations, countability is not necessarily preserved. With respect to the six design features (see Table 1), the only difference between the bar graphs and icon arrays in our experiments is that the discrete number of icons in an array can easily be counted, whereas the length of a bar represents information on a continuous scale rather than in discrete units. If the countability of formats has a positive effect on Bayesian reasoning or information search, we would expect to see higher performance for icon arrays compared with bar graphs. The dot diagrams are countable in principle, although the random distribution makes it considerably more difficult to arrive at the exact number. Brase (2009) found that dotted Venn Table 2 Numerical Formats Format Quantity Example Standard probability (ProbLik) P(species) Consider a turtle picked at random from the 100 turtles on the island: The probability that it is a Bayosian turtle is 70%. P(outcome|species) If a turtle is a Bayosian, then the probability that it has the D form of the DE gene is 3%. Standard probability with complement (ProbLik⫹) P(species) Consider a turtle picked at random from the 100 turtles on the island: The probability that it is a Bayosian turtle is 70%, and the probability that it is a Freqosian turtle is 30%. P(outcome|species) If a turtle is a Bayosian, then the probability that it has the D form of the DE gene is 3%, and the probability that it has the E form is 97%. Posterior probability (ProbPost) P(outcome) Consider a turtle picked at random from the 100 turtles on the island: The probability that it has the D form of the DE gene is 11%. P(species|outcome) If a turtle has the D form of the DE gene, then the probability that it is a Bayosian turtle is 19%. Posterior probability with complement (ProbPost⫹) P(outcome) Consider a turtle picked at random from the 100 turtles on the island: The probability that it has the D form of the DE gene is 11%, and the probability that it has the E form is 89%. P(species|outcome) If a turtle has the D form of the DE gene, then the probability that it is a Bayosian turtle is 19%, and the probability that it is a Freqosian turtle is 81%. Natural frequency (FreqLik) N(species) Out of the 100 turtles on the island, 70 are Bayosian turtles. N(outcome species) Out of the 70 Bayosian turtles, 2 turtles have the D form of the DE gene. Natural frequency with complement (FreqLik⫹) N(species) Out of the 100 turtles on the island, 70 are Bayosian turtles and 30 are Freqosian turtles. N(outcome species) Out of the 70 Bayosian turtles, 2 turtles have the D form of the DE gene, and 68 turtles have the E form of the gene. Posterior frequency (FreqPost) N(outcome) Out of the 100 turtles on the island, 11 have the D form of the DE gene. N(species outcome) Out of the 11 turtles with the D form of the DE gene, 2 are Bayosian turtles. Posterior frequency with complement (FreqPost⫹) N(outcome) Out of the 100 turtles on the island, 11 have the D form of the DE gene, and 89 turtles have the E form of the gene. N(species outcome) Out of the 11 turtles with the D form of the DE gene, 2 are Bayosian turtles and 9 are Freqosian turtles. Note. Examples of conditional probability and numerical natural frequencies values from Experiment 1. The corresponding values for all experiments are available in supplemental material Tables 1–4. The short names for each format are provided in brackets below the full name. P(•) refers to the probability of an item and N(•) refers to the natural frequency of an item. This document is copyrighted by the American Psychological Association or one of its allied publishers. This article is intended solely for the personal use of the individual user and is not to be disseminated broadly. 1280 WU, MEDER, FILIMON, AND NELSON
- 8. Table 3 Visual Formats in Experiment 1 Format Example Icon array (IconLik) Posterior icon array (IconPost) Bar graph (BarLik) Posterior bar graph (BarPost) Dot diagram (DotLik) Posterior dot diagram (DotPost) Note. Full format examples for all experiments available in supplemental material Tables 1–4. Short names for each format are provided in brackets below the full name. See the online article for the color version of this figure. This document is copyrighted by the American Psychological Association or one of its allied publishers. This article is intended solely for the personal use of the individual user and is not to be disseminated broadly. 1281 ASKING BETTER QUESTIONS
- 9. diagrams sometimes resulted in better Bayesian reasoning per- formance than Venn diagrams solely using the area of a con- tainer to communicate quantitative information, while Stone et al. (2003) independently proposed that the ability to derive exact quantities from a visual format accounted for increased risk perception (i.e., increased willingness to pay for a product with a lower posterior probability of a negative outcome). These hypotheses were further tested by Micallef et al. (2012), who found that Euler diagrams with randomly distributed dots (similar to dotted Venn diagrams) led to the highest Bayesian reasoning performance, compared with other variations that incorporated ordered icon arrays and better facilitated counting, in contrast to Brase (2009). Thus, it is not yet clear whether countability is important or helpful for Bayesian reasoning, although it may be beneficial in a search task. Part-to-whole information. By part-to-whole information we refer to the ability to relate the proportion of a set of objects (e.g., patients who test positive and have the disease) to any larger set of objects (e.g., patients who test positive). A review by Ancker and colleagues (2006) on the effectiveness of visual formats in conveying health-related risk proposed that part-to- whole information substantially improved risk perception. Sim- ilar notions of “nested-set relations” (Neace, Michaud, & Bol- ling, 2008; Sloman et al., 2003; Stone et al., 2003) or the “subset principle” (Johnson-Laird, Legrenzi, Girotto, Legrenzi, & Caverni, 1999) have also been proposed as explanation for the effectiveness of natural frequencies in Bayesian reasoning tasks, which by definition contain part-to-whole information, whereas conditional probabilities do not (Gigerenzer & Hof- frage, 2007). Because numeric formats are also differentiated by other design features, we used differences between visual formats to examine the influence of part-to-whole information on search decisions. We designed the dot diagrams to provide accessible information about the part-to-whole relationships between all features of the environment, for example, that the number of Bayosian turtles with the D form of the DE gene represents a portion of the total number of Bayosian turtles, as well as a portion of the total number of turtles with the D form. In contrast, the design of our icon arrays and bar graphs do not present part-to-whole information with the same accessibility as the dot diagrams, because each combination of gene form and species is expressed as a separate entity. Numeric natural frequen- cies are always expressed in relation to the larger set of objects (e.g., out of the 70 Bayosian turtles, 2 turtles have the D form of the DE gene), and provide more accessible part-to-whole informa- tion than icon arrays or bar graphs. If part-to-whole information has a positive influence on search behavior, we would expect to see more correct search choices for the dot diagrams and numeric natural frequencies than for icon arrays or bar graphs. Experiments We conducted four different experiments using the same pro- cedure, but each with a unique probabilistic environment. We used optimal experimental design principles to generate statistical en- vironments in which various subsets of OED and heuristic models made divergent predictions about which query is more useful. Accordingly, these environments are not necessarily representative of the distribution of search environments in the real world, but are meant to “stress test” the presentation formats in scientifically interesting cases where competing models disagree. Table 4 pro- vides the parameters for each experiment, while Table 5 provides an overview of model predictions across the search environments. Experiment 1 In Experiment 1 we used a search environment where probabil- ity gain maximally disagreed with information gain, under the constraint that no queries can lead to certain outcomes.5 The result is a search environment where probability gain predicts selection of the DE test, while information gain, impact, and the likelihood difference heuristic make the opposite prediction (LM test); prob- ability of certainty makes no prediction in this experiment because no query outcome provides certainty about the true species. Here we present the general methods used in all experiments. Method Participants and design. All experiments were conducted using the Amazon Mechanical Turk (AMT) Platform. The Eth- ics Committee of the Max Planck Institute for Human Devel- opment approved the methodology and all participants con- sented to participation through an online consent form at the beginning of the survey. Human Intelligence Tasks (HITs) were published exclusively to experienced AMT workers who had completed at least 1,000 HITs and had at least a 95% accep- tance rate on previous tasks. In total, 821 participants com- pleted Experiment 1, with four excluded because of missing data or because of a self-reported elementary or limited under- standing of English. The final sample included 817 participants (46% female, median age of 32 years, range 18–76). To make sure there was no overlap of participants between experiments, once a HIT was completed, the subject’s AMT worker ID was added to the exclusion criteria for subsequent studies. Each participant who completed the HIT was paid a fixed amount of $1.50 USD, meeting the minimum hourly wage recommended by Paolacci, Chandler, and Ipeirotis (2010) for experiments on the AMT platform. The same exclusion criteria were applied to all other experiments. Table 6 provides a full description of demographic information for all experiments. In Experiment 1, participants were randomly assigned to 1 of 14 different presentation formats upon accepting the HIT. In subse- quent experiments, we adopted a prerandomized list, to better equalize the number of participants within each condition. Within each presentation format, participants were also randomly assigned to 1 of 16 different randomizations of the probability values, to 5 A two feature, binary category search environment can be fully described using a single prior and four likelihood probabilities, assuming class- conditional independence (Jarecki, Meder, & Nelson, 2016). We randomly generated 1 million random variations of these five probabilities under the constraint that all posterior probabilities belonged in the range of .05 and .95. The environment used in Experiment 1 had the largest pairwise disagreement strength between probability gain and information gain, where we measured the preference strength of a model as the normalized difference between the expected usefulness of two queries, PStrm ⫽ 100共eum共Q1兲 ⫺ eum 共Q2兲兲 ⁄ maxPstrm, and disagreement strength as the geometric mean between the preference strength of two opposing models m1 and m2, DStrm1m2⫽ (|PStrm1 | ⫻ |PStrm2 | )0.5, if PStrm1⫻PStrm2ⱕ0. See Nelson et al. (2010) for a full description of this process. This document is copyrighted by the American Psychological Association or one of its allied publishers. This article is intended solely for the personal use of the individual user and is not to be disseminated broadly. 1282 WU, MEDER, FILIMON, AND NELSON
- 10. avoid possible confounds with aspects of the stimulus (e.g., the naming of the turtle species, the naming of the genes, and choice of colors in the visual formats).6 For the analyses, the 16 random- izations were recoded to match a single canonical variation, de- scribed in Table 4. For simplicity, we present each of the experi- ments using a randomization where selecting the DE test is the correct choice given the goal of maximizing classification accu- racy. Procedure and materials. Once participants gave their con- sent to participate in the study, they were presented with the Turtle 6 For example, swapping the query outcomes for the DE and LM test changes which query is most useful respective to each of the considered models. We then recoded the test selection and the probability judgments relative to the assigned randomization. Table 4 Search Environments Probabilities Tree diagrams for Exp. 1 Parameters Experiment 1 Experiment 2 Experiment 3 Experiment 4 Base rate DE test LM test 70% D E D E 3% 97% 30% 70% L M L M 41% 59% 93% 7% 30% 70% 30% Bayosian Freqosian Bayosian Freqosian Conditional Probability DE test LM test 70 D E D E 2 68 9 21 L M L M 29 41 28 2 30 70 30 Bayosian Freqosian Bayosian Freqosian Natural Frequency Likelihood Trees: P(Bayosian) .7 .7 .72 .5 P(Freqosian) .3 .3 .28 .5 Likelihoods P(D|Bayosian) .03 .04 .03 .1 P(E|Bayosian) .97 .96 .97 .9 P(D|Freqosian) .3 .37 .83 .8 P(E|Freqosian) .7 .63 .17 .2 P(L|Bayosian) .41 .43 .39 .1 P(M|Bayosian) .59 .57 .61 .9 P(L|Freqosian) .93 1 1 .3 P(M|Freqosian) .07 0 0 .7 Marginals DE test LM test 11% Bay. Freq. Bay. Freq. 19% 81% 76% 24% Bay. Freq. Bay. Freq. 51% 49% 95% 5% 89% 57% 43% D E L M Species Species Species Species Conditional Probability DE test LM test 11 Bay. Freq. Bay. Freq. 2 9 68 21 Bay. Freq. Bay. Freq. 29 28 41 2 89 57 43 D E L M Species Species Species Species Natural Frequency Posterior Trees: P(D) .11 .14 .25 .45 P(E) .89 .86 .75 .55 P(L) .57 .6 .56 .2 P(M) .43 .4 .44 .8 Posteriors P(Bayosian|D) .19 .2 .09 .11 P(Freqosian|D) .81 .8 .91 .89 P(Bayosian|E) .76 .78 .94 .82 P(Freqosian|E) .24 .22 .06 .18 P(Bayosian|L) .51 .5 .5 .25 P(Freqosian|L) .49 .5 .5 .75 P(Bayosian|M) .95 1 1 .56 P(Freqosian|M) .05 0 0 .44 Note. Squares in the tree diagrams denote decision nodes and circles denote chance nodes. See the online article for the color version of this figure. This document is copyrighted by the American Psychological Association or one of its allied publishers. This article is intended solely for the personal use of the individual user and is not to be disseminated broadly. 1283 ASKING BETTER QUESTIONS
- 11. Island story. Before proceeding, participants had to correctly an- swer a comprehension question to ensure that they had understood the nature of the task. Specifically, participants were asked one of four randomly selected questions about the binary nature of the DNA test, for example, “If a turtle does not have the D form of the DE gene, then which form of the gene does it have?” Responses were selected from one of the following options: “D form,” “E form,” “L form,” or “M form.” Participants were required to correctly answer this question before continuing the study. If an incorrect answer was given, participants were asked to reread the instructions and attempt a new randomly selected question. Search task and probability judgments. After completing the comprehension question, participants were given informa- tion on the environmental probabilities in one of the 14 ran- domly assigned formats, and asked to choose the test that would yield the highest chance of correctly classifying the species of a randomly selected turtle. Specifically, they were asked: “Which test is better for having the highest chance of correctly classifying the animal as either a Freqosian or a Bayosian turtle?” Once participants made a search decision, they were asked to give their estimates for 11 different probabilistic variables in the search environment. To avoid potential memory confounds, the assigned presentation format was shown again for the probability judgment task. The questions were arranged in blocks, with three questions referring to the prior probability of the species and the Table 5 Expected Utilities and Query Predictions for Each Search Environment Experiment Model Prediction (test) DE test LM test P(D) u(D) P(E) u(E) eu(DE) P(L) u(L) P(M) u(M) eu(LM) 1 Probability gain DE 11% .11 89% .06 .07 57% ⫺.19 43% .25 0 Information gain LM .18 .09 .1 ⫺.12 .6 .19 Impact LM 1.02 .12 .22 .38 .5 .44 Prob. certainty — 0 0 0 0 0 0 2 Probability gain DE 14% .1 86% .08 .08 60% ⫺.2 40% .2 0 Information gain LM .16 .12 .13 ⫺.12 .88 .28 Impact LM 1 .16 .28 .4 .6 .48 Prob. certainty LM 0 0 0 0 1 .4 3 Probability gain DE 25% .19 75% .22 .21 56% ⫺.22 44% .28 0 Information gain DE .44 .51 .49 ⫺.14 .86 .29 Impact DE 1.26 .44 .65 .44 .56 .5 Prob. certainty LM 0 0 0 0 1 .44 4 Probability gain DE 45% .39 55% .32 .35 20% .25 80% .06 .1 Information gain DE .5 .32 .4 .19 .01 .05 Impact DE .78 .64 .7 .5 .12 .2 Prob. certainty — 0 0 0 0 0 0 Note. Predictions for each model correspond to the search environments described in Table 4. For each test, P(•) denotes the probability of the outcome, u(•) denotes the utility of the outcome, and eu(•) denotes the expected utility of the test. All of the OED models compute eu(•) through a normalized mean, weighting each individual outcome utility, u(•), by the probability of the outcome, P(•). The expected utility for the most useful query is shown in bold. The likelihood difference heuristic invariably makes the same prediction as impact (proof in Nelson, 2005), so it is not listed separately. The probability of certainty (prob. certainty) heuristic makes no predictions in Experiments 1 and 4, because neither of the queries contains a certain outcome. Table 6 Participant Demographics Variable Experiment 1 Experiment 2 Experiment 3 Experiment 4 Final N 817 683 681 677 Completed HITs 821 690 684 686 Excluded 4 7 3 9 Average completion time in minutes (⫾SD) 13.8 (⫾7.7) 14 (⫾19.9) 13.1 (⫾8.8) 14.5 (⫾8.5) Gender 46% female 45% female 48% female 50% female Age Median 32 31 31 32 Mean 34 34 34 35 Range 18–76 18–83 18–73 18–71 Education High school 14% 15% 14% 12% Some university 34% 33% 37% 39% Bachelor’s degree or higher 51% 52% 48% 49% Other 1% 0% 1% 1% Note. Participants were excluded because of missing data or a self-reported elementary or limited understand- ing of English. Percentages may not add up to 100% because of rounding. This document is copyrighted by the American Psychological Association or one of its allied publishers. This article is intended solely for the personal use of the individual user and is not to be disseminated broadly. 1284 WU, MEDER, FILIMON, AND NELSON
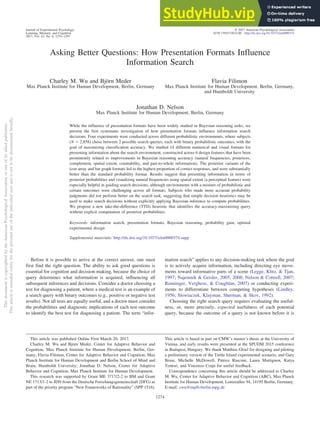
- 12. marginal probability of the outcomes of each test, four questions concerning the likelihood of a test outcome given the species, and four questions regarding the posterior probabilities of the species given the test outcomes (supplemental material Figures 4–6). The order of the three blocks was randomized across participants. Responses were given using a visual analog scale slider. As the slider was adjusted, text displayed the two complementary values of the slider (e.g., “Bayosian turtles: 70%” and “Freqosian turtles: 30%”) corresponding to its position to the nearest percentage point. Numeracy test. Subsequently, participants completed a nu- meracy test to assess their ability to comprehend and reason with numerical information. Numeracy has been shown to correlate positively with accuracy in Bayesian reasoning (Brown et al., 2011; Hill & Brase, 2012) and other tasks (Peters et al., 2006). We used a hybrid test consisting of the Schwartz, Woloshin, Black, and Welch (1997) numeracy test and the adaptive Berlin Nu- meracy Test (BNT; Cokely, Galesic, Schulz, Ghazal, & Garcia- Retamero, 2012). The choice to combine the two tests follows the recommendation of Cokely and colleagues (2012), who found that this method offers the best discriminability specific to the broad range of numeracy levels within an AMT sample population. The BNT is well suited for discriminating among highly numerate populations, whereas the Schwartz et al. test is better for discrim- inating among relatively less numerate populations. The scores for the two tests were added together, yielding a combined numeracy score in the range of 1 to 7. Upon completion of the numeracy test, participants provided demographic information and were de- briefed. Results Information search decisions. Figure 3A shows the results of the information search task, with the height of the bars representing the proportion of correct (i.e., accuracy-maximizing) queries for each format. Overall, 61% of participants chose the correct query, with the A B C D E Figure 3. Experiment 1 results. (A) Proportion of correct (accuracy-maximizing) search queries by format, (B) probability judgment error by format, (C) correct search responses by judgment error split into quartiles, (D) correct search responses by numeracy score, and (E) probability judgment error by numeracy. Bar graphs displays Agresti-Coull 95% confidence interval (CI). Box plot whiskers indicate 1.5 IQR, with the notch illustrating bootstrapped 95% CI of the median (10k replications). See the online article for the color version of this figure. This document is copyrighted by the American Psychological Association or one of its allied publishers. This article is intended solely for the personal use of the individual user and is not to be disseminated broadly. 1285 ASKING BETTER QUESTIONS
- 13. proportion varying between 27% and 86% across formats. A 2 test found that search decisions were strongly affected by format, 2 (13, N ⫽ 817) ⫽ 78.57, p ⬍ .001. The standard probability format (ProbLik) was the least helpful format for identifying the correct query, with only 27% of participants making this choice. This result was virtually identical to Nelson et al. (2010) who used the standard probability format in a similar search task. Participants given the posterior icon array (82% correct choices) or posterior bar graph (86% correct choices), both visual formats, achieved the highest proportion of correct choices, and were able to meet the same levels of performance as those who had undergone 1–2 hr of experience- based learning in Nelson et al. (2010). Consistent with the findings reported in the Bayesian reasoning literature (e.g., Gigerenzer & Hoffrage, 1995), the natural fre- quency format (FreqLik) yielded more correct responses (51%) than the standard probability format (ProbLik; 27%). However, different variants of numerical natural frequency formats did not consistently outperform the different variations of conditional probability formats. The posterior probability with complement (ProbPost⫹) was most effective out of all numerical formats (77% correct choices), suggesting that conditional probabilities can be helpful in information search tasks if the complement is added and if posterior probabilities are given, rather than in the form of priors and likelihoods associated with the standard probability format. We conducted a logistic regression to model search deci- sions, using the design features of the assigned presentation format, individual numeracy level, and probability judgment error as predictors (Table 7). Design features were coded as a binary vector relative to each presentation format (see Table 1), while numeracy levels ranged from 1 to 7, and mean absolute error was used as the measure of probability judgment error. The regression analysis provides a comparison of search be- havior at the level of design features, with the result that spatial extent, posterior information, and including complements were the strongest predictors for correct search decisions. For visual formats, using spatial extent and posterior groupings (IconPost and BarPost) were the most effective at soliciting correct search decisions, while for numeric formats, presenting posterior and complement information (ProbPost⫹ and FreqPost⫹) were also relatively effective. Our regression model also indicates that the use of natural frequencies was not a reliable predictor for search behavior, in contrast to our initial hypothesis. Countability and part-to-whole information also failed to consistently predict correct search decisions. Formats and probability judgments. In contrast to search behavior (i.e., identification of the most useful test), probability judgment accuracy did not vary substantially across formats (Figure 3B; distribution of probability judgment error per for- mat). Accordingly, a one-way between-participants analysis of variance (ANOVA) found that the mean absolute error7 of probability judgments was not significantly influenced by for- mat, F(13, 804) ⫽ 1.15, p ⫽ .31. As a manipulation check, we tested differences between formats on specific subsets of prob- ability questions. Likelihood formats (numerical and visual) had less error than their posterior counterparts on the base-rate questions, t(816) ⫽ ⫺.73, p ⬍ .001 and on the likelihood question, t(816) ⫽ ⫺.33, p ⬍ .001, whereas the posterior variants had lower error on the posterior questions than the likelihood variants, t(816) ⫽ ⫺.66, p ⬍ .001. Likelihood and posterior formats did not systematically differ on the marginal probability questions,8 t(816) ⫽ ⫺.8, p ⫽ .42. Consistent with findings from Bayesian reasoning studies (Brase & Hill, 2015; Gigerenzer & Hoffrage, 1995), natural frequency formats (FreqLik, FreqLik⫹) had less error on posterior probability judgments than their conditional probability counterparts (Prob- Lik, ProbLik⫹), t(231) ⫽ ⫺3.45, p ⬍ .001. However, the natural frequency formats were not better when aggregated over all probability judgments questions. Probability judgments and search decisions. In contrast to our initial hypothesis there was virtually no correlation (rpb ⫽ .04) between probability judgment error and the proportion of correct search decisions (Figure 3C; participants split into quartiles based on judgment error). This is supported by the regression analysis, which controls for design features and individual numeracy level (see Table 7). Similar results are obtained when judgments are broken down by question type (i.e., base rate, marginals, likeli- hoods, and posteriors). This suggests that contrary to our hypoth- esis lower probability judgment error does not necessarily lead to better search decisions. Numeracy. There was no correlation between numeracy and search decisions (rpb ⫽ .003; Figure 3D), with the regression model also finding no significant relationship (see Table 7). How- ever, higher numeracy was correlated with lower error on the probability judgment task (Pearson r ⫽ ⫺.4; Figure 3E). Thus, participants with higher numeracy performed better on the prob- ability judgment task, but had no advantage on the information search task. Discussion Experiment 1 tested a search environment where the correct response (DE test) as predicted by probability gain was in contradiction to the predictions made by information gain, impact, and the likelihood difference heuristic (LM test). Search decisions were strongly influenced by presentation for- mat, with the posterior icon array and posterior bar graphs providing the most effective means to help participants identify the correct test. The key advantage of these graphical formats is that they were able to elicit the same (correct) intuitions about the relative usefulness of a query as experience-based learning (Nelson et al., 2010), but without the same time requirements (several hundred trials of training, over 1–2 hr). Spatial extent, posteriors, and complements were the strongest predictors for correct search decisions. Contrary to our initial hypotheses, neither numeracy nor probability judgment accuracy were reli- able predictors of search behavior. Most participants presented with the posterior icon array or the posterior bar graph were able to identify the correct query, even though they were not 7 Using mean squared error (MSE) to measure performance on the probability judgment tasks yields equivalent results in all experiments. We use MAE because it provides a more intuitive representation of the mag- nitude of error. 8 The manipulation check results were replicated in all subsequent experiments, with the exception of Experiment 3, where the posterior formats had significantly lower error on the marginal questions than the likelihood formats, t(680) ⫽ 2.40, p ⫽ .017. We do not separately report the corresponding t tests for the subsequent experiments. This document is copyrighted by the American Psychological Association or one of its allied publishers. This article is intended solely for the personal use of the individual user and is not to be disseminated broadly. 1286 WU, MEDER, FILIMON, AND NELSON
- 14. any better at the probability estimation task than participants assigned to other presentation formats. Experiment 2 In Experiment 2 we introduced the possibility of certain outcomes with respect to the hypotheses under consideration, that is, one of the two search queries had a probabilistic out- come that provided certainty about the true species of a turtle. We used a search environment that was similar to Experiment 1, but adjusted so that the M result of the LM test gives 100% certainty that the turtle belongs to the Bayosian species. How- ever, the M result is only present in 40% of the turtles, and the alternative L result gives maximal uncertainty about the species (50% probability for each species). Even though the LM test has a possibility of certainty, the DE test leads to higher expected classification accuracy. In Experiment 2, the probability of certainty heuristic along with information gain, impact, and the likelihood difference heuristic predict selection of the LM test, while only probability gain predicts selection of the DE test. We expected Experiment 2 to be more difficult than Experiment 1, because of the addition of the probability of certainty heuristic as a model that disagrees with the correct probability gain prediction. In a similar information search task, the probability of certainty heuristic accounted for 42% of search decisions when subjects were given the standard probability format, but only 3% of search decisions for subjects assigned to experience- based learning (Experiments 1 and 2, Condition 4; Nelson et al., 2010). This finding suggests that when the probabilistic struc- ture of the environment is not learned through experience, the possibility of certainty is an important factor in how queries are selected. Results Information search decisions. Overall, only 36% of partic- ipants chose the correct query, compared with 61% in Experi- ment 1, with all formats having a comparatively lower propor- tion of correct responses (Figure 4A). As in Experiment 1, the posterior icon array and posterior bar graph had the highest proportion of correct responses (48% for both). However, there were no reliable differences between formats in terms of search behavior, 2 (13, N ⫽ 683) ⫽ 17.86, p ⫽ .16, which may be because of floor effects. A logistic regression analysis found that only spatial extent was a statistically reliable predictor for correct search decisions (see Table 7). Remarkably, no other design features, numeracy skill, or probability judgment error were reliable predictors for search behavior, which is a strong result given the large sample size of 683 subjects. It seems that the introduction of a certain outcome made it substantially harder for participants to identify the more useful query, and the query with the possibility of certainty was valued beyond its contribution to classification accuracy. We address this possi- bility in Experiment 3, where we isolate the prediction of the probability of certainty heuristic from all other models. Probability judgments. Consistent with Experiment 1, prob- ability judgment error was not significantly affected by presenta- tion format, F(13, 670) ⫽ 1.26, p ⫽ .24 (Figure 4B), nor was probability judgment error correlated with search decisions (rpb ⫽ .06; Figure 4C). Numeracy. Again, there was no correlation between numeracy and the proportion of probability gain search decisions (rpb ⫽ ⫺.06; Figure 4D), although higher numeracy was correlated with lower error on the probability judgment task (Pearson r ⫽ ⫺.45; Figure 4E). Both of these results were consistent with the previous experiment. Table 7 Logistic Regression Results Dependent variable: Correct search decision Model (1) (2) (3) (4) (5) (6) Variable Experiment 1 Experiment 2 Experiment 3 Experiment 4 All experiments Design features Natural frequencies ⫺.114 (.375) .028 (.354) ⫺.127 (.362) .333 (.454) .034 (.177) .042 (.187) Posteriors .662ⴱⴱⴱ (.150) .232 (.162) .223 (.163) ⫺.076 (.202) .287ⴱⴱⴱ (.077) .306ⴱⴱⴱ (.082) Complement .483ⴱⴱ (.179) ⫺.040 (.201) ⫺.114 (.198) .196 (.247) .120 (.094) .133 (.099) Spatial extent .961ⴱⴱⴱ (.271) .533ⴱ (.250) .197 (.263) ⫺.265 (.296) .343ⴱⴱ (.126) .378ⴱⴱ (.133) Countability .056 (.330) .127 (.291) .497 (.305) ⫺.744ⴱ (.376) .007 (.150) .009 (.158) Ind. differences Numeracy .043 (.048) ⫺.035 (.053) .140ⴱⴱ (.053) .361ⴱⴱⴱ (.066) .072ⴱⴱ (.025) .101ⴱⴱⴱ (.026) Probability judgments (MAE) .953 (.837) .994 (.880) ⫺.409 (.802) ⫺1.910 (1.183) ⫺.049 (.420) .209 (.441) Environment Certainty ⫺.973ⴱⴱⴱ (.083) OED model disagreement ⫺1.081ⴱⴱⴱ (.083) Constant ⫺.766ⴱ (.349) ⫺.930ⴱ (.397) ⫺.253 (.384) .437 (.446) ⫺.250 (.180) .621ⴱⴱ (.198) Observations 817 683 681 677 2,858 2,858 Classification accuracy .62 .64 .63 .80 .60 .67 Akaike Information Criterion 1,042.758 891.693 890.972 636.189 3,815.619 3,520.556 Note. Log odds are shown with SE in brackets. The part-to-whole design feature is not presented as an independent predictor, because it is entirely accounted for by taking natural frequencies without spatial extent. MAE ⫽ mean absolute error; OED ⫽ Optimal Experimental Design. Classification accuracy is 10-fold cross validation prediction accuracy. ⴱ p ⬍ .05. ⴱⴱ p ⬍ .01. ⴱⴱⴱ p ⬍ .001. This document is copyrighted by the American Psychological Association or one of its allied publishers. This article is intended solely for the personal use of the individual user and is not to be disseminated broadly. 1287 ASKING BETTER QUESTIONS
- 15. Discussion Experiment 2 produced results that resemble Experiment 1, but with the proportion of probability gain choices reduced substan- tially across all formats. No format led to consistent selection of the accuracy-maximizing query, although formats using spatial extent led to relatively better search performance. The lowered performance across all formats in Experiment 2 indicates that introducing certain outcomes may have contributed to a search problem where the accuracy-maximizing query is substantially less likely to be selected, irrespective of format. Why does the possibility of certainty create such challenging environment when the query that can lead to a certain outcome (LM test) is in opposition to the accuracy-maximizing query (DE test)? To exam- ine how certainty influences query selection by itself, we con- ducted Experiment 3 to examine search behavior in an environ- ment where the probability of certainty prediction contradicted all other models. Experiment 3 We conducted Experiment 3 to try to isolate the extent to which the possibility of a certain outcome influences search behavior, across the various presentation formats. As in Experiment 2, the LM test had a chance of yielding an M result, with the implication that the turtle is certainly Bayosian. But again, it was a risky choice, because the alternative L outcome resulted in maximal uncertainty. The main difference in the environmental probabili- ties, compared with the previous study, was that in Experiment 3, probability gain, information gain, impact, and the likelihood difference heuristic predicted selection of the DE test, while only the probability of certainty heuristic predicted selection of the LM test. Results Information search decisions. Overall, 64% of participants chose the correct query, while the remaining 36% of search A B C D E Figure 4. Experiment 2 results. (A) Across all format there was a lower proportion of correct (accuracy- maximizing) search queries compared to Experiment 1. (B) Performance on the probability judgment task replicated Experiment 1 results, with neither judgment error; (C) nor numeracy; and (D) being predictors for search decisions. (E) As in Experiment 1, there was a negative correlation between judgment error and numeracy. See the online article for the color version of this figure. This document is copyrighted by the American Psychological Association or one of its allied publishers. This article is intended solely for the personal use of the individual user and is not to be disseminated broadly. 1288 WU, MEDER, FILIMON, AND NELSON
- 16. decisions were consistent with only the probability of certainty heuristic. The proportion of correct responses varied between 47 and 73% (Figure 5A), but there was no overall difference between formats, 2 (13, N ⫽ 681) ⫽ 17.91, p ⫽ .16. The logistic regression analysis found no statistically reliable pre- dictors for search behavior from the set of design features (see Table 7). Thus, none of the design features nor individual presentation formats we tested yielded a systematic advantage in this particular search environment. Probability judgments. There were differences between for- mats on the probability judgment task, F(13, 668) ⫽ 2.32, p ⫽ .005; however, the descriptive statistics indicate that the overall effect is mainly because of the likelihood variants of the natural frequency formats (FreqLik, FreqLik⫹) having lower error than the other formats (Figure 5B). If these two conditions are ex- cluded, an ANOVA shows no significant differences, F(11, 569) ⫽ 1.2, p ⫽ .28. No correlation was found between judgment error and search decisions (rpb ⫽ ⫺.07; Figure 5C), which is consistent with the regression analysis (see Table 7). Together with the previous findings, this suggests that probability judgment error had no bearing on search decisions. Numeracy. In contrast to Experiments 1 and 2, we found a small correlation between numeracy and search decisions (rpb ⫽ .12; Figure 5D). This suggests that numeracy may be a predictor for search behavior when the more useful query is relatively obvious, which could be the case in Experiment 3 where probability gain, information gain, impact, and the like- lihood difference heuristic all make the same prediction. In- deed, numeracy skill was the only reliable predictor for search decisions in the regression model (see Table 7). On the other hand, as in all previous experiments, numeracy was strongly correlated with performance on the probability estimation task A B C D E Figure 5. Experiment 3 results. (A) Sixty-four percent of subjects (aggregated across formats) chose the correct accuracy-maximizing query, with the remaining choices consistent with only the probability of certainty heuristic, of the models in consideration. There were no differences in search behavior across formats, although we found that the natural frequency formats (FreqLik and FreqLik⫹) had lower probability judgment error than the other formats (B). Judgment error was not a predictor for search decisions (C), although higher numeracy was weakly related to better search choices (rpb ⫽ .12; D). The negative correlation between judgment error and numeracy was replicated (E). See the online article for the color version of this figure. This document is copyrighted by the American Psychological Association or one of its allied publishers. This article is intended solely for the personal use of the individual user and is not to be disseminated broadly. 1289 ASKING BETTER QUESTIONS
- 17. (Pearson r ⫽ ⫺.47; Figure 5E). The correlation between nu- meracy and probability judgment accuracy is a robust finding, which appears to be independent of the task environment. Discussion Sixty-four percent of subjects correctly selected the DE test, which was predicted by all of the OED and heuristic models with the sole exception of the probability of certainty heuristic. This suggests that by itself, the possibility of obtaining a certain out- come influenced search decisions a great deal. To understand more precisely how much the possibility of certainty influences behav- ior, it is important to have an idea of the highest performance that can be obtained. We address this in our final experiment. Experiment 4 We conducted one further experiment to assess the upper range of performance with respect to the experimental methods and subject population, in which there was no disagreement among model pre- dictions. Experiment 4 used an environment with similar model predictions as Experiment 3, but without any certain outcomes. Prob- ability gain, information gain, impact, and the likelihood difference heuristic all made the same prediction (DE test), while the probability of certainty heuristic made no prediction. This experiment was unique in that no model disagreed with the probability gain prediction. Results Information search decisions. Participants in all formats reli- ably chose the correct query (80% overall, range: 73–88%), which was the highest proportion out of all experiments (Figure 6A). In comparison with Experiment 3 (64% correct choices), which had a similar relationship between models, but without the possibility of a certain outcome, we can infer that a strategy corresponding to the probability of certainty heuristic accounted for a difference of about 16 percentage points (95% confidence interval [12, 21], Wilson score interval). There were no differences in search choice between formats, A B C D E Figure 6. Experiment 4 results. (A) With no divergence between model predictions, the majority of subjects, regardless of format, chose the correct accuracy-maximizing query (80% aggregated across formats). (B) There were no substantial differences in judgment error across formats. (C) In this experiment, there were correlation between (C) search decisions and judgment error (rpb ⫽ ⫺.16) and (D) between search decisions and numeracy (rpb ⫽ .25). (E) A negative correlation between judgment error and numeracy was found, as in all previous experiments, suggesting that this is a robust result. See the online article for the color version of this figure. This document is copyrighted by the American Psychological Association or one of its allied publishers. This article is intended solely for the personal use of the individual user and is not to be disseminated broadly. 1290 WU, MEDER, FILIMON, AND NELSON
- 18. 2 (13, N ⫽ 677) ⫽ 12.92, p ⫽ .45. The logistic regression analysis found that from the set of design features, only countability was a reliable predictor; however, countability had a negative effect on performance (see Table 7). Probability judgments. Format did not have an effect on prob- ability judgments, F(13, 664) ⫽ 1.18, p ⫽ .29 (Figure 6B). Taken together with the previous experiments, our results suggest that no single format has an overall advantage on the probability judgment task, although there were differences for specific subsets of questions. For the first time, we found a weak negative correlation (rpb ⫽ ⫺.16) between probability judgment error and correct search behavior (Fig- ure 6C); however, when controlling for differences in design features and numeracy skill, our regression model indicates that judgment error is not a reliable predictor for search decisions (see Table 7). In the context of all previous experiments, people who are able to make more accurate probability judgments do not seem to perform any better in the search task. Numeracy. Higher numeracy scores were correlated with a higher proportion of accuracy-maximizing search decisions (rpb ⫽ .25; Figure 6D). This was a stronger correlation than in Experi- ment 3, whereas no correlations were found for Experiments 1 and 2. These results are consistent with the regression models, which found significant effects of numeracy on search behavior in Ex- periments 3 and 4 (see Table 7). One explanation for this result is that with an easier task (i.e., less disagreement among the models considered), numeracy may be a predictor for search decisions. Numeracy was also correlated with lower error on the probability judgment task (Pearson r ⫽ ⫺.42; Figure 6E), consistent with all previous experiments. Discussion In Experiment 4, where all models predicted selection of the DE test (with the exception of the probability of certainty heuristic that made no prediction), we measured the highest proportion of correct query selections out of all the experiments (80% overall). Countability was the only statistically reliable predictor for search behavior among the design features, but it had a negative contribution toward correct choices. Numeracy was a reliable predictor for search choice, as in Experiment 3. Therefore, one might conclude that high numeracy is helpful in simple environments in which there is no disagreement among the heuristic and OED models’ predictions. However, not even the highest level of numeracy was adequate for more difficult prob- abilistic environments. General Discussion Our aims in this study were both practical and theoretical: to explore how search decisions are influenced by presentation formats and design features, while addressing the theoretical question of whether search behavior is mediated by probabilistic reasoning, nu- meracy skill, or both. We studied how search behavior and probability estimation varied across 14 different numerical and visual presenta- tion formats, in four different search environments. Table 8 presents an overview of statistical tests conducted in each experiment; Figure 7 shows the results aggregated over all experiments. We extended the logistic regression analysis by aggregating over all four experiments (see Table 7), with Model 5 using the same predictors as in the individual experiments and with Table 8 Overview of Experiments Experiment Correct search queries Influence of Format on Probability judgment error and search decisions Relationship between numeracy and Search decision Probability judgment error Search decision Probability judgment error 1 (n ⫽ 817) 61%, range: [27–86%] 2 (13, N ⫽ 817) ⫽ 78.57, p ⬍ .001 F(13,804) ⫽ 1.15, p ⫽ .31 r pb ⫽ ⫺.04 r pb ⫽ .003 r ⫽ ⫺.40 2 (n ⫽ 683) 36%, range: [21–48%] 2 (13, N ⫽ 683) ⫽ 17.86, p ⫽ .16 F(13,670) ⫽ 1.26, p ⫽ .24 r pb ⫽ ⫺.06 r pb ⫽ ⫺.06 r ⫽ ⫺.45 3 (n ⫽ 681) 64%, range: [47–73%] 2 (13, N ⫽ 681) ⫽ 17.91, p ⫽ .16 F(13,668) ⫽ 2.32, p ⫽ .005 r pb ⫽ ⫺.07 r pb ⫽ .12 r ⫽ ⫺.47 4 (n ⫽ 677) 80%, range: [71–88%] 2 (13, N ⫽ 677) ⫽ 12.92, p ⫽ .45 F(13,664) ⫽ 1.18, p ⫽ .29 r pb ⫽ ⫺.16 r pb ⫽ .25 r ⫽ ⫺.42 Overall (n ⫽ 2,858) 60%, range: [45–71%] 2 (13, N ⫽ 2,845) ⫽ 52.66, p ⬍ .001 F(13,2845) ⫽ 2.87, p ⫽ .001 r pb ⫽ ⫺.02 r pb ⫽ .05 r ⫽ ⫺.43 Note. Performance on the probability judgment task is measured in terms of mean absolute error across all 11 questions. Thus, a negative correlation between numeracy and probability judgments signifies that higher numeracy skill is a predictor for lower error. This document is copyrighted by the American Psychological Association or one of its allied publishers. This article is intended solely for the personal use of the individual user and is not to be disseminated broadly. 1291 ASKING BETTER QUESTIONS
- 19. Model 6 adding two environmental factors (that vary across the individual experiments) as binary predictors. Certainty denotes environments where there is the possibility of a query outcome leading to certainty about the true species of a turtle, which in our case was always in opposition to the correct probability gain query (Experiments 2 and 3). OED Disagreement denotes environments where there is disagreement between OED mod- els, specifically when the probability gain prediction is in opposition to the prediction made by information gain, impact, and the likelihood difference heuristic (Experiments 1 and 2). These two environmental factors are able to describe all four experiments as a 2 ⫻ 2 factorial design. Both aggregate models yield similar estimates of the log odds for shared predictors, although Model 6 achieves higher classification accuracy and a lower AIC by including environmental factors. The Role of the Environment Environments where the probability gain prediction disagreed with the probability of certainty heuristic or with other OED models were more difficult, with similar reductions to the log odds of making a correct search decision (see Table 7). Why did these factors contribute toward a substantially more difficult search task? Hogarth and col- leagues (Hogarth, Lejarraga, & Soyer, 2015) have introduced the notion of kind and wicked environments, where wicked environments represent a disjoint between learning and test environments. Are the environments we tested wicked in this sense? We unfortunately do not know the true distribution of search environments in the world. As a first step to address this question, we conducted simulations over 10 million randomly generated environments,9 and considered the rela- tionship of the predictions made by each of the OED and heuristic models in a pairwise manner. In cases where both competing models 9 We randomly generated 10 million sets of the five probabilistic vari- ables (prior probability and test likelihoods) that fully describe a search environment, like the ones presented in this study. For each environment, we conducted pairwise comparisons between model predictions. Simulation code is available at https://github.com/charleywu/AskingBetterQuestions. For simulations of a larger variety of OED models, see supplemental material from Nelson (2005). A B C D E Figure 7. Summary of all experiments. (A) Aggregated over all experiments, the choice of format led to noticeable differences in the proportion of correct search decisions, but not in judgment error (B). Probability judgment error (C) was not correlated with search behavior, while each incremental change in numeracy had a small influence on search decisions (D). High numeracy skill was a robust predictor for lower judgment error (E). See the online article for the color version of this figure. This document is copyrighted by the American Psychological Association or one of its allied publishers. This article is intended solely for the personal use of the individual user and is not to be disseminated broadly. 1292 WU, MEDER, FILIMON, AND NELSON
- 20. made a prediction, information gain and probability gain made the same prediction 92% of the time; the probability of certainty heuristic and probability gain made the same prediction 77% of the time; and information gain and the probability of certainty heuristic made the same prediction 83% of the time. This illustrates a potential tension between using OED princi- ples to test environments where we can disentangle overlapping model predictions, and environments that are representative of search problems experienced in the wild. The use of heuristics, such as the probability of certainty, may represent an ecologically valid strategy because of a correspondence with the correct prob- ability gain query in most environments, trading off computational complexity for accuracy. However, this still poses a challenge to the design of presentation formats for conveying statistical infor- mation about search problems, because we are seeking formats that are robust across different types of environment. Indeed, in Nelson et al. (2010) the possibility of certainty did not influence partici- pants assigned to the experience-based learning conditions, who preferentially selected the higher probability gain query in every statistical environment that was tested. We have not identified numeric or graphical formats that consistently lead to as high of rates of selection of the probability gain test as experience-based learning. However, across all our experiments, we found that some formats and design features were better than others in soliciting correct search decisions. Presentation Formats and Search Decisions Aggregated over all experiments (Figure 7A), the posterior bar graph and posterior icon array had the highest performance (69 and 71% correct choices, respectively), and the standard probability format (ProbLik) had the lowest performance (45%). The logistic regression analysis shows that from the set of design features, spatial extent and posterior information were the only statistically reliable predictors for search behavior (Model 6, Table 7). There- fore, the present findings suggest that bar graphs or icon arrays are the most helpful for information search problems, where the un- derlying natural frequency information is conveyed using spatial extent, and the information is grouped by primarily by query outcome, as in our posterior formats. In contrast to results from the Bayesian reasoning literature and our own initial hypotheses, the other design features did not consistently influence search behavior across environments. Given the large (N ⫽ 2,858) sample size, we take the lack of statistically significant results for natural frequencies, complement informa- tion, countability, and part-to-whole information as strong evi- dence against our hypotheses that these design features (by them- selves) facilitate adaptive information search. Among the classes of presentation formats (conditional proba- bilities, natural frequencies, and graphical visualizations), the larg- est variability in performance was found within the four condi- tional probability formats. Presenting information in terms of posteriors and including complement information led to enhanced performance for the conditional probability formats, although these same design features did not substantially influence the natural frequency formats (Figure 7A). Aggregating across the experiments, the posterior probability with complement format (ProbPost⫹) led to a similar proportion of correct search choices (68%) as the posterior icon array (69%) and posterior bar graph formats (71%). An interesting finding was that the posterior prob- ability format with complement (ProbPost⫹) led to a higher pro- portion of correct choices (68%) than any of the numeric natural frequency formats (that ranged from 57 to 61%). This, combined with natural frequencies failing to be a predictor in the regression model (see Table 7), suggests that numeric natural frequencies are not necessarily more advantageous for information search prob- lems than conditional probabilities—if they are presented in the right way (i.e., not the standard probability format). Posterior bar graphs, despite not being countable, led to as good of performance as the posterior icon arrays, and to better perfor- mance than any of the numeric natural frequency formats. This suggests that countability is not necessary for communicating probabilistic information for information search. Furthermore, out of all the formats we studied, icon arrays and bar graphs were the only formats that represented natural frequencies using spatial extent, a perceptual attribute. Spatial extent was found to be one of the best predictors for correct test selection in the regression analysis, suggesting that it may be an important design feature for communicating probabilistic information in search tasks. Not all visual formats were successful, with the dot diagrams leading to fewer accuracy-maximizing search decisions than icon arrays or bar graphs. Thus, the increased accessibility of part-to- whole information did not compensate for the lack of spatial extent, which were the two design features differentiating the dot diagrams from icon arrays and bar graphs. Future studies should test whether providing part-to-whole information could be helpful if combined with spatial extent (e.g., using stacked icon arrays). Information Search and Probabilistic Reasoning In contrast to our initial hypothesis, the ability to make accurate probability judgments was not related to search behavior (Figure 7C), nor was it a predictor in the logistic regression model, when controlling for differences in design features and numeracy skill. This suggests that presentation formats that improve explicit Bayesian reasoning accuracy do not necessarily transfer to more complex decision-making tasks, such as information search, even though information search can be modeled “as if” it is based on Bayesian reasoning processes. Of course, improving explicit prob- ability judgments may be useful in some situations (e.g., where doctors need to explicitly explain the meaning of a test result in terms of posterior probabilities to a patient). However, people can sometimes make decisions that correspond to the correct applica- tion of Bayes’s rule without calculating the correct probability estimates (Domurat, Kowalczuk, Idzikowska, Borzymowska, & Nowak-Przygodzka, 2015). In our studies, the ability to reason about information search decisions seems to be largely indepen- dent from the ability to explicitly estimate probabilities. Numeracy was robustly correlated with probability judgment accuracy in all experiments (Figure 7E), and may also be helpful in information search tasks (Figure 7D). We found weak correla- tions between numeracy and search decisions in Experiments 3 and 4; however, these relationships were not found in Experiments 1 and 2, which, judging by the disagreement among model pre- dictions and the overall rates of probability gain queries, were substantially more difficult. Aggregated across all experiments, numeracy was a statistically reliable predictor for correct search decisions (see Table 7). Using Model 6 from the regression anal- This document is copyrighted by the American Psychological Association or one of its allied publishers. This article is intended solely for the personal use of the individual user and is not to be disseminated broadly. 1293 ASKING BETTER QUESTIONS