Numbers Can Be Worth a Thousand Pictures:
Individual Differences in Understanding Graphical and
Numerical Representations of Health-Related Information
Wolfgang Gaissmaier and Odette Wegwarth
Max Planck Institute for Human Development
David Skopec, Ann-Sophie Müller, and
Sebastian Broschinski
Zurich University of the Arts
Mary C. Politi
Washington University School of Medicine
Objective: Informed medical decision making requires comprehending statistical information. We aimed
to improve the understanding of conveying health-related statistical information with graphical repre-
sentations compared with numerical representations. First, we investigated whether the iconicity of
representations (i.e., their abstractness vs. concreteness) affected comprehension and recall of statistical
information. Second, we investigated whether graph literacy helps to identify individuals who compre-
hend graphical representations better than numerical representations. Method: Participants (N � 275)
were randomly assigned to receive different representations of health-related statistical information,
ranging from very low iconicity (numbers) to very high iconicity (icon arrays including photographs).
Comprehension and recall of the information were assessed. Additionally, participants rated the acces-
sibility of the information and the attractiveness of the representation. Graph literacy was assessed by
means of a recently developed scale. Results: The only difference between representations that affected
comprehension and recall was the difference between graphics and numbers; the actual level of iconicity
of graphics did not matter. Individuals with high graph literacy had better comprehension and recall when
presented with graphics instead of numbers, and they rated graphical information as more accessible than
numerical information, whereas the reverse was true for individuals with low graph literacy, F(4, 185) �
2.60, p � .04, �p
2 � .05, and F(4, 245) � 2.71, p � .03, �p
2 � .04, respectively. Both groups judged
graphical representations as more attractive than numerical representations. Conclusion: An assessment
of graph literacy distinguished individuals who are best informed with graphical representations of
statistical information from those who are better informed with numerical representations.
Keywords: graph literacy, health literacy, icon arrays, medical decision making, risk communication
Supplemental materials: http://dx.doi.org/10.1037/a0024850.supp
Increasing efforts have been made to involve patients in medical
decisions (Barry, 1999; Gigerenzer & Gray, 2011; O’Connor et al.,
2007). To engage in informed and shared decision making, both
physicians and patients must evaluate and discuss the benefits and
harms of treatment options, which requires comprehending statis-
tical information. However, many people, including experts, have
difficulty understanding health statistics (see Gigerenzer,
Gaissmaier, Kurz-Milcke, Schwartz, & Wo.
Numbers Can Be Worth a Thousand PicturesIndividual Differen.docx
1. Numbers Can Be Worth a Thousand Pictures:
Individual Differences in Understanding Graphical and
Numerical Representations of Health-Related Information
Wolfgang Gaissmaier and Odette Wegwarth
Max Planck Institute for Human Development
David Skopec, Ann-Sophie Müller, and
Sebastian Broschinski
Zurich University of the Arts
Mary C. Politi
Washington University School of Medicine
Objective: Informed medical decision making requires
comprehending statistical information. We aimed
to improve the understanding of conveying health-related
statistical information with graphical repre-
sentations compared with numerical representations. First, we
investigated whether the iconicity of
representations (i.e., their abstractness vs. concreteness)
affected comprehension and recall of statistical
information. Second, we investigated whether graph literacy
helps to identify individuals who compre-
hend graphical representations better than numerical
representations. Method: Participants (N � 275)
were randomly assigned to receive different representations of
health-related statistical information,
ranging from very low iconicity (numbers) to very high
iconicity (icon arrays including photographs).
2. Comprehension and recall of the information were assessed.
Additionally, participants rated the acces-
sibility of the information and the attractiveness of the
representation. Graph literacy was assessed by
means of a recently developed scale. Results: The only
difference between representations that affected
comprehension and recall was the difference between graphics
and numbers; the actual level of iconicity
of graphics did not matter. Individuals with high graph literacy
had better comprehension and recall when
presented with graphics instead of numbers, and they rated
graphical information as more accessible than
numerical information, whereas the reverse was true for
individuals with low graph literacy, F(4, 185) �
2.60, p � .04, �p
2 � .05, and F(4, 245) � 2.71, p � .03, �p
2 � .04, respectively. Both groups judged
graphical representations as more attractive than numerical
representations. Conclusion: An assessment
of graph literacy distinguished individuals who are best
informed with graphical representations of
statistical information from those who are better informed with
numerical representations.
Keywords: graph literacy, health literacy, icon arrays, medical
decision making, risk communication
Supplemental materials:
http://dx.doi.org/10.1037/a0024850.supp
Increasing efforts have been made to involve patients in medical
decisions (Barry, 1999; Gigerenzer & Gray, 2011; O’Connor et
al.,
2007). To engage in informed and shared decision making, both
3. physicians and patients must evaluate and discuss the benefits
and
harms of treatment options, which requires comprehending
statis-
tical information. However, many people, including experts,
have
difficulty understanding health statistics (see Gigerenzer,
Gaissmaier, Kurz-Milcke, Schwartz, & Woloshin, 2007, and
Reyna, Nelson, Han, & Dieckmann, 2009, for recent reviews).
Consequently, recent research has investigated how to better
inform individuals about risks and benefits of screening or
treatment options and how best to present numbers to represent
risks (Fagerlin, Ubel, Smith, & Zikmund-Fisher, 2007; Giger-
enzer et al., 2007; Hoffrage, Lindsey, Hertwig, & Gigerenzer,
2000). In addition, a variety of graphical representations can
improve understanding of risks (Ancker, Senathirajah, Ku-
kafka, & Starren, 2006; Kurz-Milcke, Gigerenzer, & Marti-
gnon, 2008; Zikmund-Fisher, Ubel, et al., 2008). However, in a
recent review of best practices for risk communication, Lipkus
(2007) criticized the lack of theory with regard to the impact of
graphical displays.
In this study, we aimed to improve the understanding of
conveying health-related statistical information with graphical
representations compared with numerical representations in two
This article was published Online First August 15, 2011.
Wolfgang Gaissmaier and Odette Wegwarth, Harding Center for
Risk
Literacy, Max Planck Institute for Human Development, Berlin,
Germany;
David Skopec, Ann-Sophie Müller, and Sebastian Broschinski,
Department of
5. gated whether there are individual differences in comprehen-
sion of and preferences for graphical versus numerical
information.
Impact of Iconicity on Comprehension and Recall
Iconicity refers to how much a representation resembles what
it is supposed to represent versus the extent to which it is an
abstraction (e.g., Moles, 1958/1968; Morris, 1946/1955). We
believe that iconicity could be a useful concept in the domain of
risk communication to understand differences between numer-
ical and graphical representations and between different kinds
of graphical representations. Numbers represent information
with low iconicity, because they are strong abstractions; graph-
ics are of higher iconicity, and increasingly so the more real-
istically they depict what they represent (e.g., using actual
photographs).
One advantage of representations with low iconicity, such as
mere numbers, could be that the information is reduced to its
essential elements, eliminating unnecessary and potentially dis-
tracting features. Gathering precise numerical knowledge from
more highly iconic graphical representations requires additional
steps such as counting, whereas this information can simply be
read off from numbers. For precise, verbatim knowledge, num-
bers alone could therefore be better representations. In line with
this hypothesis, Feldman-Stewart, Kocovski, McConnell,
Brundage, and Mackillop (2000) showed that numbers allowed
a better assessment than graphical representations of what they
called “detailed-level information,” which is similar to what we
refer to as verbatim knowledge.
However, Feldman-Stewart et al. (2000) showed that for what
they called “gross-level information,” graphical representations
were better than numbers. Gross-level information refers to
ordinal
6. relations between quantities—for instance, that one quantity is
bigger than another—without specifying exactly how much
bigger.
Building on those results, we tested whether high iconicity
better
enables people to acquire such knowledge, which we refer to as
gist knowledge (i.e., qualitative bottom-line meaning; Reyna,
2008). Some evidence has shown, for instance, that symbols are
easier to learn if they are of higher iconicity and thus are closer
to
what they actually represent (Mirenda, 2003) and that charts are
better suited to convey gist knowledge than are numbers
(Hawley
et al., 2008).
A second advantage of high iconicity could be that it makes it
easier to recall the information. A classic finding in cognitive
psychology is that compared with words, pictorial information
has
a memory advantage (e.g., Paivio, Rogers, & Smythe, 1968;
Park,
Puglisi, & Sovacool, 1983; Shepard, 1967). Therefore, it could
also be that highly iconic graphics are recalled more easily than
numbers. Recall is an important aspect of making informed
med-
ical decisions, because one will often make or discuss such
deci-
sions when no information is laid out conveniently in front of
oneself.
Individual Differences in Comprehension and Recall of
Graphical Versus Numerical Information
The key assumption here is that there is no one-size-fits-all
way of communicating risks; rather, different individuals can
best be informed by different representations. Although using
7. graphical information is generally recommended for facilitating
risk comprehension (e.g., Paling, 2003), interpreting graphics
requires additional skills beyond understanding numerical risks.
Thus, one cannot assume that everyone intuitively understands
graphics (Galesic & Garcia-Retamero, in press).
Instruments designed to measure the ability to understand quan-
titative information in health have thus far largely focused on
numeracy—the ability to understand numerical information
(e.g.,
Lipkus, Samsa, & Rimer, 2001; Reyna & Brainerd, 2007;
Schwartz, Woloshin, Black, & Welch, 1997). Moreover, no
stan-
dard instrument measuring the more general construct of health
literacy (or aspects thereof) includes a systematic measurement
of
graph comprehension, even though they include quantitative
skills
as an important component (e.g., Baker, 2006; Parker, Baker,
Williams, & Nurss, 1995).
Therefore, Galesic and Garcia-Retamero (in press) recently de-
veloped a graph literacy scale that assesses the ability to under-
stand graphical information about health. They demonstrated
that
only those people who had high graph literacy benefitted from
graphical information that complemented numbers (Garcia-
Retamero & Galesic, 2010). We tested whether graph literacy
therefore predicts individual differences in comprehension of
and
preference for graphical versus numerical information.
Overview of the Study and Hypotheses
The general task was designed to carefully assess how well
participants could comprehend and recall health-related
8. informa-
tion that we provided to them, in relation to two independent
variables, (a) how the information was represented in terms of
iconicity, ranging from numbers to highly iconic graphics and
(b)
individual differences in graph literacy. In line with Edwards
and
Elwyn’s (1999) call for using more than one way to assess the
success of different kinds of risk communication, outcome mea-
sures included both more objective knowledge questions (i.e.,
gist
and verbatim) about health-related information and more
subjec-
tive assessments of accessibility of the information and
attractive-
ness of the representations. Moreover, we compared the compre-
hension of information when materials were laid directly in
front
of participants to recall at two later time points (i.e., after
approx-
imately 30 min and after approximately 2 weeks).
Our first hypothesis was that highly iconic representations
would result in better gist knowledge of the information than
lesser
iconic representations, whereas the reverse should hold true for
verbatim knowledge. In addition, we hypothesized that higher
iconicity would particularly benefit recall. Our second
hypothesis
is that people with high graph literacy can particularly acquire
and
recall knowledge better with graphics than with numbers. It is
an
open question whether the comprehension and recall of people
with low graph literacy do not improve with graphics alone
rather
9. than with numbers or whether they are actually better off with
287NUMBERS CAN BE WORTH A THOUSAND PICTURES
numbers.1 Both hypotheses were primarily concerned with the
objective knowledge questions, and whether the results would
be
mirrored on the more subjective assessments was an exploratory
question.
Method
Design
We used two health-related topics in this study. The first topic
was a comparison of the frequency of benefits and side effects
of
three painkilling medications (i.e., aspirin, ibuprofen, and
parac-
etamol �acetaminophen�) in comparison to placebo
(hereinafter
referred to as medication). The clinical evidence was taken from
three Cochrane reviews (Derry, Derry, Moore, & McQuay,
2009;
Edwards et al., 1999; Toms, Derry, Moore, & McQuay, 2009).
The
second topic was the impact of smoking on the risk of dying
from
lung cancer, colon cancer, prostate cancer, heart disease, stroke,
and chronic obstructive pulmonary disease (hereinafter referred
to
as smoking). The clinical evidence was taken from Woloshin,
Schwartz, and Welch (2008). Note that all numbers were simpli-
fied by rounding to improve understanding. For an overview of
10. the
clinical evidence, see Table S1 in the supplemental online mate-
rials.
On the basis of the topics medication and smoking, we devel-
oped three kinds of visualizations in collaboration with the
Zurich
University of the Arts under the direction of David Skopec (see
Table 1). For each kind of visualization, there were five levels
of
iconicity (Table 1). Note that for all visualizations, numbers
alone
correspond to the lowest level of iconicity (Level 1, in column
2),
and the highest level of iconicity included photographs in all
three
kinds of visualizations (Level 5, in column 6). The
representations
in between (i.e., Levels 2– 4, columns 3–5) are graphical
abstrac-
tions of the photographs, which become more and more similar,
but not identical, to the photographs with increasing iconicity.
All graphics represented icon arrays at various levels of abstrac-
tion, with the exception of the most abstract graphics (i.e.,
Table 1,
column 3), which are probably more similar to horizontal bar
charts (medication–stick figures, smoking–stick figures) or pie
charts (medication–pills). However, even those graphics shared
an
important feature with the icon arrays, namely that they had
clearly
separated and countable units. Two different kinds of
visualization
were developed by the same designer (Ann-Sophie Müller) for
the
11. first topic (medication). The first kind of visualization
(medication–stick figures) showed horizontally aligned units
that
appeared increasingly humanlike with increasing iconicity. The
second kind of visualization (medication–pills) showed
circularly
aligned units that looked increasingly pill-like with increasing
iconicity. Using these two different kinds of visualizations
based
on the same topic allowed us to check whether our findings
were
the same in both cases. To test whether these results would also
extend to a different topic, smoking, a separate designer
(Sebastian
Broschinski) developed a third kind of visualization (smoking–
stick figures), which was similar to the first one (medication–
stick
figures) in that it also showed horizontally aligned units that
looked increasingly humanlike with increasing iconicity. Impor-
tantly, all graphics were designed to allow the numbers to be
precisely assessed and included small quantities that made this
assessment comparatively easy.
In total, there were 3 (kinds of visualizations) � 5 (levels of
iconicity) between-subjects conditions. The lowest level of
iconic-
ity (numbers) was the same for both visualizations of
medication
and was therefore treated as one condition, resulting in 14
distinct
between-participants conditions. The independent variables
were
the level of iconicity of the representation provided to
participants
and their graph literacy as assessed by the scale developed by
Galesic and Garcia-Retamero (in press). The dependent
12. variables
were gist knowledge, verbatim knowledge, accessibility of the
information, and attractiveness of the representation (see
Measures
section).
Procedure
The study was approved by the ethics committee of the Max
Planck Institute for Human Development, and each participant
provided informed consent. After assessing demographic
charac-
teristics, participants were randomly assigned to one of the 14
conditions. Participants were asked a series of questions
concern-
ing one of the two health-related topics on a computerized ques-
tionnaire. They were provided with an actual printout of one of
the
14 different representations, and they had to answer various
ques-
tions with the materials directly in front of them (Time 1
�T1�).
These questions concerned objective dimensions (gist
knowledge
and verbatim knowledge) and subjective dimensions
(accessibility
of the information and attractiveness of the representation). Ex-
ample items for each dimension are listed in Table S2 in the
supplemental online materials. Next, participants returned the
printout with the representation to the experimenter, filled out
the graph literacy scale, and worked on another, unrelated
exper-
iment,2 which took on average 34 min (SD � 12 min). Then,
participants received a task in which they had to recall both gist
and verbatim knowledge that they had learned previously (Time
2
13. �T2�). Finally, numeracy was assessed as a possible
confounding
variable. After exactly 2 weeks, participants received a
previously
announced e-mail inviting them to participate in another recall
test
of both gist and verbatim knowledge (Time 3 �T3�).
Measures
In this section, we describe measures in order of assessment.
Demographics. Participants were asked to indicate their sex,
age, and highest level of education (high school or less vs.
college
degree or more).
Gist knowledge. We assessed gist knowledge with five non-
numerical questions asking for ordinal comparisons between
quan-
1 We did not have any specific hypothesis as to how the actual
level of
iconicity— beyond the difference between graphics and
numbers—
interacts with graph literacy, because the graph literacy scale
assesses only
the ability to handle graphical information in general and
because too little
is known as of now about the impact of iconicity.
2 This experiment is part of another, yet unpublished, study in
which
participants were asked to evaluate a range of expert statements
with regard
to their credibility. These statements concerned different topics,
14. including
finance, environmental issues, and health, and the central
manipulation was
the level of uncertainty that the expert revealed. This
manipulation was
done within participants and was independent of the condition
in the
experiment presented in this article, so this other study did not
introduce
systematic bias.
288 GAISSMAIER ET AL.
T
ab
le
1
E
xc
er
p
ts
o
f
th
e
In
fo
30. 289NUMBERS CAN BE WORTH A THOUSAND PICTURES
tities only, which were presented to participants in two
consecutive
blocks that varied in their difficulty. The first block consisted
of
three questions, for which participants needed to consider data
on
one dimension at a time only (e.g., “Which medication has the
fewest side effects?”). In the second block, consisting of two
questions, participants needed to consider the information on
sev-
eral dimensions (e.g., considering benefits and side effects
together
to answer “Which medication is worst overall?”). The gist
knowl-
edge score represents the average proportion of precisely
correct
answers achieved on the two blocks. The questions assessing
gist
knowledge were asked at T1 as well as at T2 and T3 to assess
the
recall thereof.
Verbatim knowledge. We assessed verbatim knowledge
with 12 numerical questions, which were presented to
participants
in three consecutive blocks that varied in their difficulty and
consisted of four questions each. In the first block, participants
needed to read off frequencies from the information chart (e.g.,
“How many patients experience side effects with ibuprofen?”).
In
the second block, participants needed to compute absolute
differ-
31. ences between two frequencies from the information chart (e.g.,
“How many patients experience a benefit of ibuprofen that they
would not have had with a placebo?”). In the third block, partic-
ipants needed to compute relative differences (i.e., percentage
changes) between two frequencies from the information chart
(e.g.,
“People who take ibuprofen have a ?% lower risk of
experiencing
a side effect compared with people who take paracetamol”). The
verbatim knowledge score represents the average proportion of
precisely correct answers achieved on the three blocks. The
ques-
tions to assess verbatim knowledge were asked at T1 as well as
at
T2 and T3 to assess the recall thereof.
Accessibility. Subjective accessibility of the information was
assessed with five questions, each of which was answered on a
5-point scale ranging from 1 (not at all) to 5 (very much). The
five
questions assessed these five aspects of the information:
compre-
hensibility, usefulness, seriousness, intuitive accessibility, and
dif-
ficulty of answering the questions. Answers were averaged to
generate one accessibility score for each participant. The
internal
consistency of this scale was good (Cronbach’s � � .78).
Attractiveness. Subjective attractiveness of the representation
was assessed with eight questions, each of which was answered
on a
5-point scale ranging from 1 (not at all attractive) to 5 (very
attrac-
tive). They assessed these aspects of the representation: overall
im-
32. pression, attractiveness of colors, imagery, technical
implementation,
size, font size, font, and composition. Answers were averaged
so that
each participant had one attractiveness score. The internal
consistency
of this scale was good (Cronbach’s � � .82).
Graph literacy. We assessed graph literacy with a scale
recently developed and validated on nationally representative
sam-
ples in Germany and the United States by Galesic and Garcia-
Retamero (in press). The scale assesses an individual’s compre-
hension of health-related information on the basis of graphical
representations on three levels of difficulty: reading the data,
reading between the data, and reading beyond the data. For
exam-
ples of items measuring each of the three levels, see Figure S1
in
the supplemental online materials. The scale consists of 13
items.
Here, we briefly report its key psychometric properties, based
on
Galesic and Garcia-Retamero’s German sample because our
study
also took place in Germany. It took participants 9.2 min on
average
(SD � 5.7) to complete the scale. On average, German
participants
answered 9.4 (72.31%) of 13 questions correctly (SD � 2.6).
Cronbach’s alpha was .74, and the average item–total
correlation
was .37, indicating a satisfactory level of internal consistency.
The
average correlation between individual items was .19, showing
33. that each item assessed a somewhat different aspect of graph
literacy. To assess the scale’s validity, Galesic and Garcia-
Retamero assessed its correlations with other variables. Graph
literacy correlated with education (.29), numeracy (.47), and
graph
comprehension items from other literacy questionnaires (.32).
Numeracy. We assessed numeracy as a control variable,
because it is correlated with graph literacy (Galesic & Garcia-
Retamero, in press; in our sample, r�273� � .40, p � .001).
This
assessment was done using the 11 items from Lipkus et al.
(2001)
plus one additional item by Schwartz et al. (1997; the item
involv-
ing a coin toss). The same 12 items have previously been used
successfully by other authors (Galesic, Garcia-Retamero, &
Gig-
erenzer, 2009), and more generally, the numeracy scale is a
widely
used and accepted measurement instrument (e.g., Galesic &
Garcia-Retamero, 2010; Peters et al., 2006).
Participants
Two hundred eighty participants (20 in each of the 14
conditions)
were included in the basic experiment that consisted of working
with
the materials (T1) and the first recall test (T2). All individuals
were
invited from the participant pool of the Max Planck Institute for
Human Development. Most participants were Caucasian
(96.8%), and
a few were Asian (2.1%) or Hispanic (1.1%). Each participant
was
34. paid €15 (approximately $18 at that time), which included
payment
for the unrelated study between T1 and T2. Five participants did
not
finish the experiment and were thus excluded from the sample,
so the
final sample consisted of 275 participants. Of these 275
participants,
215 (78.2% follow-up rate) also completed the recall test after 2
weeks (T3). Descriptive statistics for demographics, graph
literacy,
and numeracy for all 275 participants, for the subsample of 215
participants at T3, and for the 60 participants who dropped out
after
T1 and T2 and did not participate at T3, respectively, can be
found in
Table 2. In comparison to participants at T3, those who dropped
out
were older, less graph literate, and less numerate, and fewer of
them
had at least a college degree. Still, the subsample of participants
at T3
was very similar to the overall sample, except that they were
slightly
younger.
We assessed whether there were differences between partici-
pants across the 14 distinct conditions in demographics,
numeracy,
and graph literacy. At T1 and T2, there were differences in
numeracy, and at T3 there were differences in numeracy and
gender.3 Note that including numeracy, gender, or both as
control
variables did not affect the results.
Data Analysis
35. We calculated descriptive statistics for the dependent variables
gist knowledge, verbatim knowledge, accessibility, and
attractive-
ness. There were no missing values because the computerized
3 At T1 and T2, the 14 conditions differed with regard to
numeracy,
F(13, 261) � 1.85, p � .04, �p
2 � .08. At T3, the 14 conditions differed
with regard to gender composition, �2(13, N � 215) � 23.00, p
� .04, and
numeracy, F(13, 201) � 2.24, p � .01, �p
2 � .13.
290 GAISSMAIER ET AL.
questionnaire did not allow for item nonresponse. For the main
analyses, participants’ graph literacy was split at the median to
obtain one group with relatively low graph literacy and one
group
with relatively high graph literacy.4
To analyze gist and verbatim knowledge as a function of ico-
nicity and graph literacy, we ran a repeated-measures ANOVA
with the within-subjects factors time (T1, T2, T3) and type of
knowledge (gist vs. verbatim), as well as the between-subjects
factors graph literacy (high vs. low), iconicity (1–5), and kind
of
visualization (medication–stick figures, medication–pills,
smoking–stick figures). This analysis could only be performed
for
36. the subsample of 215 participants who also participated in the
follow-up because it required data for T1, T2, and T3. To
analyze
accessibility and attractiveness as a function of iconicity and
graph
literacy, we ran a multivariate ANOVA, which again included
the
between-subjects factors graph literacy (high vs. low), iconicity
(1–5), and kind of visualization (medication–stick figures,
medication–pills, smoking–stick figures). We performed this
anal-
ysis on the entire sample of 275 participants. Results remained
identical when only the subsample of 215 participants was in-
cluded. Note that because the condition with the lowest
iconicity
(numbers) was identical in both representations of medication,
half
of these participants were randomly assigned to medication–
stick
figures and the other half were assigned to medication–pills in
both
of the ANOVAs.
Results
Descriptive Statistics
The mean accuracy scores on gist knowledge for T1, T2, and T3
were .83 (SD � .14), .76 (SD � .21), and .70 (SD � .24),
respectively. The mean accuracy scores on verbatim knowledge
for T1, T2, and T3 were .54 (SD � .24), .35 (SD � .20), and .23
(SD � .16), respectively. The mean scores for accessibility and
attractiveness were 3.38 (SD � 0.78) and 3.38 (SD � 0.73),
respectively. The group of participants with low graph literacy,
as
defined by the median split, had a mean accuracy of .75 (SD �
37. .13)
on this scale, whereas participants with high graph literacy had
a
mean accuracy of .94 (SD � .03).
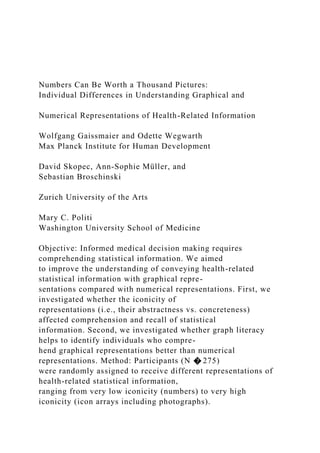
Gist and Verbatim Knowledge
Gist and verbatim knowledge as a function of iconicity and
graph literacy are illustrated in Figure 1 for T1, T2, and T3,
averaged across the three kinds of visualization. We first
checked
whether iconicity had a systematic impact on both gist and
verba-
tim knowledge as hypothesized. This was not the case:
Knowledge
did not generally increase with iconicity, F(4, 185) � 0.94, p �
.44, �p
2 � .02. It was also not the case that higher iconicity
benefitted gist but not verbatim knowledge, Iconicity � Type of
Knowledge F(4, 185) � 0.52, p � .72, �p
2 � .01. Finally, higher
iconicity did not benefit knowledge more strongly in recall than
in
working with the materials, Iconicity � Time F(8, 370) � 0.38,
p � .93, �p
2 � .01.
Next, we looked at graph literacy. Participants with high graph
literacy had higher gist and verbatim knowledge scores in the
graphical conditions compared with the numbers-only condition,
and the reverse was true for participants with low graph
literacy,
38. Iconicity � Graph Literacy F(4, 85) � 2.60, p � .04, �p
2 � .05,
and this interaction did not differ between the different kinds of
visualizations, Iconicity � Graph Literacy � Kind of Visualiza-
tion F(8, 185) � 0.64, p � .75, �p
2 � .03.
The interaction between iconicity and graph literacy stemmed
purely from the difference between graphics and numbers,
whereas
the actual level of iconicity of the graphics had no effect. When
the
numbers-only condition (i.e., Table 1, column 2) was excluded
from the analyses, the Iconicity � Graph Literacy interaction
disappeared, F(3, 161) � 0.41, p � .74, �p
2 � .01. Instead, a main
effect of graph literacy remained, indicating that individuals
with
high graph literacy performed better on all levels of iconicity
beyond numbers, F(1, 161) � 14.67, p � .001, �p
2 � .08. Surpris-
ingly, in the numbers-only conditions, the reverse effect was
true:
People with high graph literacy actually had lower gist and ver-
batim knowledge scores than people with low graph literacy,
F(1,
24) � 3.50, p � .07, �p
2 � .13.
In other words, people with high graph literacy generally
achieved higher gist and verbatim knowledge scores with
39. graphics
4 The continuous graph literacy score was not well suited as a
between-
subjects factor in the subsequent analyses of variance
(ANOVAs) because
the distribution of scores was skewed and there were too few
observations
of each particular level of graph literacy in each of the 14
conditions. The
median split ensured a sufficient number of participants with
either low or
high graph literacy in each of the 14 conditions. Additionally,
this is how
the scale was used by its developers (e.g., Garcia-Retamero &
Galesic,
2010), and median splits are also typically used in research
using the
related construct of numeracy for the same reason as that of a
skewed
distribution of scores (e.g., Peters et al., 2006).
Table 2
Characteristics of Participants at T1–T2 and T3; Characteristics
of Those Who Dropped Out After T1–T2; and a Comparison of
Participants at T3 and Those Who Dropped Out
Characteristic T1–T2 T3 Dropouts T3 vs. Dropouts ( p)
N 275 215 60
Mean age [95% CI] 31 [30, 32] 29 [28, 30] 39 [34, 44] �.001
% Female [95% CI] 53.5 [47.6, 59.4] 55.3 [48.7, 62.0] 46.7
[34.1, 59.3] �.245
% College degree or more [95% CI] 70.2 [64.8, 75.6] 74.9
[69.1, 80.7] 53.3 [40.7, 66.0] �.002
Mean graph literacy [95% CI] .82 [.80, .84] .84 [.82, .86] .77
40. [.72, .82] �.017
Mean numeracy [95% CI] .88 [.86, .90] .89 [.87, .91] .82 [.78,
.86] �.002
Note. T1 � Time 1; T2 � Time 2; T3 � Time 3; CI �
confidence interval.
291NUMBERS CAN BE WORTH A THOUSAND PICTURES
than with numbers, independent of the actual level of iconicity
of
the graphics. For people with low graph literacy, the reverse
was
true. Figure 2 shows the difference between numbers (Table 1,
column 2) and graphics (i.e., pooled across all graphical
conditions
shown in Table 1, columns 3– 6) for all three kinds of visualiza-
tions, separately for people with high and low graph literacy
and
separately for gist versus verbatim knowledge and points of
mea-
surement.
Accessibility and Attractiveness
Figure 3 illustrates that the results for subjective accessibility
were similar to objective gist and verbatim knowledge: Accessi-
bility did not generally increase with iconicity, F(4, 245) �
1.68,
p � .16, �p
2 � .03. For participants with high graph literacy,
however, accessibility did increase with iconicity, whereas it
de-
41. creased with iconicity for participants with low graph literacy,
Iconicity � Graph Literacy F(4, 245) � 2.71, p � .03, �p
2 � .04,
and this interaction did not differ between the different kinds of
visualizations, Iconicity � Graph Literacy � Kind of Visualiza-
tion F(8, 245) � 0.71, p � .68, �p
2 � .02. Similar to the results on
gist and verbatim knowledge, in the numbers-only condition
(Ta-
ble 1, column 2) accessibility was rated higher by participants
with
low graph literacy than by participants with high graph literacy,
F(1, 32) � 4.90, p � .03, �p
2 � .13.
The picture was very different for attractiveness, which was
generally rated higher for graphics than for numbers, reflected
in
a main effect of iconicity, F(4, 245) � 7.61, p � .001, �p
2 � .11
(see Figure 3). This effect did not depend on graph literacy,
Iconicity � Graph Literacy F(4, 245) � 0.06, p � .99, �p
2 � .00,
which held true across the different kinds of visualization,
Iconic-
ity � Graph Literacy � Kind of Visualization F(8, 245) � 0.80,
p � .60, �p
2 � .03.
Discussion
42. We investigated the impact of iconicity of representations and
individuals’ graph literacy on gist and verbatim knowledge and
recall of health information, as well as on preferences for
different
representations. Iconicity ranged from numbers to icon arrays
with
photographs, with less iconic graphics in between. To our
knowl-
edge, this study is the first to systematically explore the concept
of
iconicity of representations in the context of communicating
health-related statistical information. In addition, it adds to the
understanding of the recently developed concept of graph
literacy.
The most important result was that neither graphics nor numbers
were superior for conveying gist or verbatim knowledge per se.
Rather, only participants with high graph literacy achieved
better
gist and verbatim comprehension and recall with graphics than
with numbers, and they also rated graphics as more subjectively
accessible. For participants with low graph literacy, in contrast,
the
opposite held true. This interaction is consistent with our
second
hypothesis, and it was robust in the sense that it did not depend
on
how exactly the graphics were designed, at least with regard to
the
variations in graphics studied here. In line with these results,
Stone, Yates, and Parker (1997) showed differences in risk per-
ception between graphical and numerical formats, but no differ-
ences between different graphical formats.
43. Counter to our first hypothesis, however, higher iconicity did
not result in improved gist knowledge, and less iconic
information
(particularly numbers) did not result in better verbatim
knowledge,
in contrast to Feldman-Stewart et al. (2000) and Hawley et al.
(2008). Our study differed in that numbers represented
relatively
small quantities and could be read off precisely, which was also
true of the graphical representations, which could result in the
loss
of a potential advantage of numbers for verbatim knowledge.
Moreover, higher iconicity did not lead to improved recall, con-
trary to findings in the memory literature that pictures are better
remembered than words (Paivio et al., 1968; Park et al., 1983;
Shepard, 1967). The only main effect of iconicity was that on
attractiveness: Graphical representations were generally judged
to
be more attractive than numbers, regardless of participants’
graph
literacy.
In the numbers-only condition, participants with low graph
literacy actually achieved higher gist and verbatim knowledge
Figure 1. The only difference between representations that
affected comprehension and recall was the
difference between numbers (i.e., iconicity � 1) and graphics
(i.e., iconicity � 2). Individuals with high graph
literacy had better comprehension and recall when presented
with graphics instead of numbers, and the reverse
was true for individuals with low graph literacy. T1 � Time 1;
T2 � Time 2; T3 � Time 3.
292 GAISSMAIER ET AL.
44. scores than participants with high graph literacy. This finding
was
surprising, because graph literacy is correlated with numeracy,
and
thus participants with high graph literacy also had higher nu-
meracy on average (.91 vs. .86). At the same time, our sample
was
relatively highly educated in general, so that the numeracy
scores
of even participants with low graph literacy were high in
compar-
ison to the general population. If numeracy is sufficiently high,
it
could be the case that subjective preferences for different repre-
sentational formats become more important than skill. In line
with
this idea, participants with low graph literacy also subjectively
evaluated numerical information to be more accessible than did
participants with high graph literacy.
Limitations
The high level of education in our sample is one of the limita-
tions of our study. In fact, even those participants who were
classified by the median split as having low graph literacy had
about the same or even slightly higher graph literacy scores
than
the average score found in a nationally representative sample of
people ages 25– 69 in Germany (Galesic & Garcia-Retamero, in
press). Therefore, it is important to be clear that the statements
we
make about differences between low and high graph literacy are
interpreted not in an absolute manner but relative to this
sample.
45. Note that research on skills required to understand quantitative
information has commonly defined groups of low versus high
skill
relative to the sample and not by comparison to absolute
standards
(e.g., Peters et al., 2006), or even relative to subsamples such as
younger and older adults (e.g., Galesic et al., 2009). Still, future
research needs to investigate whether the results reported here
also
hold true for more representative samples. It is encouraging that
our results are consistent with the results of a similar study that
tested representative samples (Garcia-Retamero & Galesic,
2010).
Additionally, one could argue that it is particularly surprising
that
we found substantial differences between participants with rela-
tively low and relatively high graph literacy, given that the
general
level of graph literacy in our sample was high.
A second limitation is that we do not know whether our manip-
ulation of iconicity was perceived by our participants in the way
we intended, because we did not include a manipulation check.
That is, we cannot know for sure that participants would agree
with
us as to which graphical representation was of higher or lower
iconicity in comparison to the other representations. Because
the
graphical representations were developed by designers who are
experts on the concept of iconicity, we believe that participants
would agree with us on the order of iconicity of the graphical
representations within each of the topics. However, it is less
clear
Numbers Graphics
52. Figure 2. For all three kinds of visualizations (see Table 1),
individuals with high graph literacy had better
comprehension and recall with graphics than with numbers.
Individuals with low graph literacy, in contrast, had
better comprehension and recall with numbers than with
graphics. T1� Time 1; T2 � Time 2; T3 � Time 3.
293NUMBERS CAN BE WORTH A THOUSAND PICTURES
whether they would perceive the distance between two levels of
iconicity similarly for different topics, for instance whether the
difference between iconicities of 4 and 5 (Table 1, columns 5
and
6) would be perceived similarly for the topics smoking-stick
figures and medication–stick figures. In this regard, however, it
is
comforting that for the subjective evaluations of
attractiveness—
which is probably the measure that comes closest to a manipula-
tion check of the perception of iconicity—the level of iconicity
had
a comparable effect across all three different topics.
Implications
The findings of this study have important practical implications,
because they clearly demonstrate that not everyone can be suc-
cessfully informed using the same mode of representation. Past
research has identified and developed important tools for
inform-
ing people about risk and uncertainty (e.g., Fagerlin, Ubel et al.,
2007; Gigerenzer et al., 2007). To date, when informing patients
with patient decision aids, decision aid developers typically in-
53. clude a wide range of representations all at once to account for
individual differences in preference for and understanding of
risk
representations. For instance, one decision aid quality criterion
listed by the International Patient Decision Aids Standards Col-
laboration stated, “The patient decision aid provides more than
one
way of explaining the probabilities (e.g., words, numbers, dia-
grams)” (Elwyn et al., 2006, Table 2, p. 2, in Additional Details
section). Given an ever-increasing range of methods for commu-
nicating probabilities (see Bunge, Mühlhauser, & Steckelberg,
2010, for an overview), including multiple formats could result
in
an information overload for patients. In fact, evidence already
exists that people sometimes prefer simplified and reduced
infor-
mation (e.g., Peters et al., 2007; Zikmund-Fisher, Fagerlin, &
Ubel, 2008). It is possible that assessing an individual’s level of
graph literacy could help determine which risk representation
format to include during decision communication.
However, assessing patients’ skills regarding graph literacy or
numeracy before providing information to them in clinical
practice
might be too time consuming. With regard to numeracy, some
have recommended assessing subjective (i.e., self-assessed)
rather
than objective numeracy (e.g., Fagerlin, Zikmund-Fisher et al.,
2007; Zikmund-Fisher, Smith, Ubel, & Fagerlin, 2007). The ad-
vantages of subjective numeracy are that it can be assessed
more
quickly and that it is less aversive for patients in clinical
settings.
Future research should carefully develop subjective or shorter
measures of graph literacy to explore whether they could be
54. reliably used in practice.
One way to minimize information overload and circumvent the
problem of assessing graph literacy in clinical settings at the
same
time could be to allow patients to choose how they prefer to
receive risk information. This could best be achieved with com-
puter kiosks. However, because kiosks will not often be
available
in a busy doctor’s office, one could alternatively provide
patients
with drug facts boxes, simple tabular presentations of clinical
data
that were developed and tested by Schwartz, Woloshin, and
Welch
(2007). These drug facts boxes could be accompanied by
graphics
on the back side, allowing patients to choose which kind of
representation to focus on.
Our findings suggest that in principle, patients could choose the
representation that allows them to comprehend the information
best: Participants with high graph literacy evaluated graphics as
more accessible than numbers and achieved higher gist and ver-
batim knowledge and recall with graphics than with numbers,
and
the reverse was true for participants with low graph literacy.
However, even those participants with low graph literacy
thought
that graphical information was more attractive, which suggests
that
they might choose graphical representations although their gist
and
verbatim knowledge was lower with graphics than with
numbers.
Future research could examine experimentally the impact of al-
55. lowing individuals to choose their preferred risk representations
on
understanding, compared with a situation in which they are ran-
domly assigned to different risk representations.
Conclusion
In conclusion, these findings suggest that health-related infor-
mation should be conveyed differently to different individuals.
An
assessment of graph literacy distinguished individuals who are
best
informed with graphical representations of statistical
information
Figure 3. Individuals with high graph literacy evaluated
graphics (i.e., iconicity � 2) to be more accessible
than numbers (i.e., iconicity � 1), whereas the reverse was true
for individuals with low graph literacy (left
panel). Graphics were generally rated as more attractive than
numbers, even by individuals with low graph
literacy (right panel).
294 GAISSMAIER ET AL.
from those who are better informed with numerical representa-
tions. However, to successfully articulate strategies of
presentation
in clinical settings, more research is needed on the role of graph
literacy in risk communication and how best to tailor
information
to individual characteristics to improve understanding of health
statistics.
56. References
Ancker, J. S., Senathirajah, Y., Kukafka, R., & Starren, J. B.
(2006).
Design features of graphs in health risk communication: A
systematic
review. Journal of the American Medical Informatics
Association, 13,
608 – 618.
Baker, D. W. (2006). The meaning and the measure of health
literacy.
Journal of General Internal Medicine, 21, 878 – 883.
Barry, M. D. (1999). Involving patients in medical decisions.
JAMA, 282,
2356 –2357.
Bunge, M., Mühlhauser, I., & Steckelberg, A. (2010). What
constitutes
evidence-based patient information? Overview of discussed
criteria.
Patient Education and Counseling, 78, 316 –328.
Derry, C., Derry, S., Moore, R. A., & McQuay, H. J. (2009).
Single dose
oral ibuprofen for acute postoperative pain in adults. Cochrane
Database
of Systematic Reviews, 3, Art. No. CD001548. doi:10.1002/
14651858.CD001548.pub2
Edwards, A., & Elwyn, G. (1999). How should effectiveness of
risk
communication to aid patients’ decision be judged? A review of
the
literature. Medical Decision Making, 19, 428 – 434.
57. Edwards, J., Oldman, A., Smith, L. A., Collins, S., Carroll, D.,
Wiffen,
P. J., . . . Moore, R. A. (1999). Single dose oral aspirin for
acute pain.
Cochrane Database of Systematic Reviews, 4, Art. No.
CD002067.
doi:10.1002/14651858.CD002067
Elwyn, G., O’Conner, A., Stacey, D., Volk, R., Edwards, A.,
Coulter, A.,
. . . Whelan, T. (2006). Developing a quality criteria framework
for
patient decision aids: Online international Delphi consensus
process.
British Medical Journal, 333, 417– 419.
Fagerlin, A., Ubel, P. A., Smith, D. M., & Zikmund-Fisher, B.
J. (2007).
Making numbers matter: Present and future research in risk
communi-
cation. American Journal of Health Behavior, 31(Suppl. 1),
S47–S56.
Fagerlin, A., Zikmund-Fisher, B. J., Ubel, P. A., Jankovic, A.,
Derry,
H. A., & Smith, D. M. (2007). Measuring numeracy without a
math test:
Development of the Subjective Numeracy Scale. Medical
Decision
Making, 27, 672– 680.
Feldman-Stewart, D., Kocovski, N., McConnell, B. A.,
Brundage, M. D.,
& Mackillop, W. J. (2000). Perception of quantitative
information for
58. treatment decisions. Medical Decision Making, 20, 228 –238.
Galesic, M., & Garcia-Retamero, R. (2010). Statistical
numeracy for
health. A cross-cultural comparison with probabilistic national
samples.
Archives of Internal Medicine, 170, 462– 468.
Galesic, M., & Garcia-Retamero, R. (in press). Graph literacy:
A cross-
cultural comparison. Medical Decision Making. doi:10.1177/
0272989X10373805
Galesic, M., Garcia-Retamero, R., & Gigerenzer, G. (2009).
Using icon
arrays to communicate medical risks: Overcoming low
numeracy.
Health Psychology, 28, 210 –216.
Garcia-Retamero, R., & Galesic, M. (2010). Who profits from
visual aids:
Overcoming challenges in people’s understanding of risks.
Social Sci-
ence and Medicine, 70, 1019 –1025.
Gigerenzer, G., Gaissmaier, W., Kurz-Milcke, E., Schwartz, L.
M., &
Woloshin, S. (2007). Helping doctors and patients to make
sense of
health statistics. Psychological Science in the Public Interest, 8,
53–96.
Gigerenzer, G., & Gray, J. A. M. (Eds.). (2011). Better doctors,
better
patients, better decisions: Envisioning health care 2020.
Cambridge,
59. MA: MIT Press.
Hawley, S. T., Zikmund-Fisher, B. J., Ubel, P. A., Jankovic, A.,
Lucas, T.,
& Fagerlin, A. (2008). The impact of the format of graphical
presenta-
tion on health-related knowledge and treatment choices. Patient
Educa-
tion and Counseling, 73, 448 – 455.
Hoffrage, U., Lindsey, S., Hertwig, R., & Gigerenzer, G.
(2000). Commu-
nicating statistical information. Science, 290, 2261–2262.
Kurz-Milcke, E., Gigerenzer, G., & Martignon, L. (2008).
Transparency in
risk communication: Graphical and analog tools. In W. T.
Tucker et al.
(Eds.), Annals of the New York Academy of Sciences: Vol.
1128. Strat-
egies for risk communication: Evolution, evidence, experience
(pp. 18 –
28). New York, NY: Blackwell.
Lipkus, I. M. (2007). Numeric, verbal, and visual formats of
conveying
health risks: Suggested best practices and future
recommendations.
Medical Decision Making, 27, 696 –713.
Lipkus, I. M., Samsa, G., & Rimer, B. K. (2001). General
performance on
a numeracy scale among highly educated samples. Medical
Decision
Making, 21, 37– 44.
60. Mirenda, P. (2003). Toward functional augmentative and
alternative com-
munication for students with autism: Manual signs, graphic
symbols,
and voice output communication aids. Language, Speech, and
Hearing
Services in Schools, 34, 203–216.
Moles, A. (1968). Information theory and esthetic perception.
Urbana, IL:
University of Illinois Press. (Original work published 1958)
Morris, C. (1955). Signs, language, and behavior. New York:
Braziller.
(Original work published 1946
O’Connor, A. M., Wennberg, J. E., Legare, F., Llewellyn-
Thomas, H. A.,
Moulton, B. W., Sepucha, K. R., . . . King, J. S. (2007).
Towards the
“tipping point”: Decision aids and informed patient choice.
Health
Affairs, 26, 716 –725.
Paivio, A., Rogers, T. B., & Smythe, P. C. (1968). Why are
pictures easier
to recall than words? Psychonomic Science, 11, 137–138.
Paling, J. (2003). Strategies to help patients understand risks.
British
Medical Journal, 327, 745–748.
Park, D. C., Puglisi, J. T., & Sovacool, M. (1983). Memory for
pictures,
words, and spatial location in older adults: Evidence for
61. pictorial supe-
riority. Journal of Gerontology, 38, 582–588.
Parker, R. M., Baker, D. W., Williams, M. V., & Nurss, J. R.
(1995). The
Test of Functional Health Literacy in Adults: A new instrument
for
measuring patients’ literacy skills. Journal of General Internal
Medi-
cine,10, 537–541.
Peters, E., Dieckmann, N. F., Dixon, A., Hibbard, J. H., Mertz,
C. K., &
Slovic, P. (2007). Less is more in presenting quality
information to
consumers. Medical Care Research and Review, 64, 169 –190.
Peters, E., Västfjäll, D., Slovic, P., Mertz, C., Mazzocco, K., &
Dickert, S.
(2006). Numeracy and decision making. Psychological Science,
17,
407– 413.
Reyna, V. F. (2008). A theory of medical decision making and
health:
Fuzzy-trace theory. Medical Decision Making, 28, 829 – 833.
Reyna, V. F., & Brainerd, C. J. (2007). The importance of
mathematics
in health and human judgment: Numeracy, risk communication,
and
medical decision making. Learning and Individual Differences,
17,
147–159.
Reyna, V. F., Nelson, W. L., Han, P. K., & Dieckmann, N. F.
62. (2009). How
numeracy influences risk comprehension and medical decision
making.
Psychological Bulletin, 135, 943–973.
Schwartz, L. M., Woloshin, S., Black, W. C., & Welch, H. G.
(1997). The
role of numeracy in understanding the benefit of screening
mammogra-
phy. Annals of Internal Medicine, 127, 966 –972.
Schwartz, L. M., Woloshin, S., & Welch, H. G. (2007). The
drug facts box:
Providing consumers with simple tabular data on drug benefit
and harm.
Medical Decision Making, 27, 655– 662.
Shepard, R. N. (1967). Recognition memory for words,
sentences, and
pictures. Journal of Verbal Learning and Verbal Behavior, 6,
156 –
163.
295NUMBERS CAN BE WORTH A THOUSAND PICTURES
Stone, E. R., Yates, J. F., & Parker, A. M. (1997). Effects of
numerical and
graphical displays on professed risk-taking behavior. Journal of
Exper-
imental Psychology: Applied, 3, 243–256.
Toms, L., Derry, S., Moore, R. A., & McQuay, H. J. (2009).
Single dose
oral paracetamol (acetaminophen) with codeine for
63. postoperative pain in
adults. Cochrane Database of Systematic Reviews, 1, Art. No.
CD001547. doi:10.1002/14651858.CD001547.pub2
Woloshin, S., Schwartz, L. M., & Welch, H. G. (2008). The risk
of death
by age, sex, and smoking status in the United States: Putting
health risks
in context. Journal of the National Cancer Institute, 100, 845–
853.
Zikmund-Fisher, B. J., Fagerlin, A., & Ubel, P. A. (2008).
Improving
understanding of adjuvant therapy options by using simpler risk
graph-
ics. Cancer, 113, 3382–3390.
Zikmund-Fisher, B. J., Smith, D. M., Ubel, P. A., & Fagerlin,
A. (2007).
Validation of the Subjective Numeracy Scale (SNS): Effects of
low
numeracy on comprehension of risk communications and utility
elicita-
tions. Medical Decision Making, 27, 663– 671.
Zikmund-Fisher, B. J., Ubel, P. A., Smith, D. M., Derry, H. A.,
McClure, J. B., . . . Fagerlin, A. (2008). Communicating side
effect
risks in a tamoxifen prophylaxis decision aid: The debiasing
influ-
ence of pictographs. Patient Education and Counseling, 73, 209
–
214.
Received August 17, 2010
Revision received June 15, 2011
64. Accepted June 17, 2011 �
Members of Underrepresented Groups:
Reviewers for Journal Manuscripts Wanted
If you are interested in reviewing manuscripts for APA journals,
the APA Publications and
Communications Board would like to invite your participation.
Manuscript reviewers are vital to the
publications process. As a reviewer, you would gain valuable
experience in publishing. The P&C
Board is particularly interested in encouraging members of
underrepresented groups to participate
more in this process.
If you are interested in reviewing manuscripts, please write
APA Journals at [email protected]
Please note the following important points:
• To be selected as a reviewer, you must have published articles
in peer-reviewed journals. The
experience of publishing provides a reviewer with the basis for
preparing a thorough, objective
review.
• To be selected, it is critical to be a regular reader of the five
to six empirical journals that are most
central to the area or journal for which you would like to
review. Current knowledge of recently
published research provides a reviewer with the knowledge base
to evaluate a new submission
within the context of existing research.
• To select the appropriate reviewers for each manuscript, the
editor needs detailed information.
65. Please include with your letter your vita. In the letter, please
identify which APA journal(s) you
are interested in, and describe your area of expertise. Be as
specific as possible. For example,
“social psychology” is not sufficient—you would need to
specify “social cognition” or “attitude
change” as well.
• Reviewing a manuscript takes time (1– 4 hours per manuscript
reviewed). If you are selected to
review a manuscript, be prepared to invest the necessary time to
evaluate the manuscript
thoroughly.
296 GAISSMAIER ET AL.
The multicultural workplace:
interactive acculturation and
intergroup relations
Wido G.M. Oerlemans and Maria C.W. Peeters
Erasmus University Rotterdam, Rotterdam, The Netherlands
Abstract
Purpose – The paper’s aim is to introduce the interactive
acculturation model (IAM) of Bourhis et al.
to predict how disconcordance in acculturation orientations
between host community and immigrant
workers relates to the quality of intergroup work-relations.
Design/methodology/approach – The sample consisted of 141
66. host community (Dutch) and
41 non-western immigrant workers of a postal service company
who filled out a questionnaire.
Methods of analyses include analysis of variance and multiple
regression.
Findings – In line with the IAM, results showed that a higher
disconcordance in preferred
acculturation orientations between host community and
immigrant workers related to a poorer quality
of intergroup work-relations. However, intergroup contact
moderated this relationship differently for
host community and immigrant workers.
Research limitations/implications – Data are cross-sectional and
collected in one organization.
Future studies should replicate the findings to other
organizational contexts, cultural groups, and
collect longitudinal data to determine causal effects.
Practical implications – Organizations should monitor
disconcordance in acculturation
orientations amongst host community and immigrant workers. A
multicultural culture in
organizations may reduce disconcordance in acculturation
orientations between host community
and immigrant workers.
Originality/value – The paper helps to explain the mixed
findings in cultural diversity research so
far, by demonstrating that disconcordance in acculturation
orientations relates negatively to
intergroup work-relations in a multicultural workplace.
Keywords Acculturation, Intergroup relations, Migrant workers,
National cultures, The Netherlands
67. Paper type Research paper
1. Introduction
Nowadays, many workplaces are transformed into domains
where culturally diverse
groups of employees interact on a daily basis. It therefore
becomes more and more
important to understand how cultural diversity in organizations
relates to important
work-outcomes. Literature reviews on cultural diversity showed
mixed results (Oerlemans
et al., 2008). For example, some studies indicated that cultural
diversity in work-groups
leads to benefits (e.g. enhanced creativity, innovation, and
decision making; McLeod and
Lobel, 1992; Watson et al., 2002), whereas other studies showed
that cultural diversity
leads to negative work-outcomes (e.g. increased relational
conflicts, a poorer quality of
work-relations; Ely and Thomas, 2001; Williams and O’Reilly,
1998).
One way to get more insight in the mixed effects of cultural
diversity on work-outcomes
is to study “deep-level” forms of cultural diversity in addition
to examining “surface-level”
forms of cultural diversity (Harrison et al., 1998; Wheeler,
2002). Surface level forms of
The current issue and full text archive of this journal is
available at
www.emeraldinsight.com/0268-3946.htm
JMP
68. 25,5
460
Received June 2008
Revised December 2008,
July 2009
Accepted September 2009
Journal of Managerial Psychology
Vol. 25 No. 5, 2010
pp. 460-478
q Emerald Group Publishing Limited
0268-3946
DOI 10.1108/02683941011048373
cultural diversity encompass variations in ethnicity or
nationality ( Jackson et al., 1995,
2003; Williams and O’Reilly, 1998), whereas deep-level forms
of cultural diversity
encompass (differences in) cultural attitudes, norms, and values
( Jackson etal., 2003). Most
research so far focused on examining surface-level forms of
cultural diversity (Oerlemans,
2009). The main aim of this study is therefore to examine
whether one aspect of deep-level
cultural diversity, acculturation orientations, can explain why
cultural diversity
sometimes relates positively, and sometimes negatively to
intergroup work-relations in
multicultural workplaces.
1.1. Theoretical background
Acculturation. When people from different cultures come into
69. first-hand contact with
one another, this will trigger a process called acculturation. The
first definition of
acculturation was offered by Redfield et al. (1936, p. 149):
Acculturation comprehends those phenomena, which result
when groups of individuals
having different cultures come into continuous first-hand
contact, with subsequent changes
in the original cultural patterns of either or both groups.
Nowadays, the most popular theoretical model to study
acculturation has been
introduced by Berry (1997). Here, acculturation is based on two
dimensions. The first
dimension refers to culture adaptation; the degree to which
immigrants are willing to
adapt to the dominant culture of the “new” society. The second
dimension refers to
culture maintenance; the degree to which immigrants want to
maintain their own ethnic
culture in the new society. Based on these two dimensions,
Berry distinguishes between
four possible acculturation orientations. Integration is defined
by a positive orientation
towards culture adaptation and culture maintenance, whereas
marginalization is
defined by negative orientation towards the two domains. A
positive orientation
towards culture adaptation and a negative orientation towards
culture maintenance is
referred to as assimilation, whereas the reverse defines
separation.
Interactive acculturation and intergroup-relations. Much historic
work on
70. acculturation focused solely on immigrant groups and their
orientation towards the
dominant culture of a host society (Berry et al., 1987; Berry,
2006). However, Bourhis
et al. (1997, 2009) argued that acculturation is more likely an
interactive process
between immigrant groups and the host community group in a
society. For instance,
people from the host community group are also likely to hold
acculturation orientations
towards immigrant groups in their society. Such orientations
concern the degree to
which immigrant groups should be allowed to maintain aspects
of their heritage
culture, and/or adapt to the dominant culture of the host society.
Based on this premise,
Bourhis et al. proposed a more dynamic interactive
acculturation model (IAM) where
they sought to integrate the following components:
. acculturation orientations adopted by immigrant groups in the
host community;
. acculturation orientations adopted by the host community
group towards
specific groups of immigrants; and
. interpersonal and intergroup relational outcomes that are the
product of
combinations of immigrant and host community acculturation
orientations.
According to the IAM, consensual relational outcomes are
predicted when
acculturation orientations between the host community group
and the immigrant
71. The
multicultural
workplace
461
group are “concordant.” This is the case when both groups
prefer assimilation, or when
both groups prefer integration. Next, problematic relational
outcomes emerge when
acculturation orientations of the two groups are partially in
conflict (i.e. Bourhis et al.
refer to this as partial disconcordance). For example, this would
be the case when one
group prefers integration, whereas the other group prefers
assimilation. As such, the two
groups would share similar acculturation orientations on one
dimension (e.g. culture
adaptation) but not on the other dimension (e.g. culture
maintenance). Finally, conflictual
relational outcomes are predicted when the host community
group and the immigrant
group are in full disagreement as regards to their acculturation
orientations (Bourhis
et al. refer to this as full disconcordance). For example, one
group prefers assimilation,
whereas the other group prefers marginalization. As such, the
two groups would share
disagreement on both dimensions of culture adaptation and
culture maintenance.
Bourhis et al. (1997) proposed that the quality of intergroup
72. relations on a
social-psychological level includes verbal and non-verbal cross-
cultural communications;
interethnic attitudes and stereotypes, intergroup tension,
acculturative stress, and
discrimination. Furthermore, consensual, problematic, and
conflictual relations should
not be interpreted as three distinct clusters of relational
outcomes, but rather as a
single continuum ranging from consensual to conflictual
relations.
In line with the IAM, a study of Jasinskaja-Lahti et al. (2003)
demonstrated that
immigrants who differed in their acculturation orientations from
the host population
experienced either more discrimination or more stress than
immigrants with more
concordant acculturation orientations. Similarly, Zagefka and
Brown (2002) showed in
their study that a mismatch in preferred acculturation
orientations between hosts and
immigrants increased the perception of in-group bias and
discrimination while
decreasing the quality of intergroup relations for both groups.
The role of intergroup contact and group vitality. The definition
of acculturation
states that sustained first hand contact is required for
consequences of acculturation to
occur (Redfield et al., 1936). An extensive review of Pettigrew
and Tropp (2006)
demonstrated that intergroup contact reduced feelings of
prejudice and led to more
consensual intergroup relations. Hence, intergroup contact is
likely to positively
73. moderate the negative relationship between disconcordance in
acculturation
orientations and intergroup work-relations.
In addition, the host community group usually enjoys what
Bourhis et al. (1997, 2009)
referred to as a “strong vitality position,” whereas immigrant
groups often have a “weak
vitality position.” Group vitality is defined as that what makes
the group likely to act as a
collective entity within a particular context (Giles et al., 1977).
Several factors such as
demographics (i.e. the number of people belonging to the same
ethnic group),
institutional control (i.e. whether groups gain representation in
decision making levels)
and status (i.e. sociohistorical status and prestige) contribute to
the relative strength and
vitality of ethnic groups. As a consequence, immigrant groups
often experience pressure
to adapt to the cultural values of the host community group. As
a result, immigrant
groups may be more prone to experiencing poorer intergroup
relations as a consequence
of disconcordance in acculturation orientations compared to the
host community group.
1.2. The present study
Interactive acculturation in the workplace. In this study, we
applied the IAM of Bourhis
et al. (1997) to the workplace to examine if disconcordance in
acculturation orientations
JMP
25,5
74. 462
impact the quality of intergroup work-relations. We specifically
focussed on
acculturation orientations of host community (Dutch) workers
versus immigrant
workers from “non-western cultures.” Cultural values between
Dutch workers and
non-western immigrant workers are likely to be higher
compared to immigrants who
originated from western cultures (Hofstede, 1984).
Furthermore, we examined “blue collar workers” for two
reasons. Non-western
immigrant groups are overrepresented in blue-collar jobs in The
Netherlands (CBS,
2007), but at the same time this group is underrepresented in
organizational research
(Peeters and Oerlemans, 2009). Second, selection procedures at
higher levels in
organizations often suffer from “cultural bias” (van de Vijver
and Tanzer, 2003). Cultural
bias stimulates the recruitment of personnel that is culturally
similar to the dominant
(host community) group. As such, this would reduce the
probability of finding
differences in acculturation orientations between the two
cultural groups.
Hypotheses. Non-western immigrant groups in The Netherlands
usually prefer
integration above assimilation, whereas segregation and
marginalization are the least
preferred acculturation orientations. The Dutch usually prefer
75. immigrants to assimilate
towards the Dutch culture, followed by integration, while
segregation and
marginalization are least preferred (Arends-Tóth and van de
Vijver, 2003, 2004;
Ouarasse and van de Vijver, 2005). Therefore, we first
hypothesized that:
H1. Assimilation is the preferred acculturation orientation of
Dutch workers,
followed by integration, while separation and marginalization
are the least
preferred acculturation orientations.
H2. Integration is the preferred acculturation orientation of non-
western immigrant
workers, followed by assimilation, while separation and
marginalization are
the least preferred acculturation orientations.
In this study, we conceptualized disconcordance in
acculturation orientations in two
ways. First, we examined disconcordance on a location level by
examining variations in
acculturation orientations between the group of non-western
immigrant workers and
the group of Dutch workers across four locations of one
organization. Second, we
examined disconcordance on a relational level by comparing
acculturation orientations
of individual workers to their out-group (i.e. host community or
immigrant group) at the
same locations. Based on the IAM model of Bourhis et al.
(1997), we hypothesized that:
H3. Disconcordance in preferred acculturation orientations
76. between the host
community group and the non-western immigrant group results
in a poorer
quality of intergroup work-relations on a location level.
H4. The higher the degree of disconcordance in preferred
acculturation
orientations between individual workers compared to their out-
group
(i.e. host community or immigrant group) at the same location,
the poorer
the intergroup work-relations as perceived by individual
workers.
Furthermore, we examined whether intergroup contact would
moderate the
relationship between disconcordance in preferred acculturation
orientations and
intergroup work-relations. The organizational context usually
provides important
conditions, e.g. striving towards common goals, intergroup
cooperation – for optimal
outcomes of intergroup contact to occur (Allport, 1954;
Pettigrew and Tropp, 2006).
The
multicultural
workplace
463
As a consequence, disconcordance in acculturation orientations
may relate less strongly
77. to poorer intergroup work-relations under conditions of high
intergroup contact
between host community and immigrant workers. Therefore, we
hypothesized that:
H5. The negative relationship between disconcordance in
acculturation
orientations and intergroup work-relations is positively
moderated by the
frequency of intergroup contact.
Finally, host-community workers in this sample had a stronger
vitality position
compared to immigrant workers. For instance, host community
workers had a higher
organizational tenure, were in the numerical majority, and were
overrepresented in
higher functional levels compared to immigrant workers. Based
on this discrepancy
in vitality positions, we expected that immigrant workers would
be more prone to
experiencing poorer intergroup work-relations as a consequence
of disconcordance in
acculturation orientations compared to host community workers.
To our knowledge,
there are no studies that tested such a hypothesis before.
Therefore, we formulated the
explorative question that:
Explorative question 1. Do immigrant workers experience
poorer intergroup
work-relations compared to host community workers as
a consequence of disconcordance in acculturation
orientations?
2. Method
78. Sample and procedure
The data were collected in a postal service company in The
Netherlands. The company
had no specific information about the cultural diversity of their
workforce. Based on
information provided by location managers about the degree of
cultural diversity
within their locations, we selected four locations that were to
some degree
multicultural. Participants filled out a paper and pencil
questionnaire during a break
from work. Questionnaires were not translated into other
languages based on the fact
that translation itself can also diffuse interpretations (van
Oudenhoven, 2002).
Research assistants were present at each location, and
emphasized that answers would
be treated confidentially by university researchers. The research
assistants visited the
four locations during multiple days, allowing participants to
take their time and fill out
the questionnaire.
The response rate within each location was 50 percent (n ¼ 25),
58 percent (n ¼ 29),
27 percent (n ¼ 54), and 38 percent (n ¼ 82). The sample
consisted out of 49 non-western
immigrant workers and 141 Dutch workers. The Central Bureau
of Statistics (2007) in
The Netherlands identifies persons as non-western immigrants
when a person
originated from countries in Africa, South America, Asia, or
Turkey. About 43 percent of
the non-western workers had a Surinamese, 23 percent an
Indonesian, 16 percent a
Turkish, and 14 percent a Moroccan background. Furthermore,
79. 78 percent were “first
generation,” and 22 percent were “second generation”
immigrants. First generation
immigrants are born in the respective countries of origin,
whereas second generation
immigrants are born in The Netherlands, but one or both parents
were born
in non-western countries.
The sample mainly consisted out of “blue-collar” workers. Their
jobs encompassed
tasks such as sorting mail, labelling mail, offloading, and
reloading trucks.
JMP
25,5
464
About 72 percent of the workers had a lower secondary or a
lower vocational degree,
and 59 percent of the sample was male. The average age was 45
years, ranging from
18 to 61 years. Participants had a mean organizational tenure of
19 years, ranging
from 1 to 40 years. The immigrant group and the Dutch group of
workers had similar
educational levels and gender distributions. However,
immigrant workers were
significantly older (m ¼ 46.2) compared to Dutch workers (m ¼
40.2; F(189, 1) ¼ 12.658;
p , 0.001). Also, Dutch workers had a significantly higher
organizational tenure
(m ¼ 20.1) compared to immigrant workers (m ¼ 12.2; F(189,
80. 1) ¼ 18.530; p , 0.001).
Measures
Acculturation orientations were measured with the acculturation
scale developed by
Arends-Tóth and van de Vijver (2000). This scale follows a so-
called “two-statement
measurement method,” where two items are formulated per
domain. One refers to
adopting the mainstream culture and the other to maintaining
the heritage culture. One
item example for culture maintenance is: “Immigrants must try
to honour the customs
and traditions of their own culture.” One item-example of
culture adaptation is:
“Immigrants should raise their children according to the Dutch
norms and values.”
In total, ten items referred to five different life-domains:
Contact, upbringing, language,
culture and education. Respondents answered on a five-point
scale (1 ¼ totally
disagree, 5 ¼ totally agree). Cronbach’s alpha for culture
maintenance was 0.78 for
Dutch and immigrant employees. Cronbach’s alpha for culture
adaptation showed
good statistical reliability for Dutch employees (0.81) and a fair
reliability for
immigrant workers (0.63). As proposed by Arends-Tóth and van
de Vijver (2000, 2006),
Euclidean distance scores were used to calculate the four
acculturation orientations:
ffiffiffiffiffiffiffiffiffiffiffiffiffiffiffiffiffiffiffiffiffiffiffiffiffiffi
ffiffiffiffiffiffiffiffiffiffiffiffiffiffiffiffiffiffiffiffiffiffiffiffiffiffi
ffiffiffiffiffiffiffiffiffiffiffiffiffiffiffiffiffiffiffiffiffiffiffiffiffiffi
ffiffiffiffiffiffiffiffiffiffiffiffiffiffiffiffiffiffiffiffiffiffiffiffiffiffi
81. ffiffiffiffiffiffiffiffiffiffiffiffiffiffiffiffiffiffiffiffiffiffiffiffiffiffi
ffiffiffiffiffiffiffiffiffiffiffiffiffiffiffiffiffiffiffiffiffiffiffiffiffi
½ðideal score on adaptation scale 2 real score on adaptation
scaleÞ2 þ ðideal score
on culture maintenance scale 2 real score on culture
maintenance scaleÞ2�
vuut
The ideal score for assimilation is 5 on the culture adaptation
scale and 1 on the culture
maintenance scale. For separation the ideal score is 1 on
adaptation and 5 on
maintenance, for integration it is 5 on both the adaptation and
maintenance scale and
for marginalization the ideal score is 1 on both scales. Scores
were deducted from a
maximum score ð
ffiffiffiffiffi
32
p
¼ 5:66Þ so that a high score indicates a small distance, whereas
a low score refers to a large distance.
Disconcordance in acculturation orientations on a location level
was measured by
comparing means regarding the four acculturation orientations
between the group of
immigrant workers and the group of host community workers at
each of the four
locations.
82. Disconcordance in acculturation orientations on a relational
level was measured by
calculating a standard deviation (SD) for each individual
worker. We hereby compared
acculturation orientations of individual workers (Xi) to their
out-group ( �X) at the same
location:
ffiffiffiffiffiffiffiffiffiffiffiffiffiffiffiffiffiffiffiffiffiffiffi
½ðXi 2 �XÞ
2�
p
.
Intergroup contact. Participants were asked to report the total
number of colleagues
with whom they worked together on a daily basis. Furthermore,
participants were
asked to report how many of these colleagues had a Dutch and a
non-western
immigrant background. A definition of non-western immigrants
was included in the
questionnaire. For Dutch workers, intergroup contact was
calculated by dividing the
The
multicultural
workplace
465
83. number of immigrant colleagues with the total number of
colleagues. For immigrant
workers, intergroup contact was calculated by dividing the
number of Dutch colleagues
with the total number of colleagues.
Intergroup work-relations. We measured intergroup work-
relations by using a
six-item scale of van Veldhoven and Meijman (1994). We
hereby included the two target
groups (i.e. Dutch workers and immigrant workers) in the
questions, resulting in a total of
12 items. Two item examples are: “Do you feel appreciated by
your Dutch colleagues?” and
“do you feel appreciated by your immigrant colleagues?”
Respondents answered on a
five-point scale (1 ¼ not at all, 5 ¼ always). For the target
group of Dutch workers,
Cronbach’s alpha was 0.77 for Dutch and 0.77 for immigrant
workers. For the target group
of immigrant workers, Cronbach’s alpla was 0.75 for Dutch
workers and 0.74 for
immigrant workers. From the above two scales, one overall
measure for intergroup
work-relations was created. For Dutch workers, scores were
included that measured
work-relations with immigrant colleagues. For immigrant
workers, scores were included
that measured work-relations with Dutch colleagues.
Analyses
First, we performed paired t-tests to examine the hierarchy in
acculturation orientations
for the immigrant and Dutch groups (H1 and H2). Next, we
performed analyses of
variance to test whether disconcordance in acculturation
84. orientations between Dutch
and immigrant workers related to intergroup work-relations on a
location level (H3).
Thereafter, we performed multiple regression analyses to test
whether disconcordance
in acculturation orientations was associated with intergroup
work-relations on a
relational level (H4), and whether intergroup contact (H5) and
ethnic group (Dutch
versus non-western immigrant) moderated this relationship
(Explorative question 1).
3. Results
Descriptive statistics and preferred acculturation orientations
Means, SDs, and correlations regarding the study variables are
displayed in Table I.
Results concerning the hierarchy in acculturation orientations of
Dutch and
non-western immigrant workers are presented in Table II.
We first hypothesized that assimilation was the most preferred
acculturation
orientation for Dutch workers, followed by integration, whereas
separation and
marginalization would be the least preferred acculturation
orientations (H1). Confirming
this hypothesis, Table I indeed showed that assimilation was the
preferred acculturation
orientation among Dutch workers (M ¼ 3.71), followed by
integration (M ¼ 3.00),
marginalization (M ¼ 2.04), and separation (M ¼ 1.65). Paired
sample t-tests in Table II
indicated that the means for each of the four acculturation
orientations differed
significantly for the Dutch group of workers.
85. Next, we hypothesized that integration was the preferred
acculturation orientation
for non-western immigrant workers, followed by assimilation,
while separation and
marginalization would be the least preferred acculturation
orientations (H2). Table I
indeed showed that immigrant workers preferred integration (M
¼ 3.68) above
assimilation (M ¼ 2.98), followed by separation (M ¼ 2.08) and
marginalization
(M ¼ 1.73). Paired t-tests in Table II indicated that each of the
acculturation
orientations differed significantly for the immigrant group of
workers.
JMP
25,5
466
D
u
tc
h
(n
¼
1
4
1
)
107. ,
st
a
n
d
a
rd
d
ev
ia
ti
o
n
Table I.
Means, SDs, and
correlations of the study
variables
The
multicultural
workplace
467
Disconcordance in acculturation orientations on a location level
Next, we performed analyses of variance across the four
108. locations to test the
hypothesis that disconcordance in acculturation orientations
would result in poorer
intergroup work-relations on a location level (H3). Results are
displayed in Table III
and indicated that Dutch and immigrant groups of workers
shared concordant
acculturation orientations at the first and the second location.
Conversely, there was
disconcordance in acculturation orientations between the Dutch
and immigrant groups
at the third and the fourth location. At the third location, Dutch
workers preferred
assimilation to a higher degree compared to immigrant workers.
Also, immigrant
workers preferred integration and separation to a higher degree
compared to Dutch
workers. At the fourth location, assimilation was more preferred
by Dutch workers
compared to immigrant workers, whereas immigrant workers
preferred integration to
a higher degree than Dutch workers.
We compared the mean scores for intergroup work-relations at
the first and second
location, characterized by a concordance in acculturation
orientations, with the third
Paired differences DMi t p DMd t p
Assimilation-integration 20.57 22.28 * 0.92 6.80 * *
Assimilation-separation 0.99 4.37 * * 2.40 16.79 * *
Assimilation-marginalization 1.31 8.53 * * 1.92 19.64 * *
109. Integration-separation 1.56 10.10 * * 1.48 21.48 * *
Integration-marginalization 1.88 7.34 * * 1.00 9.04 * *
Segregation-marginalization 0.32 2.14 * 20.47 26.72 * *
Notes: Significance at: *p , 0.05 and * *p , 0.001;
abbreviations: DMi, differences in means for non-
western immigrant workers; DMd, differences in means for
Dutch workers
Table II.
Hierarchy in
acculturation orientations
among Dutch and
non-western immigrant
workers
Location Acculturation orientations Mi
a
Md
a
F-test p
1. Assimilation 3.40 3.70 1.09
Integration 3.17 3.09 0.07
Separation 2.00 1.66 1.38
Marginalization 2.12 2.08 0.02
2. Assimilation 2.96 3.38 1.34
Integration 3.50 3.29 0.39
Separation 2.21 1.85 1.28
Marginalization 1.82 1.88 0.03
110. 3. Assimilation 2.98 4.04 18.42 * *
Integration 3.92 2.97 17.81 * *
Separation 2.11 1.35 14.83 * *
Marginalization 1.57 1.87 3.65
4. Assimilation 3.11 3.98 6.05 *
Integration 3.49 2.86 3.94 *
Separation 1.74 1.43 1.15
Marginalization 1.69 1.99 1.40
Notes: Significance at: *p , 0.05 and * *p , 0.001;
aabbreviations: Mi, means for non-western
immigrant workers; Md, means for Dutch workers
Table III.
Differences in
acculturation orientations
between Dutch and
non-western immigrant
workers across the four
locations
JMP
25,5
468
and fourth location, characterized by disconcordance in
acculturation orientations. As
predicted, analysis of variance indicated that the perceived
111. quality of intergroup
work-relations was higher in the first and second location
compared to the third and
fourth location (F(133, 1) ¼ 5.762; p , 0.018). This confirmed
the third hypothesis.
Disconcordance in acculturation orientations on a relational
level
We performed hierarchical regression analyses to test H4, H5,
and Explorative
question 1. Results are displayed in Table IV. We only included
workers who worked on
a daily basis with one or more colleagues from the opposite
group. Out of 131 Dutch
workers, 77 reported to work with immigrant colleagues, and 36
out of 43 immigrant
workers reported to be working with Dutch colleagues.
Furthermore, all workers
preferred either integration or assimilation. Therefore, we
analyzed the effects of
disconcordance for these two types of acculturation orientations
separately in Table IV.
In the first step, we included a dummy variable for the
immigrant group (versus the Dutch
group) of workers, disconcordance scores, and intergroup
contact. We also controlled for
the main effect acculturation orientations (i.e. assimilation and
integration).
We hypothesized that a higher degree of disconcordance in
preferred acculturation
orientations between individual workers compared to the out-
group at the same location
(i.e. host community or immigrant group) would relate to poorer
intergroup work-relations
(H4). Table IV (Model I) showed that a larger disconcordance
112. in assimilation related
negatively to the perceived quality of intergroup work-relations
(b ¼ 20.22; p , 0.05).
Similarly, a larger disconcordance in integration related
negatively to intergroup
work-relations (b ¼ 20.26; p , 0.05). This confirmed H4.
Furthermore, there were no
significant differences in intergroup work-relations as perceived
by immigrant and Dutch
workers. Likewise, intergroup contact, and
assimilation/integration as preferred
acculturation orientations were not related to intergroup work-
relations.
In Model II, we tested the hypothesis that intergroup contact
would positively
moderate the negative relationship between disconcordance in
acculturation
orientations and intergroup work-relations (H5). In addition, we
explored whether
Intergroup work-relations (n ¼ 113)
Acculturation orientations Assimilation Integration
Model I II III I II III
Immigrant worker (0 ¼ Dutch, 1 ¼
immigrant)
0.04 0.05 0.04 0.07 0.06 20.05
Intergroup contact 20.01 0.00 20.01 0.04 0.07 0.11
Acculturation orientation 0.07 0.24 0.25 0.04 0.15 0.39
Disconcordance 20.22 * 20.27 * 20.08 20.26 * * 20.30 * 0.07
Two-way interactions
Immigrant £ intergroup contact 20.22 20.27 20.15 20.33
Intergroup contact £ disconcordance 20.13 0.36 20.16 0.58 *
113. Immigrant worker £ disconcordance 0.09 0.11 0.07 20.05
Three-way interactions
Immigrant £ intergroup
contact £ disconcordance
20.62 * * 20.80 * * *
Adjusted R
2
(%) 2 1 10 3.9 3.5 12.9
Note: Significance at: *p , 0.05, * *p , 0.01, and * * *p , 0.001
Table IV.
Multiple regression
analyses on
disconcordance and
intergroup work-relations
at a relational level
The
multicultural
workplace
469
immigrant workers would experience poorer intergroup work-
relations as a
consequence of disconcordance compared to host community
114. workers (Explorative
question 1). Results in Model II showed that none of the two-
way interactions were
significant. This rejected H5. Also, based on Model II, the
negative relationship between
disconcordance and intergroup work-relations appeared to be
similar for immigrant and
Dutch workers.
In the third and final model, we explored whether the
moderation effect of intergroup
contact on the relationship between disconcordance and
intergroup work-relations
differed for Dutch workers compared to non-western immigrant
workers. Interestingly,
this appeared to be the case. Results in Model III showed that
intergroup contact
moderated the relationship between disconcordance (in either
assimilation or integration)
and intergroup work-relations differently for the immigrant
workers compared to the
Dutch workers. We plotted the interaction effects for Dutch and
immigrant workers in
Figures 1-4 to examine the nature of this three-way interaction
in more detail.
Figure 1.
Disconcordance
in assimilation and
intergroup contact for
Dutch workers
1
1.5
118. s
Low contact frequency
High contact frequency
JMP
25,5
470
For Dutch workers, Figures 1 and 2 show that more
disconcordance related to a poorer
quality of intergroup work-relations under conditions of low
intergroup contact.
Conversely, under conditions of high intergroup contact,
disconcordance had almost
no effect on the perceived quality of work-relations. For
immigrant workers, Figures 3
and 4 show that disconcordance related to poorer intergroup
work-relations under
conditions of high intergroup contact. In contrast,
disconcordance related to better
intergroup work-relations under conditions of low intergroup
contact.
4. Discussion
The main aim of this study was to examine whether the IAM of
Bourhis et al. (1997) is
useful to predict intergroup work-relations in a multicultural
workplace. This appears
to be the case. In line with the IAM model, this study shows
that disconcordance
(i.e. disagreement) in acculturation orientations between host
119. community and
immigrant workers relates to a poorer quality of intergroup
work-relations. However,
intergroup contact appears to moderate this relationship
differently for Dutch workers
Figure 3.
Disconcordance in
assimilation and
intergroup contact for
immigrant workers
1
1.5
2
2.5
3
3.5
4
4.5
5
Low disconcordance
assimilation
High disconcordance
122. du
tc
h
co
ll
ea
gu
es
Low contact frequency
High contact frequency
The
multicultural
workplace
471
compared to immigrant workers. These findings are discussed in
detail below, together
with limitations of this study and suggestions for further
research.
As hypothesized, host community (Dutch) workers had a
different hierarchy of
acculturation orientations compared to immigrant workers.
Dutch workers appear to
prefer assimilation above integration, while marginalization and
separation are least
123. preferred (confirming H1). Put differently, Dutch workers want
immigrants to completely
adapt to the Dutch culture, without maintaining aspects of their
heritage culture.
Conversely, immigrant workers prefer integration above
assimilation, while separation
and marginalization are least preferred (confirming H2).
Immigrant workers thus prefer a
dual-orientation in which they both adapt to the host culture and
maintain aspects of their
heritage culture at the same time. As such, this study
generalizes findings from previous
studies performed in the society at large (Arends-Tóth and van
de Vijver, 2003, 2004;
Ouarasse and van de Vijver, 2005) to a workplace context.
It is important to note that this study was performed among blue
collar workers.
Peeters and Oerlemans (2009) recently performed another study
on acculturation
orientations and job-related well-being among Dutch and non-
western immigrant
workers with higher occupational levels. Surprisingly,
immigrant workers in this
sample preferred assimilation and integration to the same
degree. Higher educational
and occupational levels might thus coincide with immigrants’
acceptance of the host
culture. Future research is needed to determine the relationship
between educational
and occupational levels on the one hand, and acceptance of the
host culture among
immigrant workers on the other hand.
Furthermore, this study successfully replicated assumptions
based on the IAM
124. (Bourhis et al., 1997, 2009) to the domain of work. We hereby
considered disconcordance
in acculturation orientations on a location level and a relational
level. In both instances,
a higher degree of disconcordance in acculturation orientations
related to poorer
intergroup work-relations (confirming H3 and H4). It is
important to mention that we
controlled for the main effect of acculturation orientations on
intergroup work-relations.
Thus, disconcordance, rather than the degree of preference for
assimilation or
integration, predicts the quality of intergroup work-relations.
Next, this study shows that intergroup contact buffers the
negative relationship
between disconcordance and intergroup work-relations for host
community (Dutch)
workers (confirming H5 for Dutch workers). An explanation for
this buffering effect
among host community workers may be that intergroup contact
reduces feelings of
anxiety, uncertainty and threat on how to approach and
communicate with immigrant
groups (Pettigrew and Tropp, 2006). Feelings of anxiety grow
out of concerns about
how host community members should act, how they might be
perceived, and whether
they will be accepted by the immigrant group (Stephan and
Stephan, 1985). For
instance, recent studies demonstrated that intergroup anxiety
mediated the relation
between intergroup contact and intergroup relations (Paolini et
al., 2004; Stephan et al.,
2002). As intergroup contact is generally low for host
community members, an increase
125. in intergroup contact would reduce feelings of anxiety and
threat towards immigrant
workers, and result in better intergroup work-relations.
In contrast, this study shows that intergroup contact aggravates
the negative
relationship between disconcordance and intergroup work-
relations for immigrant
workers (disconfirming H5 for immigrant workers). One
explanation for this unexpected
finding might be related to the difference in vitality positions
between immigrant and
JMP
25,5
472
host community groups. Immigrant groups usually have a
weaker vitality position
compared to the host community group (Bourhis et al., 1997;
Phinney et al., 2001). It is
therefore more likely that immigrant groups experience pressure
from the host
community group to assimilate to the host culture, and not vice
versa. Especially, under
the condition of high intergroup contact, immigrant workers
may be confronted with
pressures from host community workers to assimilate to the host
culture, leading to
poorer intergroup work-relations.
A second explanation might be that there are variations in
cognitive styles between