QNBFS Weekly Market Report December 30, 2021
•
0 likes•176 views

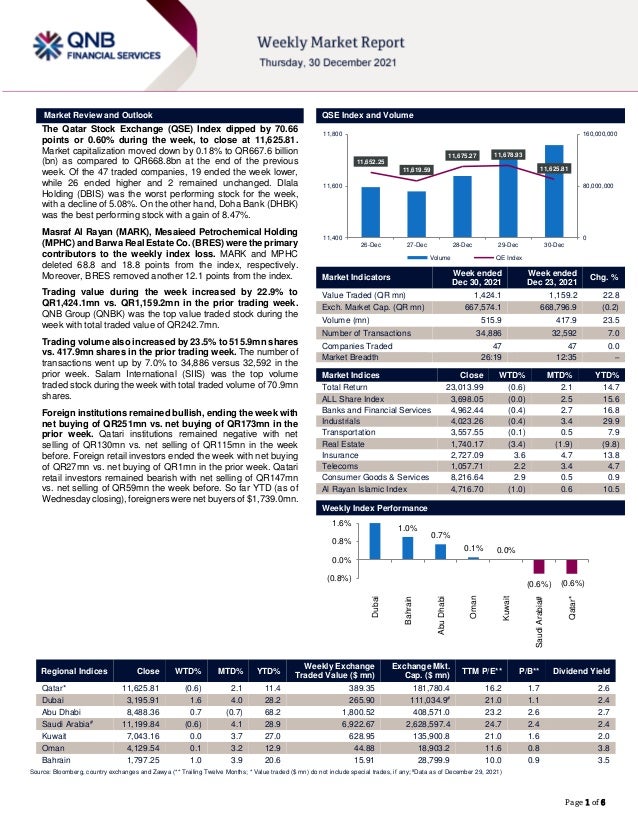
The Qatar Stock Exchange (QSE) Index dipped by 70.66 points or 0.60% during the week, to close at 11,625.81

Recommended
Recommended
More Related Content
Similar to QNBFS Weekly Market Report December 30, 2021
Similar to QNBFS Weekly Market Report December 30, 2021 (20)
More from QNB Group
More from QNB Group (20)
Recently uploaded
Recently uploaded (20)
QNBFS Weekly Market Report December 30, 2021
- 1. ``````` Page 1 of 6 Market Review and Outlook QSE Index and Volume The Qatar Stock Exchange (QSE) Index dipped by 70.66 points or 0.60% during the week, to close at 11,625.81. Market capitalization moved down by 0.18% to QR667.6 billion (bn) as compared to QR668.8bn at the end of the previous week. Of the 47 traded companies, 19 ended the week lower, while 26 ended higher and 2 remained unchanged. Dlala Holding (DBIS) was the worst performing stock for the week, with a decline of 5.08%. On the other hand, Doha Bank (DHBK) was the best performing stock with a gain of 8.47%. Masraf Al Rayan (MARK), Mesaieed Petrochemical Holding (MPHC) and Barwa Real Estate Co. (BRES) were the primary contributors to the weekly index loss. MARK and MPHC deleted 68.8 and 18.8 points from the index, respectively. Moreover, BRES removed another 12.1 points from the index. Trading value during the week increased by 22.9% to QR1,424.1mn vs. QR1,159.2mn in the prior trading week. QNB Group (QNBK) was the top value traded stock during the week with total traded value of QR242.7mn. Trading volume also increased by 23.5% to 515.9mn shares vs. 417.9mn shares in the prior trading week. The number of transactions went up by 7.0% to 34,886 versus 32,592 in the prior week. Salam International (SIIS) was the top volume traded stock during the week with total traded volume of 70.9mn shares. Foreign institutions remained bullish, ending the week with net buying of QR251mn vs. net buying of QR173mn in the prior week. Qatari institutions remained negative with net selling of QR130mn vs. net selling of QR115mn in the week before. Foreign retail investors ended the week with net buying of QR27mn vs. net buying of QR1mn in the prior week. Qatari retail investors remained bearish with net selling of QR147mn vs. net selling of QR59mn the week before. So far YTD (as of Wednesday closing), foreigners were net buyers of $1,739.0mn. Market Indicators Week ended Dec 30, 2021 Week ended Dec 23, 2021 Chg. % Value Traded (QR mn) 1,424.1 1,159.2 22.8 Exch. Market Cap. (QR mn) 667,574.1 668,796.9 (0.2) Volume (mn) 515.9 417.9 23.5 Number of Transactions 34,886 32,592 7.0 Companies Traded 47 47 0.0 Market Breadth 26:19 12:35 – Market Indices Close WTD% MTD% YTD% Total Return 23,013.99 (0.6) 2.1 14.7 ALL Share Index 3,698.05 (0.0) 2.5 15.6 Banks and Financial Services 4,962.44 (0.4) 2.7 16.8 Industrials 4,023.26 (0.4) 3.4 29.9 Transportation 3,557.55 (0.1) 0.5 7.9 Real Estate 1,740.17 (3.4) (1.9) (9.8) Insurance 2,727.09 3.6 4.7 13.8 Telecoms 1,057.71 2.2 3.4 4.7 Consumer Goods & Services 8,216.64 2.9 0.5 0.9 Al Rayan Islamic Index 4,716.70 (1.0) 0.6 10.5 Weekly Index Performance Regional Indices Close WTD% MTD% YTD% Weekly Exchange Traded Value ($ mn) Exchange Mkt. Cap. ($ mn) TTM P/E** P/B** Dividend Yield Qatar* 11,625.81 (0.6) 2.1 11.4 389.35 181,780.4 16.2 1.7 2.6 Dubai 3,195.91 1.6 4.0 28.2 265.90 111,034.9# 21.0 1.1 2.4 Abu Dhabi 8,488.36 0.7 (0.7) 68.2 1,800.52 408,571.0 23.2 2.6 2.7 Saudi Arabia# 11,199.84 (0.6) 4.1 28.9 6,922.67 2,628,597.4 24.7 2.4 2.4 Kuwait 7,043.16 0.0 3.7 27.0 628.95 135,900.8 21.0 1.6 2.0 Oman 4,129.54 0.1 3.2 12.9 44.88 18,903.2 11.6 0.8 3.8 Bahrain 1,797.25 1.0 3.9 20.6 15.91 28,799.9 10.0 0.9 3.5 Source: Bloomberg, country exchanges and Zawya (** Trailing Twelve Months; * Value traded ($ mn) do not include special trades, if any; #Data as of December 29, 2021) 11,652.25 11,619.59 11,675.27 11,678.93 11,625.81 0 80,000,000 160,000,000 11,400 11,600 11,800 26-Dec 27-Dec 28-Dec 29-Dec 30-Dec Volume QE Index 1.0% 0.7% 0.1% 0.0% (0.6%) (0.6%) (0.8%) 0.0% 0.8% 1.6% Dubai Bahrain Abu Dhabi Oman Kuwait Saudi Arabia# Qatar*
- 2. Page 2 of 6 Economic, Market & Company News Fitch Ratings: Qatar’s assets offset government-related entity debt; higher oil prices, pandemic recovery lower GCC's GRE debt/GDP – Qatar’s assets offset government- related entity (GRE) debt, Fitch Ratings said and noted partial recovery from the Covid-19 pandemic and higher oil prices are lowering GRE debt as a share of GDP across the GCC in 2021. But in most countries, Fitch Ratings said GRE debt levels remain higher than before the pandemic. The upward trend in GRE debt/GDP that has been in evidence since 2014 could resume as GREs help to drive national economic agendas, aiming at job creation, diversification and the energy transition, Fitch Ratings said. Increased focus on privatization and asset sales could mitigate this trend over time, it said. Aggregate GCC non-bank GRE debt hit 37% of GDP in 2020 (an increase of 7pp over 2019), driven in part by declines in nominal GDP on lower oil prices and Covid-19-induced recessions. The ratio is 32% in relation to forecast 2021 GDP. Aggregate debt of GCC government-related banks (wholesale or interbank funding, excluding customer deposits) rose to 24% of GDP in 2020. However, potential contingent liabilities from banks are larger, with sector assets reaching above 300% in Qatar, for example. All GCC countries have a record of supporting their GREs, either on an ongoing basis or in periods of distress. The likelihood of future assistance is high given past experience, combined with the continuing importance of GREs to national economic growth strategies and, frequently, their status as national champions. Across much of the GCC, large sovereign net foreign assets and low net debt limit the credit impact of large or growing contingent liabilities, Fitch Ratings said. The high standalone credit quality of some GREs, in particular most of the national oil companies in the region, is also a mitigating factor. Nevertheless, many GCC sovereign ratings rely on exceptional balance-sheet strengths to outweigh structural weaknesses, including undiversified economies and political risk. Fitch said it does not usually include GRE debt in government debt, unless it is guaranteed and likely to materialize onto a government’s balance sheet. Contingent liabilities could crystallize if a government assumes the obligations of a GRE, or if it needs to make transfers that widen its fiscal deficit. Other contingent liabilities not covered in this report include liabilities arising from pension funds or public-private partnerships (e.g. power purchase agreements). (Gulf-Times.com) DHBK closes $762.5mn term loan facility – Doha Bank (DHBK) has successfully completed the signing of a three-year syndicated term loan facility on December 20. The facility includes an option to extend the maturity by one year at the end of the initial three-year term. The facility was drawn in full on December 23. Launched in November, the facility was originally targeting deal size of $350mn. The facility generated strong interest from existing and new relationship banks across EMEA and Asia regions, and the syndication was closed oversubscribed. A total of 16 financial institutions joined the facility, and the facility was subsequently upsized to $762.5mn. The strong response to the deal is a testament to Doha Bank’s good access to the capital markets and deep relationships with a diverse range of lenders. The facility, where the loan proceeds shall be used to fund general corporate and working capital purposes of the bank, pays a margin of 85 basis points per annum over US dollar Libor. Mizuho Bank and Intesa Sanpaolo coordinated the transaction. Mizuho Bank is also the facility agent. (Gulf-Times.com) QNBK to disclose its Annual financial results on January 11 – QNB Group (QNBK) will disclose its financial statement for the period ending December 31, 2021 on January 11, 2022. (QSE) Bloomberg Survey: Qatar’s economy to expand 2.9% in 2021 – Qatar’s economy will expand 2.9% in 2021 according to the latest results of a Bloomberg News survey of 9 economists conducted from December 17 to December 22. GDP for 2022 is expected to grow +4.2% YoY vs prior +4.2%. CPI for 2021 reached +1.8% YoY vs prior +1.5%. CPI for 2022 is expected to rise +2.3% YoY vs prior +1.8%. (Bloomberg) Qatar's banking sector demonstrates resilience, registers 'impressive' growth amid Covid-19 challenges – Qatar's banking sector demonstrated resilience and registered an impressive growth in business during 2021, driven by the need to continue to support the country's future ambitions. The measures taken by Qatar Central Bank (QCB) helped to keep a check on the asset quality of the banking sector this year. Qatari banks’ total assets have increased 0.2% MoM, up 6.7% YTD in November to reach QR1.795tn. Local lenders’ costs continue to remain the lowest in the region, which reflects the relentless focus on efficiencies to help counter the impact of increased provisioning. Despite the financial uncertainty arising from Covid-19, Qatar's listed banks recorded the lowest profit decline amongst its regional peers, KPMG had said in an earlier report. “Increased loan provisioning as a result of liquidity and credit challenges being faced by borrowers reflected the more cautious approach taken by banks. This impact was partially offset by higher interest spreads and lower costs,” KPMG said. Amid the challenges posed by the pandemic, the local economy and the banking system could maintain stability thanks to proactive steps taken by the Government of Qatar and the QCB. One area of particular focus was the support mechanism for small and medium enterprises (SMEs). A distinct part of these measures included injecting capital into systemically important sectors, thereby to an extent, neutralizing the short-term impact on the financial market. The overall loan book (of Qatar’s banks) went up by 0.5% MoM last month to reach QR1,213.8bn, while deposits fell 0.2% in November to QR963.8bn. Qatar banks' net profit returned to pre-pandemic levels in the first half (1H) of 2021, mainly on an increase in net interest and non-interest incomes, according to Moody's, a global credit rating agency. The net earnings improvement is despite higher the provisioning charges, the rating agency said, highlighting that the lenders it rate reported an aggregate net profit of QR11.8bn, up 12% from the year-ago period. Net interest income increased, mainly due to a sharp reduction in interest costs, it said, adding total operating income rose 11% to QR23.8bn in the same period in 2020. The rise was largely driven by a reduction in interest expenses due to the low interest rate environment, it said, highlighting that the interest costs fell 16% YoY, more than offsetting the decline in interest income (3% versus the first half of 2020). The result was an overall increase in net interest income, although net interest margins remained broadly stable at 2.2%, reflecting strong loan growth of 9% YoY. Despite an overall challenging economic environment due to the pandemic, the banking sector expanded its balance sheet supported by low- risk public sector credit growth, according to Qatar Central Bank. Banks demonstrated prudent management by proactively increasing their provisioning and improving their structural liquidity conditions. Banks managed their cross-border risk well by suitably adjusting exposure to different geographies while reducing the withdrawal risk by lengthening the maturities. (Gulf- Times.com)
- 3. Page 3 of 6 Qatar Stock Exchange Top Gainers Top Decliners Source: Qatar Stock Exchange (QSE) Source: Qatar Stock Exchange (QSE) Most Active Shares by Value (QR Million) Most Active Shares by Volume (Million) Source: Qatar Stock Exchange (QSE) Source: Qatar Stock Exchange (QSE) Investor Trading Percentage to Total Value Traded Net Traded Value by Nationality (QR Million) Source: Qatar Stock Exchange (QSE) Source: Qatar Stock Exchange (QSE) 8.5% 5.8% 5.8% 4.9% 4.6% 0.0% 3.0% 6.0% 9.0% Doha Bank Qatar Insurance Company Aamal Company Ahli Bank Zad Holding Company -5.1% -4.7% -4.6% -4.1% -2.9% -6.0% -4.0% -2.0% 0.0% Dlala Brokerage & Investment Holding Company Masraf Al Rayan Mesaieed Petrochemical Holding Company Barwa Real Estate Company United Development Company 242.7 145.1 124.7 80.9 64.4 0.0 120.0 240.0 360.0 QNB Group Qatar Islamic Bank Masraf Al Rayan Gulf International Services Mazaya Qatar Real Estate Development 70.9 70.0 47.3 36.4 36.2 0.0 30.0 60.0 90.0 Salam International Investment Limited Mazaya Qatar Real Estate Development Gulf International Services Ezdan Holding Group Alijarah Holding 0% 20% 40% 60% 80% 100% Buy Sell 30.56% 40.90% 25.88% 35.02% 15.17% 13.30% 28.40% 10.78% Qatari Individuals Qatari Institutions Non-Qatari Individuals Non-Qatari Institutions 804 620 1,081 343 -277 278 -500 0 500 1,000 1,500 Qatari Non-Qatari Net Investment Total Sold Total Bought
- 4. Page 4 of 6 TECHNICAL ANALYSIS OF THE QSE INDEX Source: Bloomberg In the last trading session in 2021, the QE Index closed marginally lower at 11,625.81 (-0.6% from the week before). The uptrend remains intact, but the Index moved closer towards the uptrend line. That indicates a possible testing of that trend line; we would be concerned only if that trend line breached with higher traded volumes. Our expected support level remains at 11,400 points, and the resistance at 12,000 points. DEFINITIONS OF KEY TERMS USED IN TECHNICAL ANALYSIS RSI (Relative Strength Index) indicator – RSI is a momentum oscillator that measures the speed and change of price movements. The RSI oscillates between 0 to 100. The index is deemed to be overbought once the RSI approaches the 70 level, indicating that a correction is likely. On the other hand, if the RSI approaches 30, it is an indication that the index may be getting oversold and therefore likely to bounce back. MACD (Moving Average Convergence Divergence) indicator – The indicator consists of the MACD line and a signal line. The divergence or the convergence of the MACD line with the signal line indicates the strength in the momentum during the uptrend or downtrend, as the case may be. When the MACD crosses the signal line from below and trades above it, it gives a positive indication. The reverse is the situation for a bearish trend. Candlestick chart – A candlestick chart is a price chart that displays the high, low, open, and close for a security. The ‘body’ of the chart is portion between the open and close price, while the high and low intraday movements form the ‘shadow’. The candlestick may represent any time frame. We use a one-day candlestick chart (every candlestick represents one trading day) in our analysis. Doji candlestick pattern – A Doji candlestick is formed when a security's open and close are practically equal. The pattern indicates indecisiveness, and based on preceding price actions and future confirmation, may indicate a bullish or bearish trend reversal. Shooting Star/Inverted Hammer candlestick patterns – These candlestick patterns have a small real body (open price and close price are near to each other), and a long upper shadow (large intraday movement on the upside). The Shooting Star is a bearish reversal pattern that forms after a rally. The Inverted Hammer looks exactly like a Shooting Star, but forms after a downtrend. Inverted Hammers represent a potential bullish trend reversal.
- 5. Page 5 of 6 Source: Bloomberg Company Name Price December 30 % Change WTD % Change YTD Market Cap. QR Million TTM P/E P/B Div. Yield Qatar National Bank 20.19 0.00 13.24 186,483 15.8 2.3 2.2 Qatar Islamic Bank 18.33 0.55 7.13 43,313 13.7 2.2 2.2 Commercial Bank of Qatar 6.75 0.76 53.39 27,315 13.2 1.4 1.5 Doha Bank 3.20 8.47 35.19 9,921 15.8 0.9 2.3 Al Ahli Bank 3.83 4.93 11.11 9,306 13.2 1.4 3.9 Qatar International Islamic Bank 9.21 (1.76) 1.75 13,941 15.6 2.2 3.5 Masraf Al Rayan 4.64 (4.72) 2.43 43,152 15.6 2.3 3.7 Qatar First Bank 1.79 0.73 4.01 1,253 10.6 2.3 N/A National Leasing 0.94 2.62 (24.38) 465 18.6 0.7 2.7 Dlala Holding 1.23 (5.08) (31.25) 351 22.7 1.6 N/A Qatar & Oman Investment 0.81 0.74 (8.23) 256 45.4 0.9 N/A Islamic Holding Group 3.95 (0.93) (22.89) 223 39.5 1.5 1.3 Banking and Financial Services 335,980 Zad Holding 16.70 4.57 23.21 4,354 22.5 2.9 3.9 Qatar German Co. for Medical Devices 3.18 (2.15) 42.15 367 120.5 11.1 N/A Salam International Investment 0.82 0.61 25.81 936 N/A 0.6 N/A Baladna 1.45 (0.34) (19.27) 2,747 N/A 1.2 3.7 Medicare Group 8.50 3.27 (3.87) 2,392 26.5 2.4 21.2 Qatar Cinema & Film Distribution 3.55 0.85 (11.09) 223 72.6 1.6 2.8 Qatar Fuel 18.28 3.57 (2.14) 18,175 17.9 2.1 2.5 Qatar Meat and Livestock 3.59 (0.66) (43.15) 647 N/A 2.0 2.8 Mannai Corp. 4.75 (0.96) 58.27 2,166 5.4 1.0 0.2 Al Meera Consumer Goods 19.60 1.92 (5.36) 3,920 21.7 2.6 4.6 Consumer Goods and Services 35,927 Qatar Industrial Manufacturing 3.07 0.66 (4.33) 1,459 11.9 0.9 3.3 Qatar National Cement 5.10 (0.95) 22.89 3,333 14.1 1.1 3.9 Industries Qatar 15.49 0.13 42.50 93,715 14.1 2.5 2.1 Qatari Investors Group 2.22 (0.18) 22.58 2,760 20.1 1.0 2.7 Qatar Electricity and Water 16.60 0.67 (7.00) 18,260 13.9 1.6 3.8 Aamal 1.08 5.76 26.78 6,829 28.4 0.9 3.7 Gulf International Services 1.72 1.66 0.06 3,189 N/A 1.0 N/A Mesaieed Petrochemical Holding 2.09 (4.57) 2.10 26,257 16.0 1.6 1.9 Invesment Holding Group 1.23 (1.68) 105.18 1,020 51.3 1.2 N/A Qatar Aluminum Manufacturing 1.80 (2.01) 86.25 10,050 16.7 1.7 1.9 Industrials 166,872 Qatar Insurance 2.75 5.77 16.43 8,982 17.0 1.1 N/A QLM Life & Medical Insurance 5.05 1.61 N/A 1,768 N/A 3.0 N/A Doha Insurance 1.92 0.79 37.93 960 13.7 0.8 5.2 Qatar General Insurance & Reinsurance 2.00 0.00 (24.81) 1,750 13.6 0.3 N/A Al Khaleej Takaful Insurance 3.60 (0.58) 89.67 919 18.9 1.8 1.4 Qatar Islamic Insurance 8.00 0.19 15.94 1,200 15.5 3.0 4.1 Insurance 15,578 United Development 1.54 (2.90) (6.95) 5,453 17.6 0.5 3.2 Barw a Real Estate 3.06 (4.08) (10.03) 11,907 9.7 0.6 4.1 Ezdan Real Estate 1.34 (2.83) (24.49) 35,570 92.5 1.1 N/A Mazaya Qatar Real Estate Development 0.92 (2.13) (27.16) 1,065 34.7 0.8 3.3 Real Estate 53,995 Ooredoo 7.02 2.71 (6.65) 22,486 N/A 1.1 3.6 Vodafone Qatar 1.67 1.15 24.50 7,046 27.1 1.6 3.0 Telecoms 29,533 Qatar Navigation (Milaha) 7.64 0.51 7.68 8,747 26.5 0.6 3.9 Gulf Warehousing 4.54 0.22 (10.98) 266 11.6 1.3 2.2 Qatar Gas Transport (Nakilat) 3.30 (0.54) 3.77 18,283 14.3 2.2 3.3 Transportation 27,296 Qatar Exchange 667,574
- 6. Contacts QNB Financial Services Co. W.L.L. Contact Center: (+974) 4476 6666 info@qnbfs.com.qa Doha, Qatar Saugata Sarkar, CFA, CAIA Shahan Keushgerian Head of Research Senior Research Analyst saugata.sarkar@qnbfs.com.qa shahan.keushgerian@qnbfs.com.qa Disclaimer and Copyright Notice: This publication has been prepared by QNB Financial Services Co. W.L.L. (“QNBFS”) a wholly-owned subsidiary of Qatar National Bank (Q.P.S.C.). QNB FS is regulated by the Qatar Financial Markets Authority and the Qatar Exchange. Qatar National Bank (Q.P.S.C.) is regulated by the Qatar Central Bank. This publication expresses the views and opinions of QNBFS at a given time only. It is not an offer, promotion or recommendation to buy or sell securities or other investments, nor is it intended to constitute legal, tax, accounting, or financial advice. QNBFS accepts no liability whatsoever for any direct or indirect losses arising from use of this report. Any investment decision should depend on the individual circumstances of the investor and be based on specifically engaged investment advice. We therefore strongly advise potential investors to seek independent professional advice before making any investment decision. Although the information in this report has been obtained from sources that QNBFS believes to be reliable, we have not independently verified such information and it may not be accurate or complete. QNBFS does not make any representations or warranties as to the accuracy and completeness of the information it may contain, and declines any liability in that respect. For reports dealing with Technical Analysis, expressed opinions and/or recommendations may be different or contrary to the opinions/recommendations of QNBFS Fundamental Research as a result of depending solely on the historical technical data (price and volume). QNBFS reserves the right to amend the views and opinions expressed in this publication at any time. It may also express viewpoints or make investment decisions that differ significantly from, or even contradict, the views and opinions included in this report. This report may not be reproduced in whole or in part without permission from QNBFS. COPYRIGHT: No part of this document may be reproduced without the explicit written permission of QNBFS. Page 6 of 6