1. Page 1 of 5
Market Review and Outlook QE Index and Volume
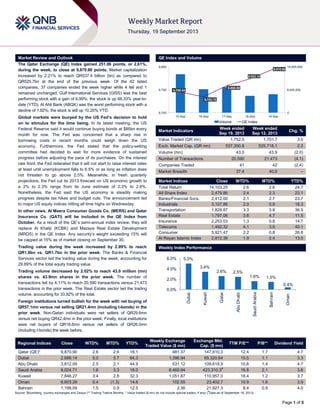
The Qatar Exchange (QE) Index gained 251.06 points, or 2.61%,
during the week, to close at 9,870.90 points. Market capitalization
increased by 2.21% to reach QR537.4 billion (bn) as compared to
QR525.7bn at the end of the previous week. Of the 42 listed
companies, 37 companies ended the week higher while 4 fell and 1
remained unchanged. Gulf International Services (GISS) was the best
performing stock with a gain of 6.99%; the stock is up 68.33% year-to-
date (YTD). Al Ahli Bank (ABQK) was the worst performing stock with a
decline of 1.82%; the stock is still up 10.20% YTD.
Global markets were buoyed by the US Fed’s decision to hold
on to stimulus for the time being. In its latest meeting, the US
Federal Reserve said it would continue buying bonds at $85bn every
month for now. The Fed was concerned that a sharp rise in
borrowing costs in recent months could weigh down the US
economy. Furthermore, the Fed stated that the policy-setting
committee had decided to wait for more evidence of sustained
progress before adjusting the pace of its purchases. On the interest
rate front, the Fed reiterated that it will not start to raise interest rates
at least until unemployment falls to 6.5% or as long as inflation does
not threaten to go above 2.5%. Meanwhile, in fresh quarterly
projections, the Fed cut its 2013 forecast on US economic growth to
a 2% to 2.3% range from its June estimate of 2.3% to 2.6%.
Nonetheless, the Fed said the US economy is steadily making
progress despite tax hikes and budget cuts. The announcement led
to major US equity indices hitting all time highs on Wednesday.
In other news, Al Meera Consumer Goods Co. (MERS) and Qatar
Insurance Co. (QATI) will be included in the QE Index from
October. As a result of the QE‟s semi-annual index review, they will
replace Al Khaliji (KCBK) and Mazaya Real Estate Development
(MRDS) in the QE Index. Any security‟s weight exceeding 15% will
be capped at 15% as of market closing on September 30.
Trading value during the week increased by 2.99% to reach
QR1.8bn vs. QR1.7bn in the prior week. The Banks & Financial
Services sector led the trading value during the week, accounting for
29.89% of the total equity trading value.
Trading volume decreased by 2.02% to reach 43.0 million (mn)
shares vs. 43.9mn shares in the prior week. The number of
transactions fell by 4.11% to reach 20,590 transactions versus 21,473
transactions in the prior week. The Real Estate sector led the trading
volume, accounting for 33.92% of the total.
Foreign institutions turned bullish for the week with net buying of
QR57.1mn versus net selling QR21.4mn (including t-bonds) in the
prior week. Non-Qatari individuals were net sellers of QR29.6mn
versus net buying QR42.4mn in the prior week. Finally, local institutions
were net buyers of QR18.6mn versus net sellers of QR26.0mn
(including t-bonds) the week before.
Market Indicators
Week ended
Sep 19, 2013
Week ended
Sep 12, 2013
Chg. %
Value Traded (QR mn) 1,752.5 1,701.7 3.0
Exch. Market Cap. (QR mn) 537,350.8 525,718.1 2.2
Volume (mn) 43.0 43.9 (2.0)
Number of Transactions 20,590 21,473 (4.1)
Companies Traded 41 42 (2.4)
Market Breadth 37:4 40:0 –
Market Indices Close WTD% MTD% YTD%
Total Return 14,103.25 2.6 2.6 24.7
All Share Index 2,479.86 2.4 2.3 23.1
Banks/Financial Svcs. 2,412.00 2.1 2.7 23.7
Industrials 3,107.86 2.0 0.8 18.3
Transportation 1,828.87 3.3 3.8 36.5
Real Estate 1,797.06 3.6 4.7 11.5
Insurance 2,253.03 1.3 0.8 14.7
Telecoms 1,492.32 4.1 3.9 40.1
Consumer 5,921.47 2.2 0.8 26.8
Al Rayan Islamic Index 2,812.36 1.9 2.4 13.0
Market Indices
Weekly Index Performance
Regional Indices Close WTD% MTD% YTD%
Weekly Exchange
Traded Value ($ mn)
Exchange Mkt.
Cap. ($ mn)
TTM P/E** P/B** Dividend Yield
Qatar (QE)* 9,870.90 2.6 2.6 18.1 481.37 147,610.3 12.4 1.7 4.7
Dubai 2,666.14 5.0 5.7 64.3 1,396.94 65,320.64 15.5 1.1 3.3
Abu Dhabi 3,812.09 2.5 2.1 44.9 531.12 109,618.9 10.8 1.4 4.7
Saudi Arabia 8,024.71 1.6 3.3 18.0 8,469.94 423,310.3#
16.8 2.1 3.6
Kuwait 7,848.27 3.4 2.8 32.3 1,051.87 110,957.0 18.4 1.2 3.7
Oman 6,603.28 0.4 (1.3) 14.6 102.55 23,402.7 10.9 1.6 3.9
Bahrain 1,199.09 1.5 0.9 12.5 2.36 21,927.3 8.4 0.9 4.0
Source: Bloomberg, country exchanges and Zawya (** Trailing Twelve Months; * Value traded ($ mn) do not include special trades, if any) (
#
Data as of September 18, 2013)
9,780.34
9,762.70
9,806.58
9,833.10
9,870.90
0
8,000,000
16,000,000
9,700
9,790
9,880
15-Sep 16-Sep 17-Sep 18-Sep 19-Sep
Volume QE Index
5.0%
3.4%
2.6% 2.5%
1.6% 1.5%
0.4%
0.0%
2.0%
4.0%
6.0%
Dubai
Kuwait
Qatar
AbuDhabi
SaudiArabia
Bahrain
Oman
2. Page 2 of 5
News
Economic News
Qatar’s GDP to grow 6.5% in 2013 – According to a report by
the QNB Group, Qatar‟s GDP will grow 6.5% in 2013 and at a
higher pace of 6.8% in 2014, with large-scale public
infrastructure projects becoming the key growth driver. The
report said Qatar‟s investment in infrastructure projects offset
the relatively low growth in the hydrocarbon sector due to the
moratorium on additional natural-gas development projects in
the North Field. These infrastructure projects, which are part of
the build-up to the 2022 World Cup, will stimulate buoyant
economic activity in construction, financial services, and
housing. Overall, these infrastructure projects are expected to
be worth 14.8% of GDP during 2013 and 2014. The
government announced a record budget for 2013-14, with
overall expenditures increasing by 18%. As a result,
hydrocarbon revenues are likely to be significantly higher than
budgeted. At the same time, the Qatari government is
estimated to overrun its capital budget by 11% to meet the
requirements of the infrastructure projects currently underway.
Meanwhile, the report mentioned that Qatar‟s crude oil
production will rise to 800,000 bpd by 2017 on the back of
higher investments and development plans. The report added
that Qatar produced an average of 726,000 bpd in the first
seven months of 2013, down from a peak annual average of
845,000 bpd in 2007. (Gulf-Times.com)
Qatar’s current account surplus to remain high – According
to a report by the QNB Group, rising exports from Qatar and
higher crude prices will keep the country‟s current account
surplus high, averaging at 34.1% of the GDP in 2013 and in
2014. The report said the relatively high oil prices would
continue to produce large current account surpluses for the
country. QNB Group expects Brent crude oil prices to average
around $105 per barrel in 2013-14, which will sustain
hydrocarbon export receipts. This, coupled with rising exports
of GTL, petrochemicals and fertilizers, is likely to offset the
strong demand for imports driven by public investment and the
growing population. Accordingly, the current account surplus is
likely to remain around 33-36% of GDP over the medium term.
Overall, QNB Group expects a fiscal surplus of 4.7% of GDP in
2013 and 2.6% of GDP in 2014. Over the medium-term, it
projects a moderation in hydrocarbon revenues on softer oil
prices and a further increase in current and capital
expenditures, leading to smaller surpluses. (Gulf-Times.com)
Qatari banks to maintain robust profitability – According to
a report by the QNB Group, Qatari banks are set to maintain
robust profitability during 2013-14 by deriving benefits from the
country‟s rising infrastructure spending and their global
expansion activities. The report found that profits reached
$8.9bn in 1H2013, equivalent to a return on average equity
(ROAE) of 15.2% for reporting banks. Higher lending, low
provisioning and a low cost base have supported the banks‟
overall profitability, even though stiffer competition has
marginally reduced ROAE in recent years. QNB Group expects
increased profitability in 2013-14 as rising public infrastructure
spending and a growing population provide ample opportunities
for credit growth. Further, Qatari banks will continue to expand
internationally as global banking asset prices remain relatively
attractive. (Gulf-Times.com)
Qatar’s CPI unchanged on MoM basis in August –
According to data released by the Ministry of Development
Planning & Statistics, Qatar‟s Consumer Price Index (CPI) for
August 2013, stayed at the previous month‟s level of 114.5,
showing no change when compared to the CPI of July 2013.
However it shows a rise of 3.1% when compared to the CPI of
August, 2012. A comparison of the CPI of August, 2013 with
that of CPI of July, 2013 at major group level, however, shows
increases in the prices of the “miscellaneous goods & services”
(0.7%), “furniture, textiles and home appliance” (0.5%), and
“rent, fuel and energy” (0.3%), which were offset by the
decreases in the prices of “transport and communications”
(0.5%) and “food, beverages and tobacco” (0.3%). In YoY
comparison, increases were recorded in all groups with the
exception of “miscellaneous goods & services” where prices
declined by 2.5%. The major increases were recorded in the
group “entertainment, recreation and culture” where prices
increased by 9.2% mainly attributable to education related
goods and services, and in “rent, fuel and energy” group by
6.9% caused by the rising trend in the rental of residential
buildings. A CPI exclusive of “rent, fuel and energy” group has
also been calculated, after eliminating the effect of rent, the
overall index reached 126.2, showing a decrease of 0.1%
compared to the CPI of July 2013, and an increase of 1.8%
when compared to CPI of August 2012. (QSA)
New Doha Port project work on schedule – New Port
Project‟s Executive Director Nabil Al Buenain said the
development works of New Doha Port are fast progressing and
the project would be delivered on time. He said the works are
progressing as per the schedule and will be ready for
operations in 2016. (Peninsula Qatar)
Market & Corporate News
MERS, QATI to replace KCBK, MRDS on the QE Index – Al
Meera Consumer Goods Company (MERS) and the Qatar
Insurance Company (QATI) will replace Al Khalij Commercial
Bank (KCBK) and Mazaya Qatar Real Estate Development
Company (MRDS) in the 20-stock QE Index from October 01,
2013. The index recast will be effective from October 1, 2013.
The other 18 entities will continue to be QNB Group, Industries
Qatar, Ooredoo, Commercial Bank, Qatar Islamic Bank, Qatar
Electricity & Water, Doha Bank, Nakilat, Barwa, Milaha, United
Development Company, International Islamic, Gulf International
Services, Qatari Investors Group, Vodafone Qatar, Alijarah
Holding and Widam Food. Meanwhile, a total of 40 stocks has
been included in QE All Share Index (and related sector index)
calculation as of October 1. Ahlibank Qatar has joined the
index, while Mannai Corporation has been removed. Further,
Qatar National Cement has joined the Al Rayan Islamic Index,
which will increase that index‟s member count to 18. (QE)
QFMA to establish grievance committee for investors – The
Qatar Financial Market Authority (QFMA) will soon establish a
five-member grievance committee to protect the interests of
investors and to promote the securities market‟s development.
The committee will decide on grievances concerning the penal
actions issued by the QFMA and its decisions will be final.
(Gulf-Times.com)
Ezdan opens first phase of City project with 1,300 housing
units – Ezdan Holding Group has completed the first phase of
Ezdan City in Wakair area, which houses over 1,300 residential
units for the corporate sector. The second phase opening is
expected to be announced during 1Q2014 and is likely to be
allocated to families only. (Qatar Tribune)
VFQS continues retail expansion across Qatar – Vodafone
Qatar (VFQS) has launched a new store at Ezdan Mall, taking
the company's retail footprint at key residential and commercial
areas across Qatar to 20 stores. (AME Info)
3. Page 3 of 5
Qatar Exchange
Top 5 Gainers Top 5 Decliners
Source: Qatar Exchange (QE) Source: Qatar Exchange (QE)
Most Active Shares by Value (QR Million) Most Active Shares by Volume (Million)
Source: Qatar Exchange (QE) Source: Qatar Exchange (QE)
Investor Trading Percentage to Total Value Traded Net Traded Value by Nationality (QR Million)
Source: Qatar Exchange (QE) Source: Qatar Exchange (QE)
7.0%
5.7%
5.2%
4.7% 4.6%
0.0%
2.5%
5.0%
7.5%
10.0%
Gulf
International
Services
Medicare
Group
Islamic
Holding Group
United
Development
Ooredoo
-1.8%
-1.5%
-0.7%
-0.4%
0.0%
-2.0%
-1.5%
-1.0%
-0.5%
0.0%
Al Ahli Bank Salam
International
Investment
Qatari
Investors
Group
Al Khaleej
Takaful
Insurance
Mannai Corp.
246.3
220.9
139.8
96.7
77.0
0.0
100.0
200.0
300.0
Industries
Qatar
United
Development
QNB Group Medicare
Group
Milaha
10.1
3.8
3.1
2.7 2.6
0.0
4.0
8.0
12.0
United
Development
Qatar Gas
Transport
(Nakilat)
Al Khaliji Barwa Real
Estate
Masraf Al
Rayan
0%
20%
40%
60%
80%
100%
Buy Sell
43.66% 46.29%
19.60% 18.54%
13.81% 15.50%
22.93% 19.67%
Qatari Individuals Qatari Institutions
Non-Qatari Individuals Non-Qatari Institutions
1,109
644
1,136
616
(28)
28
(200) - 200 400 600 800 1,000 1,200
Qatari
Non-Qatari
Net Investment Total Sold Total Bought
4. Page 4 of 5
TECHNICAL ANALYSIS OF THE QE INDEX
Source: Bloomberg
The QE Index witnessed another week of sustained buying and reported gains for the second straight week. The index rose around 7.2% (665.98 points)
over the last two weeks to close at 9,870.90. The rally in the last couple of weeks was supported by positive geopolitical/global developments. The index
broke a couple of important resistance levels during the week, moving above its 21-day moving average, and then breaching the psychological barrier of
9,800. The index started the week with a gap-up opening, and closed in the green in four of the five trading sessions. The RSI is trending higher, indicating
strength in the price action, while the MACD continues to diverge away from the signal line on the upside. We believe the index is in upswing mode, with
both the technical indicators providing support to our view, and is likely to test its next resistance level of 9,935 in the coming days. On the downside, strong
support is seen close to the 9,750 level, which if broken, may indicate a short-term trend reversal. Thus, investors should be cautious of this level.
DEFINITIONS OF KEY TERMS USED IN TECHNICAL ANALYSIS
RSI (Relative Strength Index) indicator – RSI is a momentum oscillator that measures the speed and change of price movements. The RSI oscillates
between 0 to 100. The index is deemed to be overbought once the RSI approaches the 70 level, indicating that a correction is likely. On the other hand, if
the RSI approaches 30, it is an indication that the index may be getting oversold and therefore likely to bounce back.
MACD (Moving Average Convergence Divergence) indicator – The indicator consists of the MACD line and a signal line. The divergence or the
convergence of the MACD line with the signal line indicates the strength in the momentum during the uptrend or downtrend, as the case may be. When the
MACD crosses the signal line from below and trades above it, it gives a positive indication. The reverse is the situation for a bearish trend.
Candlestick chart – A candlestick chart is a price chart that displays the high, low, open, and close for a security. The „body‟ of the chart is portion between
the open and close price, while the high and low intraday movements form the „shadow‟. The candlestick may represent any time frame. We use a one-day
candlestick chart (every candlestick represents one trading day) in our analysis.
Doji candlestick pattern – A Doji candlestick is formed when a security's open and close are practically equal. The pattern indicates indecisiveness, and
based on preceding price actions and future confirmation, may indicate a bullish or bearish trend reversal.
Shooting Star/Inverted Hammer candlestick patterns – These candlestick patterns have a small real body (open price and close price are near to each
other), and a long upper shadow (large intraday movement on the upside). The Shooting Star is a bearish reversal pattern that forms after a rally. The
Inverted Hammer looks exactly like a Shooting Star, but forms after a downtrend. Inverted Hammers represent a potential bullish trend reversal.
5. Contacts
Saugata Sarkar Ahmed M. Shehada Keith Whitney Sahbi Kasraoui
Head of Research Head of Trading Head of Sales Manager - HNWI
Tel: (+974) 4476 6534 Tel: (+974) 4476 6535 Tel: (+974) 4476 6533 Tel: (+974) 4476 6544
saugata.sarkar@qnbfs.com.qa ahmed.shehada@qnbfs.com.qa keith.whitney@qnbfs.com.qa sahbi.alkasraoui@qnbfs.com.qa
QNB Financial Services SPC
Contact Center: (+974) 4476 6666
PO Box 24025, Doha, Qatar
DISCLAIMER: This publication has been prepared by QNB Financial Services SPC (“QNBFS”) a wholly-owned subsidiary of Qatar National Bank (“QNB”). QNBFS is regulated by the Qatar
Financial Markets Authority and the Qatar Exchange; QNB is regulated by the Qatar Central Bank. This publication expresses the views and opinions of QNBFS at a given time only. It is not an
offer, promotion or recommendation to buy or sell securities or other investments, nor is it intended to constitute legal, tax, accounting, or financial advice. We therefore strongly advise potential
investors to seek independent professional advice before making any investment decision. Although the information in this report has been obtained from sources that QNBFS believes to be
reliable, we have not independently verified such information and it may not be accurate or complete. While this publication has been prepared with the utmost degree of care by our analysts,
QNBFS does not make any representations warranties as to the accuracy and completeness of the information it may contain, and declines any liability in that respect. QNBFS reserves the right
to amend the views and opinions expressed in this publication at any time. It may also express viewpoints or make investment decisions that differ significantly from, or even contradict, the views
and opinions included in this report.
COPYRIGHT: No part of this document may be reproduced without the explicit written permission of QNBFS.
Page 5 of 5
Source: Bloomberg
Company Name
Price
(Sep 19)
% Change 5-
Day
% Change
Monthly
Market Cap.
QR Million TTM P/E P/B Div. Yield
Qatar National Bank 174.60 2.83 4.24 122,173 13.6 2.6 3.4
Qatar Islamic Bank 69.00 0.88 (1.15) 16,304 14.5 1.5 5.4
Commercial Bank of Qatar 69.30 2.36 1.32 17,148 8.5 1.2 8.7
Doha Bank 54.50 1.68 1.49 14,081 9.4 1.6 7.6
Al Ahli Bank 54.00 (1.82) (1.82) 6,862 13.3 2.1 5.5
Qatar International Islamic Bank 56.90 1.07 2.52 8,613 12.2 1.8 6.2
Masraf Al Rayan 29.70 1.71 2.77 22,275 13.9 2.3 3.4
Al Khaliji Bank 18.85 1.18 1.95 6,786 12.5 1.3 5.3
National Leasing 34.55 1.32 1.02 1,710 10.1 1.3 5.8
Dlala Holding 21.82 1.02 13.29 484 N/M 2.3 N/A
Qatar & Oman Investment 13.02 0.15 4.58 410 21.4 1.3 3.8
Islamic Holding Group 41.20 5.24 6.19 165 26.3 3.2 2.7
Banking and Financial Services 217,011
Zad Holding 65.20 0.46 3.49 853 7.7 0.7 6.1
Qatar German Co. for Medical Devices 15.25 3.46 5.90 176 N/M 0.9 N/A
Salam International Investment 12.10 (1.47) (3.04) 1,383 22.9 0.9 5.8
Medicare Group 50.00 5.71 4.28 1,407 23.7 1.8 3.6
Qatar Cinema & Film Distribution 50.00 1.32 1.83 285 30.3 2.1 4.0
Qatar Fuel 285.00 2.41 0.74 18,516 16.2 3.3 3.5
Qatar Meat and Livestock 51.80 3.60 (1.71) 932 14.2 4.1 7.7
Al Meera Consumer Goods 133.90 0.75 1.83 2,678 17.6 2.2 6.0
Consumer Goods and Services 26,231
Qatar Industrial Manufacturing 50.00 1.01 3.95 1,980 11.6 1.5 6.0
Qatar National Cement 102.10 1.09 (0.10) 5,013 11.5 2.1 5.9
Industries Qatar 153.60 1.52 0.07 92,928 10.4 3.1 5.0
Qatari Investors Group 29.70 (0.67) 5.88 3,693 18.5 1.8 2.5
Qatar Electricity and Water 160.00 3.90 1.27 16,000 11.2 3.0 4.6
Mannai Corp. 83.50 0.00 (0.60) 3,809 8.8 1.7 5.6
Aamal 14.55 1.11 (0.34) 8,730 13.6 1.3 N/A
Gulf International Services 50.50 6.99 5.21 7,508 13.4 2.8 3.0
Industrials 139,661
Qatar Insurance 60.50 0.83 0.83 7,770 9.4 1.6 3.3
Doha Insurance 25.95 2.77 (0.19) 668 12.2 1.3 3.5
Qatar General Insurance & Reinsurance 52.30 2.55 1.95 3,015 3.5 0.9 1.7
Al Khaleej Takaful Insurance 40.00 (0.37) (1.23) 683 14.3 1.2 2.1
Qatar Islamic Insurance 57.00 2.33 (0.70) 855 14.4 3.2 6.1
Insurance 12,991
United Development 22.20 4.72 3.74 7,486 9.9 0.7 4.5
Barwa Real Estate 25.85 2.99 5.51 10,059 16.7 0.8 5.8
Ezdan Real Estate 17.40 0.46 (0.23) 46,153 N/M 1.7 0.7
Mazaya Qatar Real Estate Development 11.70 1.39 3.27 1,170 17.6 1.1 5.1
Real Estate 64,869
Qatar Telecom 144.90 4.62 4.24 46,414 13.8 1.8 3.5
Vodafone Qatar 9.13 0.77 1.22 7,719 N/M 1.3 N/A
Telecoms 54,133
Qatar Navigation (Milaha) 81.50 3.43 4.49 9,334 9.6 0.8 4.6
Gulf Warehousing 41.45 2.73 4.28 1,971 20.4 2.6 N/A
Qatar Gas Transport (Nakilat) 19.91 3.37 3.21 11,150 14.8 3.5 5.0
Transportation 22,455
Qatar Exchange 537,351