SlideShare a Scribd company logo
1 of 8
Download to read offline
`````
Page 1 of 8
Market Review and Outlook QSE Index and Volume
The Qatar Stock Exchange (QSE) Index remained flat declining by 0.12
points during the week, to close at 9,368.17. Market capitalization
decreased by 0.2% to reach QR547.7 billion (bn) as compared to
QR548.5bn at the end of the previous week. Of the 47 listed companies,
24 companies ended the week higher, while 23 fell and none remained
unchanged. Qatar Oman Investment Company (QOIS) was the best
performing stock for the week, with a gain of 13.9%. On the other hand,
QatarCinema &FilmDistributionCo. (QCFS) was the worst performing
stock with a decline of 5.7%.
Industries Qatar (IQCD) and Commercial Bank of Qatar (CBQK) were
the primary contributors to the weekly index performance. Industries
Qatar (IQCD) was the biggest negative contributor to the index’s
weeklyperformance,deducting40.2pointsfromtheindex.Ontheother
hand, Commercial Bank of Qatar (CBQK) was the biggest positive
contributor to the index adding 46.7 points.
Trading value during the week decreased by 25.6% to reach QR1.7bn
vs. QR2.3bn in the prior week. Qatar German Co. for Medical Devices
(QGMD) was the top value traded stock during the week with total
traded value of QR238.9mn.
Trading volume decreased by 19.2% to reach 1.0bn shares vs. 1.3bn
shares in the prior week. The numberof transactions declinedby 20.8%
to reach 35,763 transactions versus 45,155 transactions in the prior
week. Qatar Aluminium Manufacturing (QAMC) was the top volume
traded stock during the week with total traded volume of 128.5mn
shares.
Market Indicators
Week ended
July 29, 2020
Week ended
July 23, 2020
Chg. %
Value Traded (QR mn) 1,686.0 2,267.1 (25.6)
Exch. Market Cap. (QR mn) 547,678.9 548,543.4 (0.2)
Volume (mn) 1,048.0 1,296.4 (19.2)
Number of Transactions 35,763 45,155 (20.8)
Companies Traded 47 47 0.0
Market Breadth 24:23 26:20 –
Market Indices Close WTD% MTD% YTD%
Total Return 18,010.00 (0.0) 4.1 (6.1)
ALL Share Index 2,923.17 (0.1) 4.2 (5.7)
Banks and Financial Services 4,067.19 0.6 4.2 (3.6)
Industrials 2,612.37 (1.3) 4.1 (10.9)
Transportation 2,863.69 0.2 5.5 12.1
Real Estate 1,573.67 (0.9) 5.8 0.6
Insurance 2,035.82 (1.3) 3.3 (25.6)
Telecoms 912.06 (0.7) 5.1 1.9
Consumer Goods & Services 7,437.89 (0.8) 1.9 (14.0)
Al Rayan Islamic Index 3,759.96 (0.4) 3.9 (4.8)
Weekly Index Performance
Regional Indices Close WTD% MTD% YTD%
Weekly Exchange
Traded Value ($ mn)
Exchange Mkt.
Cap. ($ mn)
TTM
P/E**
P/B** Dividend Yield
Qatar* 9,368.17 (0.0) 4.1 (10.1) 460.73 149,680.6 15.3 1.4 4.3
Dubai 2,050.77 (0.1) (0.7) (25.8) 348.34 79,628.4 7.0 0.7 4.7
Abu Dhabi 4,304.74 1.0 0.4 (15.2) 146.92 171,876.9 11.2 1.3 5.9
Saudi Arabia#
7,459.21 0.4 3.3 (11.1) 5,070.16 2,234,237.8 23.5 1.8 3.5
Kuwait 4,968.23 1.9 (3.2) (20.9) 279.16 93,458.1 15.6 1.2 4.0
Oman 3,568.10 0.1 1.5 (10.4) 11.83 16,088.4 10.2 0.8 6.7
Bahrain 1,290.57 0.5 1.0 (19.8) 16.49 19,535.2 9.8 0.8 5.5
Source: Bloomberg, country exchanges and Zawya (** Trailing Twelve Months; * Value traded ($ mn) do not include special trades, if any; #Data as of July 28, 2020)
9,375.40
9,351.36
9,371.75 9,368.17
0
200,000,000
400,000,000
9,280
9,360
9,440
26-Jul 27-Jul 28-Jul 29-Jul
Volume QE Index
1.9%
1.0%
0.5% 0.4%
0.1%
(0.0%) (0.1%)(1.0%)
0.0%
1.0%
2.0%
3.0%
Kuwait
AbuDhabi
Bahrain
SaudiArabia#
Oman
Qatar*
Dubai
Page 2 of 8
News
Economic /Corporate News
 Qatar interested in hosting Olympics, as early as 2032 – Qatar
Olympic Committee (QOC) announced on Monday it has
formally submitted to the International Olympic Committee
(IOC) its request to join the non-committal “Continuous
Dialogue” to host a future edition of the Olympic and
Paralympic Games, as early as 2032. Qatar delivered the request
via an official letter to the IOC's headquarters in Lausanne,
Switzerland. Commenting on the announcement, QOC’s
President, HE Sheikh Joaan bin Hamad bin Khalifa Al-Thani
said, “Never before has an Olympic Games been held in the
Middle East. The Olympic rings are a symbol of peace, unity and
hope for people around the world, including the people of our
region. Today's announcement marks the beginning of a
meaningful dialogue with the IOC's Future Host Commission to
explore our interest further and identify how the Olympic
Games can support Qatar's long-term development goals.”
(Gulf-Times.com)
 Al-Baker: Qatar set to offer massive tourism infrastructure
investments – Qatar will have massive tourism infrastructure
investments that will be on offer, according to Qatar Airways
Group’s Chief Executive, and Secretary-General of Qatar
National Tourism Council, HE Akbar Al-Baker. “It is an
invitation to any investor who wants to come to Qatar and
invest. We guarantee tax exemptions. We guarantee
repatriation of profits. We guarantee their investments. Qatar
has a very friendly business regime in place. And it is exactly
what investors look at. So, as Qatar has such big plans to expand
its tourism sector, there are many opportunities that will be
available,” Al-Baker noted. On how Qatar is ready to deliver the
'best ever' FIFA World Cup tournament in 2022, he said, “Qatar
is very much on the delivery of the FIFA 2022. We also want to
deliver the best tournament ever happened in the world. You
know several of our stadiums are already ready. (Gulf-
Times.com)
 Moody's: Qatar among top 10 emerging market sovereign
issuers in 1H2020 – Qatar is among the 'top 10' emerging market
(EM) sovereign issuers in 1H2020, with issuances totaling
$10bn, according to Moody's Investors Service (Moody's).
Investment-grade Middle East sovereigns accounted for $32bn
of issuance in the first half of the year, Moody's said in its
‘Global Emerging Market Issuance Report’ issued on Thursday.
Middle East countries accounted for 34% of EM sovereign
issuance in 1H2020, as governments in the region turned to
market issuance to cushion the impact of the coronavirus and
oil price slide and fund counter-cyclical spending, it said. “This
further reinforces the region’srising dominance of EM sovereign
issuance. By contrast, Sub Saharan African Eurobond issuance
has largely dried up, and a major revival in market borrowing is
unlikely given that many countries in the region are facing
acute external stress,” Moody’s noted. Despite enduring the
temporary market shutdown in March, EM Eurobond issuance is
running at a record rate, with volumes reaching $343bn in the
first six months of 2020. Full-year issuance is on course to test
all-time highs, as highly rated governments and companies take
advantage of normalizing financial conditions to raise fresh
funding and refinance existing obligations with longer
maturities. That said, not all issuers will benefit from more
favorable conditions. For those lower-down the credit quality
spectrum, access to international capital markets is likely to
remain challenging. While lower than last year, EM corporate
deal flow is picking up. Investment-grade issuance has emerged
largely unscathed from market turbulence in March and April,
but high-yield segment has yet to fully recover. Oil and gas
represented the largest-issuing sector in 1H2020 (26% of total),
overtaking real estate and property for the first time since 2017.
Many national oil companies have retained strong access to
capital given their strategic importance to respective
governments, Moody’s noted. Corporate bond issuance growth,
it said is unlikely to accelerate materially in 2H2020 given the
precarious investment outlook in most sectors, although a
further pick-up in China property sales would underpin
additional bond supply. (Gulf-Times.com)
 CBQK posts 1.9% YoY decrease but 24.1% QoQ increase in net
profit in 2Q2020, above our estimate – The Commercial Bank's
(CBQK) net profit declined 1.9% YoY (but rose 24.1% on QoQ
basis) to QR499.0mn in 2Q2020, above our estimate of
QR456.2mn (variation of +9.4%). Net interest income increased
19.6% YoY in 2Q2020 to QR762.1mn. However, on QoQ basis
Net interest income declined 5.8%. The bank’s net operating
income came in at QR1,090.2mn in 2Q2020, which represents an
increase of 15.1% YoY (+20.2% QoQ). EPS amounted to QR0.22
in 2Q2020 as compared to QR0.13 in 2Q2019 (1Q2020: QR0.10).
The bank's total assets stood at QR143.7bn at the end of June 30,
2020, up 1.8% YoY. However, on QoQ basis the bank's total
assets decreased 1.9%. Loans and advances to customers were
QR87.0bn, registering a rise of 1.5% YoY at the end of June 30,
2020. However, on QoQ basis Loans and advances to customers
decreased 2.0%. Customer deposits rose 0.4% both YoY and QoQ
to reach QR77.7bn at the end of June 30, 2020. The Group’s
investment securities increased by 14.1% to QR26.8bn in
1H2020 compared with QR23.5bn in 1H2019. The increase is
mainly in Government bonds. In 1H2020, CBQK posted net
profit of QR901.2mn as compared to QR948.2mn for the same
period in 2019. Key financial highlights for the Group compared
to the same period in 2019:– Operating profit of QR1,527.2mn,
up by 17.9%. Cost to income ratio of 23.5% (normalized 26.5%),
reduced from 29.9%. Gross loan provisions of QR530.9mn, up by
3.5% due to COVID-19 related model increases in ECL. This was
offset by strong recoveries resulting in net provisions on loans
and advances to customers at QR225.2mn, down by 48.1%.
Operating profit for the Group increased by 17.9% to
QR1,527.2mn for the half year ended June 30, 2020, compared to
QR1,294.9mn achieved in the same period in 2019. Net interest
income for the Group increased by 28.0% to QR1,558.8mn on a
normalized basis for the half year ended June 30, 2020 compared
to QR1,217.9mn achieved in the same period in 2019. Net
interest margin increased to 2.4% for the half year ended June
30, 2020 compared to 2.0% achieved in the same period in 2019.
Page 3 of 8
Although asset yields have reduced, the increase in margins is
mainly due to proactive management of the cost of funding both
in Qatar as well as Turkey. Non-interest income for the Group
decreased by 17.4% to QR519.3mn on a normalized basis for the
half year ended June 30, 2020 compared with QR628.8mn
achieved in the same period in 2019. The overall decrease in
non-interest income was mainly due to an adverse unrealized
mark to market movement in investment and trading income as
a result of the unprecedented volatility in the global markets.
Total operating expenses reduced by 0.1% to QR550.9mn on a
normalized basis for the half year ended June 30, 2020 compared
with QR551.7mn in the same period in 2019. The Group’s net
provisions for loans and advances decreased by 48.1% to
QR225.2mn for the half year ended June 30, 2020, from QR433.7
million in the same period in 2019. The nonperforming loan
(NPL) ratio increased marginally to 5.0% in H1 2020 compared
to 4.9% in H1 2019. The loan coverage ratio was at 90.0% in H1
2020. The reduction in net provisions is due to strong recoveries
in H1 2020. The underlying ECL provisions have increased due
to the COVID 19 impact. (QNB FS Research, QSE, Company
Press Release)
 IQCD’s 2Q2020 Earnings Grow QoQ & Exceed Estimates Ex.
Items; Market Perform - IQCD posts QR333.6mn in 2Q2020
earnings, excluding one-offs, down 57.5% YoY but up 63.7%
QoQ – Normalized earnings were 8.8% higher than our estimate
of QR306.7mn. Reported earnings of QR281.5mn included the
impact of QR52.1mn in one-off non-cash expenses. These one-
off expenses included: 1) an impairment charge of QR1.22bn
related to mothballing of certain steel facilities (domestic rebar
capacity lowered to 0.8MTPA from 1.5MTPA previously), which
was partially offset by 2) QR1.17bn in fair value gain on
revaluation of IQCD’s 75% stake in QAFCO given QP’s recent
acquisition of Yara’s 25% stake in QAFCO. IQCD remains tax-
exempt; the reporting of income taxes in IQCD’s income
statement do not reflect any economic change but rather a
reporting (accounting) change – Reported earnings included
QR162.9mn in current and deferred income taxes. However,
investors should note that IQCD remains tax-exempt with
reported taxes on its share of earnings of JVs/subsidiaries being
offset as other income in its income statement. This current
accounting treatment for taxes formalizes the MOU between
QP, the Ministry of Finance and the General Tax Authority. The
reporting change for income taxes does not have any economic
impact on IQCD. Another accounting change introduced is that
IQCD is now recognizing QAFCO as a subsidiary (vs. a 75%-
owned JV previously) and is now consolidating all
revenue/expenses for QAFCO and netting out QP’s 25% stake
as minority interest. Given QP’s recent purchase of Yara’s 25%
stake in QAFCO, IQCD believes it has a de-facto control over
QAFCO, with effect from January 1, allowing IQCD to account
for QAFCO as a subsidiary. According to IQCD, ~5% lower ASPs
YoY dented net income by roughly QR0.7bn in 1H2020.
Petchems made up ~QR0.5bn of this decline and fertilizers
contributed ~QR0.2bn. Overall sales volumes declined by 29%
vs. 1H2019 due to weaker demand, lower production given
mothballing of steel facilities and periodic planned/unplanned
maintenance. Fertilizer sales volume also declined as QAFCO
cannot recognize sales from QAFCO 1-4 under the interim gas
processing agreement until a permanent agreement is put in
place. Group revenue of QR4.9bn declined 26% YoY from
QR6.7bn in 1H2019. Besides the previously mentioned
mothballing of steel facilities, there were no demand-driven
stoppage of production with 1H2020 production volume coming
in at 7MT, down 14% YoY. There was a planned shutdown of the
MTBE facility for a short period in 2Q2020, which had
immaterial impact on overall results. Relative to 1Q2020,
2Q2020 overall revenue declined ~37% driven by lower prices
and volumes. 2Q2020 net income benefited QoQ due to reduced
operating costs given lower production and costs optimization
initiatives. (QNB FS Research, Company Press Release, QSE)
 DHBK's net profit declines 16.3% YoY and 45.5% QoQ in
2Q2020, below our estimate – Doha Bank's (DHBK) net profit
declined 16.3% YoY (-45.5% QoQ) to QR176.6mn in 2Q2020,
below our estimate of QR218.0mn (variation of -19.0%). Net
interest income increased 11.6% YoY in 2Q2020 to QR523.5mn.
However, on QoQ basis net interest income declined 4.5%. The
company's net operating income came in at QR679.5mn in
2Q2020, which represents an increase of 3.6% YoY. However, on
QoQ basis net operating income fell 9.3%. EPS amounted to
QR0.06 in 2Q2020 as compared to QR0.07 in 2Q2019 (1Q2020:
QR0.10). The bank's total assets stood at QR108.0bn at the end
of June 30, 2020, up 7.2% YoY (+1.5% QoQ). Loans and advances
to customers were QR62.5bn, registering a rise of 2.6% YoY at
the end of June 30, 2020. However, on QoQ basis loans and
advances to customers decreased 4.4%. Customer deposits rose
0.7% YoY and 2.2% QoQ to reach QR56.0bn at the end of June
30, 2020. In 1H2020, DHBK reported net profit of QR500.7mn
compared to QR518.6mn for the same period of the previous
year. DHBK’s Chairman, Sheikh Fahad bin Mohamed bin Jabor
Al-Thani said the bank made significant progress in improving
the cost management and efficient utilization of resources,
whereby the operating cost for the period decreased by 2.2% as
compared to the same period last year, thus reducing the cost to
income ratio to 31.4% from 35.5%, showing bank’s productive
operational performance. The chairman also pointed out that
the total financial investment portfolio increased by QR1.2bn,
showing a significant growth of 4.6% as compared to the same
period of the last year. DHBK’s Managing Director, Sheikh
Abdul Rehman bin Mohamed bin Jabor Al-Thani said, “The total
shareholder’s equity stood at QR13.3bn as on June 30 this year,
registering a growth of 0.2%. The bank continued to strengthen
its key capitalization ratios, where the total capital adequacy
ratio of the bank increased to 17.6% in June from 17.4% as
compared to the same period last year. The bank, given the scale
of its operations, has achieved a return on the average assets of
0.93% as on June 30, 2020”. (QNB FS Research, QSE, Gulf-
Times.com)
 VFQS' net profit declines 3.9% YoY and 30.7% QoQ in 2Q2020,
below our estimate – Vodafone Qatar's (VFQS) net profit
declined 3.9% YoY (-30.7% QoQ) to QR33.2mn in 2Q2020, below
our estimate of QR51.4mn (variation of -35.4%). The company's
Revenue came in at QR531.5mn in 2Q2020, which represents an
increase of 0.8% YoY. However, on QoQ basis Revenue fell 1.7%.
In 1H2020, VFQS reported net profit of QR81.1mn compared to
net profit amounting to QR78.1mn for the same period of the
previous year. EPS amounted to QR0.019 in 1H2020 as
compared to QR0.018 in 1H2019. Service revenue grew by 3.4%
to reach QR1bn while total revenue increased by 1% to
Page 4 of 8
QR1.1bn, driven by the continued growth in postpaid and higher
home broadband revenue, VFQS announced. EBITDA (earnings
before interest, taxes, depreciation, and amortization) for the
period stood at QR390mn; representing a strong improvement
of 9% YoY, positively impacted by higher service revenue,
continued cost optimization initiatives, lower equipment cost
and the reduction in mobile termination rates. EBITDA margin
further has improved by 2.6 percentage points to reach 36.3% in
1H2020. In response to the coronavirus pandemic, VFQS was
quick to activate its business continuity measures, which has
proved vital in minimizing operational disruptions. The
company has continued to fully deliver services and products to
all of its customers, thereby facilitating remote work, learning
and other digital needs. VFQS has remained focused on
executing its defined strategy to support the continuation of the
current growth trajectory of the company. This includes
expanding its ‘GigaNet’ network by accelerating the
deployment of fiber and 5G in several strategic locations across
the country. (QNB FS Research, QSE, Gulf-Times.com)
 ORDS' bottom line rises 2.6% YoY and 11.6% QoQ in 2Q2020 –
Ooredoo's (ORDS) net profit rose 2.6% YoY (+11.6% QoQ) to
QR431.7mn in 2Q2020.The company's Revenue came in at
QR6,822.8mn in 2Q2020, which represents a decrease of 6.7%
YoY (-6.5% QoQ). EPS remained flat YoY at QR0.13 in 2Q2020
(1Q2020: QR0.12). In 1H2020, ORDS posted net profit of
QR818.5mn compared to net profit amounting to QR841.2mn for
the same period of the previous year. EPS remained flat YoY at
QR0.26 in 1H2020. ORDS Group announced half yearly revenue
of QR14.1bn, declined by 3% YoY due to the COVID-19 impact.
A reduction in handset sales and roaming business as well as
macroeconomic weakness in some of Ooredoo’s markets was
partially offset by robust growth in Indonesia, Tunisia and
Myanmar. EBITDA declined by 5% YoY to QR6bn, impacted by
movement restrictions to contain the spread of COVID-19 in its
markets as well as challenging market conditions in Algeria,
Kuwait, Iraq and Oman. Group net profit attributable to
shareholders has declined by 3% YoY to QR818.5mn in 1H2020,
due to the reduction in EBITDA, which was partially offset by a
more favorable foreign exchange environment compared to the
same period last year. Data revenues account for more than 50%
of total revenue driven by Ooredoo’s “data leadership and
digital transformation initiatives across the countries we
operate in.” ORDS Group said it has healthy cash reserve and
liquidity levels to be able to absorb the impact of COVID-19 for
2020. In terms of COVID-19 response, it said it “remained
sharply focused on mitigating the impact of COVID-19 during
2Q2020.” On the results, Sheikh Saud bin Nasser Al-Thani,
Group CEO, said, “In our home market of Qatar, our post-paid
customer base crossed the half-a-million mark and the 5G plans
launched in December attracted over 200,000 customers
already. In Kuwait and Oman, we have partnered with the
respective Ministry of Education to launch e-learning platforms
from home for the upcoming school year 2020–2021. With
digitalization at our core, we continue to invest in new products
and services to power the future of connectivity. In Oman we
launched 5G Home Internet which enables customers to
experience connectivity up to 10 times faster than the current
home Internet services, while bringing high speed Internet
access to new areas of the country, and in Algeria we continue
to operate the fastest 4G network in the country spanning all 48
Wilayas.” Ooredoo Qatar has seen its customer numbers going
up 1.3% YoY to 3.4mn in June, the company announced. (QSE,
Gulf-Times.com)
 BRES' bottom line rises ~331% YoY and ~131% QoQ in 2Q2020
– Barwa Real Estate Company's (BRES) net profit rose ~331%
YoY (+~131% QoQ) to ~QR409mn in 2Q2020. 1H2020, BRES
posted net profit of QR586mn, compared to a net profit of
QR510mn for the same period of the previous year. EPS
amounted to QR0.15 in 1H2020 as compared to QR0.13 in
1H2019. (QSE)
Page 5 of 8
Qatar Stock Exchange
Top Gainers Top Decliners
Source: Qatar Stock Exchange (QSE) Source: Qatar Stock Exchange (QSE)
Most Active Shares by Value (QR Million) Most Active Shares by Volume (Million)
Source: Qatar Stock Exchange (QSE) Source: Qatar Stock Exchange (QSE)
13.9%
9.6%
8.7%
7.5% 7.3%
0.0%
5.0%
10.0%
15.0%
Qatar Oman
Investment
Company
Qatari German
Company for
Medical Devices
The Commercial
Bank
Baladna Qatar First Bank
-5.7%
-4.2% -4.0% -3.9%
-3.5%
-7.5%
-5.0%
-2.5%
0.0%
Qatar Cinema &
Film Distribution
Company
Islamic Holding
Group
Industries Qatar Mannai
Corporation
Vodafone Qatar
238.9
112.4
99.4 93.1 88.0
0.0
100.0
200.0
300.0
Qatari German
Company for
Medical Devices
Qatar Aluminium
Manufacturing
Company
QNB Group Dlala Brokerage
& Investment
Holding
Company
Baladna
128.5
100.9 98.0 92.9
83.9
0.0
50.0
100.0
150.0
Qatar Aluminium
Manufacturing
Company
Qatari German
Company for
Medical Devices
Qatar Oman
Investment
Company
Salam
International
Investment
Limited
Alijarah Holding
Page 6 of 8
TECHNICAL ANALYSIS OF THE QSE INDEX
Source: Bloomberg
The QSE Index closed flattish, from the week before and finished at the 9,368.17 level. The Index bounced off the corrective uptrend channel, but it remains
below its 200-day moving average; it should move above that level before the index becomes positive in the medium term. The general index needs to remain
above the 9,000 to hold its ground.
DEFINITIONS OF KEY TERMS USED IN TECHNICAL ANALYSIS
RSI (Relative Strength Index) indicator – RSI is a momentum oscillator that measures the speedand change of price movements. The RSI oscillates between
0 to 100. The index is deemed to be overbought once the RSI approaches the 70 level, indicating that a correction is likely. On the other hand, if the RSI
approaches 30, it is an indication that the index may be getting oversold and therefore likely to bounce back.
MACD (Moving Average Convergence Divergence) indicator – The indicator consists of the MACD line and a signal line. The divergence or the convergence
of the MACD line with the signal line indicates the strength in the momentum during the uptrend or downtrend, as the case may be. When the MACD
crosses the signal line from below and trades above it, it gives a positive indication. The reverse is the situation for a bearish trend.
Candlestick chart – A candlestick chart is a price chart that displays the high, low, open, and close for a security. The ‘body’ of the chart is portion between
the open and close price, while the high and low intraday movements form the ‘shadow’. The candlestick may represent any time frame. We use a one-day
candlestick chart (every candlestick represents one trading day) in our analysis.
Doji candlestick pattern – A Doji candlestick is formed when a security's open and close are practically equal. The pattern indicates indecisiveness, and
based on preceding price actions and future confirmation, may indicate a bullish or bearish trend reversal.
ShootingStar/Inverted Hammer candlestick patterns – These candlestick patterns have a small real body (open price and close price are near to each other),
and a long upper shadow (large intraday movement on the upside). The Shooting Star is a bearish reversal pattern that forms after a rally. The Inverted
Hammer looks exactly like a Shooting Star, but forms after a downtrend. Inverted Hammers represent a potential bullish trend reversal.
Page 7 of 8
Source: Bloomberg
Company Name Price July 29
% Change
WTD
% Change
YTD
Market Cap.
QR Million
TTM P/E P/B Div. Yield
Qatar National Bank 18.00 (0.50) (12.58) 166,256 14.3 2.4 3.3
Qatar Islamic Bank 16.10 0.63 5.02 38,043 13.4 2.3 3.3
Commercial Bank of Qatar 4.13 8.68 (12.13) 16,715 9.4 0.9 4.8
Doha Bank 2.37 (1.04) (6.32) 7,348 14.1 0.8 N/A
Al Ahli Bank 3.30 3.12 (1.00) 8,018 13.1 1.4 4.3
Qatar International Islamic Bank 8.21 (0.70) (15.19) 12,427 14.1 2.1 5.2
Masraf Al Rayan 3.94 1.23 (0.56) 29,535 13.5 2.2 5.7
Al Khaliji Bank 1.55 (3.13) 18.32 5,580 9.3 0.9 4.8
Qatar First Bank 1.35 7.26 64.43 942 N/A 1.9 N/A
National Leasing 0.91 5.84 28.51 448 16.7 0.7 5.5
Dlala Holding 1.91 3.52 212.77 543 N/A 2.9 N/A
Qatar & Oman Investment 0.84 13.86 25.26 264 37.0 1.0 2.4
Islamic Holding Group 3.87 (4.19) 103.47 219 71.4 1.6 N/A
Banking and Financial Services 286,338
Zad Holding 15.00 (1.25) 8.54 3,555 17.2 2.2 5.7
Qatar German Co. for Medical Devices 2.37 9.63 306.87 274 N/A 9.7 N/A
Salam International Investment 0.46 0.44 (11.99) 520 N/A 0.5 N/A
Baladna 1.72 7.50 72.00 3,270 N/A 1.5 1.2
Medicare Group 7.34 (1.30) (13.15) 2,065 28.5 2.2 24.5
Qatar Cinema & Film Distribution 3.31 (5.72) 50.45 208 46.2 0.2 3.0
Qatar Fuel 16.10 (1.04) (29.69) 16,008 17.0 2.0 5.0
Qatar Meat and Livestock 6.77 (1.46) 0.15 1,219 14.3 3.5 4.4
Mannai Corp. 2.81 (3.93) (8.77) 1,282 9.8 0.5 7.1
Al Meera Consumer Goods 19.15 0.84 25.16 3,830 19.9 3.0 4.4
Consumer Goods and Services 32,230
Qatar Industrial Manufacturing 2.70 (1.49) (24.26) 1,285 13.7 0.8 5.5
Qatar National Cement 3.68 0.68 (34.96) 2,402 17.4 0.8 8.2
Industries Qatar 7.82 (4.05) (23.93) 47,311 30.0 1.5 5.1
Qatari Investors Group 2.19 5.44 22.35 2,723 27.0 1.0 2.5
Qatar Electricity and Water 16.90 0.60 5.03 18,590 12.8 2.2 4.6
Aamal 0.77 (0.90) (5.41) 4,845 15.7 0.6 5.2
Gulf International Services 1.69 0.72 (2.03) 3,131 113.0 0.9 N/A
Mesaieed Petrochemical Holding 2.09 0.19 (16.93) 26,194 26.9 1.8 3.4
Invesment Holding Group 0.51 (1.17) (9.93) 422 8.5 0.5 N/A
Qatar Aluminum Manufacturing 0.85 3.43 8.19 4,715 N/A 0.8 1.2
Industrials 111,618
Qatar Insurance 2.01 (3.41) (36.33) 6,571 N/A 0.9 7.5
Doha Insurance 1.04 (0.48) (13.75) 518 11.1 0.5 7.7
Qatar General Insurance & Reinsurance 2.22 5.62 (9.84) 1,941 N/A 0.4 N/A
Al Khaleej Takaful Insurance 1.83 5.71 (8.30) 468 14.8 0.9 2.7
Qatar Islamic Insurance 6.20 (1.18) (7.17) 930 13.7 2.5 6.0
Insurance 10,428
United Development 1.17 1.30 (23.16) 4,136 17.1 0.4 4.3
Barw a Real Estate 3.17 (2.62) (10.59) 12,316 7.7 0.6 6.3
Ezdan Real Estate 1.42 0.07 130.89 37,665 3955.4 1.2 N/A
Mazaya Qatar Real Estate Development 0.88 (0.11) 21.84 1,014 35.8 0.8 N/A
Real Estate 55,131
Ooredoo 6.70 0.36 (5.37) 21,461 12.8 1.0 3.7
Vodafone Qatar 1.26 (3.46) 8.19 5,305 36.5 1.2 4.0
Telecoms 26,766
Qatar Navigation (Milaha) 5.86 (2.01) (3.93) 6,711 12.5 0.5 5.1
Gulf Warehousing 5.03 (0.85) (8.16) 295 12.4 1.7 4.0
Qatar Gas Transport (Nakilat) 2.80 1.71 17.11 15,507 14.5 2.6 3.6
Transportation 22,513
Qatar Exchange 547,679
Contacts
Saugata Sarkar, CFA, CAIA Shahan Keushgerian Zaid al-Nafoosi , CMT, CFTe
Head of Research Senior Research Analyst Senior Research Analyst
Tel: (+974) 4476 6534 Tel: (+974) 4476 6509 Tel: (+974) 4476 6535
saugata.sarkar@qnbfs.com.qa shahan.keushgerian@qnbfs.com.qa zaid.alnafoosi@qnbfs.com.qa
Mehmet Aksoy, PhD QNB Financial Services Co. W.L.L.
Senior Research Analyst Contact Center: (+974) 4476 6666
Tel: (+974) 4476 6589 PO Box 24025
mehmet.aksoy@qnbfs.com.qa Doha, Qatar
Disclaimer and Copyright Notice: This publication has been prepared by QNB Financial Services Co. W.L.L. (“QNB FS”) a wholly-owned subsidiary of Qatar National Bank (Q.P.S.C.). QNB FS is
regulated by the Qatar Financial Markets Authority and the Qatar Exchange. Qatar National Bank (Q.P.S.C.) is regulated by the Qatar Central Bank. This publication expresses the views and
opinions of QNB FS at a given time only. It is not an offer, promotion or recommendation to buy or sell securities or other investments, nor is it intended to constitute legal, tax, accounting, or
financial advice. QNB FS accepts no liability whatsoever for any direct or indirect losses arising from use of this report. Any investment decision should depend on the individual circumstances of
the investor and be based on specifically engaged investment advice. We therefore strongly advise potential investors to seek independent professional advice before making any investment
decision. Although the information in this report has been obtained from sources that QNB FS believes to be reliable, we have not independently verified such information and it may not be accurate
or complete. QNB FS does not make any representations or warranties as to the accuracy and completeness of the information it may contain, and declines any liability in that respect. For reports
dealing with Technical Analysis, expressed opinions and/or recommendations may be different or contrary to the opinions/recommendations of QNB FS Fundamental Research as a result of
depending solely on the historical technical data (price and volume). QNB FS reserves the right to amend the views and opinions expressed in this publication at any time. It may also express
viewpoints or make investment decisions that differ significantly from, or even contradict, the views and opinions included in this report. This report may not be reproduced in whole or in part
without permission from QNB FS
COPYRIGHT: No part of this document may be reproduced without the explicit written permission of QNB FS.
Page 8 of 8

More Related Content

What's hot

QNBFS Daily Market Report September 16, 2021
QNBFS Daily Market Report September 16, 2021QNBFS Daily Market Report September 16, 2021
QNBFS Daily Market Report September 16, 2021QNB Group
 
6 June Technical Market Report
6 June Technical Market Report6 June Technical Market Report
6 June Technical Market ReportQNB Group
 
QNBFS Weekly Market Report November 24, 2016
QNBFS Weekly Market Report November 24, 2016QNBFS Weekly Market Report November 24, 2016
QNBFS Weekly Market Report November 24, 2016QNB Group
 
QNBFS Daily Market Report September 19, 2021
QNBFS Daily Market Report September 19, 2021QNBFS Daily Market Report September 19, 2021
QNBFS Daily Market Report September 19, 2021QNB Group
 
Weekly Market Report
Weekly Market ReportWeekly Market Report
Weekly Market ReportQNB Group
 
QNBFS Weekly Market Report April 02, 2020
QNBFS Weekly Market Report April 02, 2020QNBFS Weekly Market Report April 02, 2020
QNBFS Weekly Market Report April 02, 2020QNB Group
 
Weekly Market Report
Weekly Market ReportWeekly Market Report
Weekly Market ReportQNB Group
 
18 June Daily market report
18 June Daily market report18 June Daily market report
18 June Daily market reportQNB Group
 
QNBFS Daily Market Report December 29, 2021
QNBFS Daily Market Report December 29, 2021QNBFS Daily Market Report December 29, 2021
QNBFS Daily Market Report December 29, 2021QNB Group
 
QNBFS Weekly Market Report May 03, 2018
QNBFS Weekly Market Report May 03, 2018QNBFS Weekly Market Report May 03, 2018
QNBFS Weekly Market Report May 03, 2018QNB Group
 
3 December Daily Market Report
3 December Daily Market Report3 December Daily Market Report
3 December Daily Market ReportQNB Group
 
Weekly market report
Weekly market reportWeekly market report
Weekly market reportQNB Group
 
QNBFS Daily Market Report December 19, 2018
QNBFS Daily Market Report December 19, 2018QNBFS Daily Market Report December 19, 2018
QNBFS Daily Market Report December 19, 2018QNB Group
 
16 June Technical Market report
16 June Technical Market report16 June Technical Market report
16 June Technical Market reportQNB Group
 
QNBFS Weekly Market Report January 5, 2016
QNBFS Weekly Market Report January 5, 2016QNBFS Weekly Market Report January 5, 2016
QNBFS Weekly Market Report January 5, 2016QNB Group
 
8 September Daily market report
8 September Daily market report8 September Daily market report
8 September Daily market reportQNB Group
 
5 August Daily market report
5 August Daily market report 5 August Daily market report
5 August Daily market report QNB Group
 
QNBFS Weekly Market Report July 26, 2018.
QNBFS Weekly Market Report July 26, 2018. QNBFS Weekly Market Report July 26, 2018.
QNBFS Weekly Market Report July 26, 2018. QNB Group
 
15 December Daily Market Report
15 December Daily Market Report15 December Daily Market Report
15 December Daily Market ReportQNB Group
 
Weekly market report
Weekly market report Weekly market report
Weekly market report QNB Group
 

What's hot (20)

QNBFS Daily Market Report September 16, 2021
QNBFS Daily Market Report September 16, 2021QNBFS Daily Market Report September 16, 2021
QNBFS Daily Market Report September 16, 2021
 
6 June Technical Market Report
6 June Technical Market Report6 June Technical Market Report
6 June Technical Market Report
 
QNBFS Weekly Market Report November 24, 2016
QNBFS Weekly Market Report November 24, 2016QNBFS Weekly Market Report November 24, 2016
QNBFS Weekly Market Report November 24, 2016
 
QNBFS Daily Market Report September 19, 2021
QNBFS Daily Market Report September 19, 2021QNBFS Daily Market Report September 19, 2021
QNBFS Daily Market Report September 19, 2021
 
Weekly Market Report
Weekly Market ReportWeekly Market Report
Weekly Market Report
 
QNBFS Weekly Market Report April 02, 2020
QNBFS Weekly Market Report April 02, 2020QNBFS Weekly Market Report April 02, 2020
QNBFS Weekly Market Report April 02, 2020
 
Weekly Market Report
Weekly Market ReportWeekly Market Report
Weekly Market Report
 
18 June Daily market report
18 June Daily market report18 June Daily market report
18 June Daily market report
 
QNBFS Daily Market Report December 29, 2021
QNBFS Daily Market Report December 29, 2021QNBFS Daily Market Report December 29, 2021
QNBFS Daily Market Report December 29, 2021
 
QNBFS Weekly Market Report May 03, 2018
QNBFS Weekly Market Report May 03, 2018QNBFS Weekly Market Report May 03, 2018
QNBFS Weekly Market Report May 03, 2018
 
3 December Daily Market Report
3 December Daily Market Report3 December Daily Market Report
3 December Daily Market Report
 
Weekly market report
Weekly market reportWeekly market report
Weekly market report
 
QNBFS Daily Market Report December 19, 2018
QNBFS Daily Market Report December 19, 2018QNBFS Daily Market Report December 19, 2018
QNBFS Daily Market Report December 19, 2018
 
16 June Technical Market report
16 June Technical Market report16 June Technical Market report
16 June Technical Market report
 
QNBFS Weekly Market Report January 5, 2016
QNBFS Weekly Market Report January 5, 2016QNBFS Weekly Market Report January 5, 2016
QNBFS Weekly Market Report January 5, 2016
 
8 September Daily market report
8 September Daily market report8 September Daily market report
8 September Daily market report
 
5 August Daily market report
5 August Daily market report 5 August Daily market report
5 August Daily market report
 
QNBFS Weekly Market Report July 26, 2018.
QNBFS Weekly Market Report July 26, 2018. QNBFS Weekly Market Report July 26, 2018.
QNBFS Weekly Market Report July 26, 2018.
 
15 December Daily Market Report
15 December Daily Market Report15 December Daily Market Report
15 December Daily Market Report
 
Weekly market report
Weekly market report Weekly market report
Weekly market report
 

Similar to QNBFS Weekly Market Report July 29, 2020

QNBFS Weekly Market Report June 18, 2020
QNBFS Weekly Market Report June 18, 2020QNBFS Weekly Market Report June 18, 2020
QNBFS Weekly Market Report June 18, 2020QNB Group
 
QNBFS Weekly Market Report August 13, 2020
QNBFS Weekly Market Report August 13, 2020QNBFS Weekly Market Report August 13, 2020
QNBFS Weekly Market Report August 13, 2020QNB Group
 
Weekly Market Report February 25, 2021
Weekly Market Report February 25, 2021Weekly Market Report February 25, 2021
Weekly Market Report February 25, 2021QNB Group
 
QNBFS Weekly Market Report December 23, 2021
QNBFS Weekly Market Report December 23, 2021QNBFS Weekly Market Report December 23, 2021
QNBFS Weekly Market Report December 23, 2021QNB Group
 
QNBFS Weekly Market Report October 29, 2020
QNBFS Weekly Market Report October 29, 2020QNBFS Weekly Market Report October 29, 2020
QNBFS Weekly Market Report October 29, 2020QNB Group
 
QNBFS Weekly Market Report October 1, 2020
QNBFS Weekly Market Report October 1, 2020QNBFS Weekly Market Report October 1, 2020
QNBFS Weekly Market Report October 1, 2020QNB Group
 
QNBFS Weekly Market Report January 21, 2021
QNBFS Weekly Market Report January 21, 2021QNBFS Weekly Market Report January 21, 2021
QNBFS Weekly Market Report January 21, 2021QNB Group
 
QNBFS Weekly Market Report May 06, 2021
QNBFS Weekly Market Report May 06, 2021QNBFS Weekly Market Report May 06, 2021
QNBFS Weekly Market Report May 06, 2021QNB Group
 
QNBFS Weekly Market Report April 21, 2022
QNBFS Weekly Market Report April 21, 2022QNBFS Weekly Market Report April 21, 2022
QNBFS Weekly Market Report April 21, 2022QNB Group
 
QNBFS Weekly Market Report February 11, 2021
QNBFS Weekly Market Report February 11, 2021QNBFS Weekly Market Report February 11, 2021
QNBFS Weekly Market Report February 11, 2021QNB Group
 
QNBFS Weekly Market Report November 16, 2017
QNBFS Weekly Market Report November 16, 2017QNBFS Weekly Market Report November 16, 2017
QNBFS Weekly Market Report November 16, 2017QNB Group
 
QNBFS Weekly Market Report September 03, 2020
QNBFS Weekly Market Report September 03, 2020QNBFS Weekly Market Report September 03, 2020
QNBFS Weekly Market Report September 03, 2020QNB Group
 
QNBFS Weekly Market Report August 20, 2020
QNBFS Weekly Market Report August 20, 2020QNBFS Weekly Market Report August 20, 2020
QNBFS Weekly Market Report August 20, 2020QNB Group
 
QNBFS Weekly Market Report July 16, 2020
QNBFS Weekly Market Report July 16, 2020QNBFS Weekly Market Report July 16, 2020
QNBFS Weekly Market Report July 16, 2020QNB Group
 
QNBFS Weekly Market Report December 31, 2020
QNBFS Weekly Market Report December 31, 2020QNBFS Weekly Market Report December 31, 2020
QNBFS Weekly Market Report December 31, 2020QNB Group
 
Weekly market report
Weekly market report Weekly market report
Weekly market report QNB Group
 
QNBFS Weekly Market Report September 02, 2021
QNBFS Weekly Market Report September 02, 2021QNBFS Weekly Market Report September 02, 2021
QNBFS Weekly Market Report September 02, 2021QNB Group
 
QNBFS Daily Market Report November 01, 2020
QNBFS Daily Market Report November 01, 2020QNBFS Daily Market Report November 01, 2020
QNBFS Daily Market Report November 01, 2020QNB Group
 
QNBFS Weekly Market Report March 04, 2021
QNBFS Weekly Market Report March 04, 2021QNBFS Weekly Market Report March 04, 2021
QNBFS Weekly Market Report March 04, 2021QNB Group
 
QNBFS Weekly Market Report September 16, 2021
QNBFS Weekly Market Report September 16, 2021QNBFS Weekly Market Report September 16, 2021
QNBFS Weekly Market Report September 16, 2021QNB Group
 

Similar to QNBFS Weekly Market Report July 29, 2020 (20)

QNBFS Weekly Market Report June 18, 2020
QNBFS Weekly Market Report June 18, 2020QNBFS Weekly Market Report June 18, 2020
QNBFS Weekly Market Report June 18, 2020
 
QNBFS Weekly Market Report August 13, 2020
QNBFS Weekly Market Report August 13, 2020QNBFS Weekly Market Report August 13, 2020
QNBFS Weekly Market Report August 13, 2020
 
Weekly Market Report February 25, 2021
Weekly Market Report February 25, 2021Weekly Market Report February 25, 2021
Weekly Market Report February 25, 2021
 
QNBFS Weekly Market Report December 23, 2021
QNBFS Weekly Market Report December 23, 2021QNBFS Weekly Market Report December 23, 2021
QNBFS Weekly Market Report December 23, 2021
 
QNBFS Weekly Market Report October 29, 2020
QNBFS Weekly Market Report October 29, 2020QNBFS Weekly Market Report October 29, 2020
QNBFS Weekly Market Report October 29, 2020
 
QNBFS Weekly Market Report October 1, 2020
QNBFS Weekly Market Report October 1, 2020QNBFS Weekly Market Report October 1, 2020
QNBFS Weekly Market Report October 1, 2020
 
QNBFS Weekly Market Report January 21, 2021
QNBFS Weekly Market Report January 21, 2021QNBFS Weekly Market Report January 21, 2021
QNBFS Weekly Market Report January 21, 2021
 
QNBFS Weekly Market Report May 06, 2021
QNBFS Weekly Market Report May 06, 2021QNBFS Weekly Market Report May 06, 2021
QNBFS Weekly Market Report May 06, 2021
 
QNBFS Weekly Market Report April 21, 2022
QNBFS Weekly Market Report April 21, 2022QNBFS Weekly Market Report April 21, 2022
QNBFS Weekly Market Report April 21, 2022
 
QNBFS Weekly Market Report February 11, 2021
QNBFS Weekly Market Report February 11, 2021QNBFS Weekly Market Report February 11, 2021
QNBFS Weekly Market Report February 11, 2021
 
QNBFS Weekly Market Report November 16, 2017
QNBFS Weekly Market Report November 16, 2017QNBFS Weekly Market Report November 16, 2017
QNBFS Weekly Market Report November 16, 2017
 
QNBFS Weekly Market Report September 03, 2020
QNBFS Weekly Market Report September 03, 2020QNBFS Weekly Market Report September 03, 2020
QNBFS Weekly Market Report September 03, 2020
 
QNBFS Weekly Market Report August 20, 2020
QNBFS Weekly Market Report August 20, 2020QNBFS Weekly Market Report August 20, 2020
QNBFS Weekly Market Report August 20, 2020
 
QNBFS Weekly Market Report July 16, 2020
QNBFS Weekly Market Report July 16, 2020QNBFS Weekly Market Report July 16, 2020
QNBFS Weekly Market Report July 16, 2020
 
QNBFS Weekly Market Report December 31, 2020
QNBFS Weekly Market Report December 31, 2020QNBFS Weekly Market Report December 31, 2020
QNBFS Weekly Market Report December 31, 2020
 
Weekly market report
Weekly market report Weekly market report
Weekly market report
 
QNBFS Weekly Market Report September 02, 2021
QNBFS Weekly Market Report September 02, 2021QNBFS Weekly Market Report September 02, 2021
QNBFS Weekly Market Report September 02, 2021
 
QNBFS Daily Market Report November 01, 2020
QNBFS Daily Market Report November 01, 2020QNBFS Daily Market Report November 01, 2020
QNBFS Daily Market Report November 01, 2020
 
QNBFS Weekly Market Report March 04, 2021
QNBFS Weekly Market Report March 04, 2021QNBFS Weekly Market Report March 04, 2021
QNBFS Weekly Market Report March 04, 2021
 
QNBFS Weekly Market Report September 16, 2021
QNBFS Weekly Market Report September 16, 2021QNBFS Weekly Market Report September 16, 2021
QNBFS Weekly Market Report September 16, 2021
 

More from QNB Group

QNBFS Daily Market Report December 24, 2023
QNBFS Daily Market Report December 24, 2023QNBFS Daily Market Report December 24, 2023
QNBFS Daily Market Report December 24, 2023QNB Group
 
QNBFS Daily Market Report November 29, 2023
QNBFS Daily Market Report November 29, 2023QNBFS Daily Market Report November 29, 2023
QNBFS Daily Market Report November 29, 2023QNB Group
 
QNBFS Weekly Market Report November 23, 2023
QNBFS Weekly Market Report November 23, 2023QNBFS Weekly Market Report November 23, 2023
QNBFS Weekly Market Report November 23, 2023QNB Group
 
QNBFS Weekly Market Report November 16, 2023
QNBFS Weekly Market Report November 16, 2023QNBFS Weekly Market Report November 16, 2023
QNBFS Weekly Market Report November 16, 2023QNB Group
 
QNBFS Daily Technical Trader Qatar - November 14, 2023 التحليل الفني اليومي ل...
QNBFS Daily Technical Trader Qatar - November 14, 2023 التحليل الفني اليومي ل...QNBFS Daily Technical Trader Qatar - November 14, 2023 التحليل الفني اليومي ل...
QNBFS Daily Technical Trader Qatar - November 14, 2023 التحليل الفني اليومي ل...QNB Group
 
QNBFS Daily Technical Trader Qatar - November 06, 2023 التحليل الفني اليومي ل...
QNBFS Daily Technical Trader Qatar - November 06, 2023 التحليل الفني اليومي ل...QNBFS Daily Technical Trader Qatar - November 06, 2023 التحليل الفني اليومي ل...
QNBFS Daily Technical Trader Qatar - November 06, 2023 التحليل الفني اليومي ل...QNB Group
 
QNBFS Daily Market Report October 30, 2023
QNBFS Daily Market Report October 30, 2023QNBFS Daily Market Report October 30, 2023
QNBFS Daily Market Report October 30, 2023QNB Group
 
QNBFS Daily Technical Trader Qatar - October 25, 2023 التحليل الفني اليومي لب...
QNBFS Daily Technical Trader Qatar - October 25, 2023 التحليل الفني اليومي لب...QNBFS Daily Technical Trader Qatar - October 25, 2023 التحليل الفني اليومي لب...
QNBFS Daily Technical Trader Qatar - October 25, 2023 التحليل الفني اليومي لب...QNB Group
 
QNBFS Daily Technical Trader Qatar - October 10, 2023 التحليل الفني اليومي لب...
QNBFS Daily Technical Trader Qatar - October 10, 2023 التحليل الفني اليومي لب...QNBFS Daily Technical Trader Qatar - October 10, 2023 التحليل الفني اليومي لب...
QNBFS Daily Technical Trader Qatar - October 10, 2023 التحليل الفني اليومي لب...QNB Group
 
QNBFS Daily Technical Trader Qatar - October 11, 2023 التحليل الفني اليومي لب...
QNBFS Daily Technical Trader Qatar - October 11, 2023 التحليل الفني اليومي لب...QNBFS Daily Technical Trader Qatar - October 11, 2023 التحليل الفني اليومي لب...
QNBFS Daily Technical Trader Qatar - October 11, 2023 التحليل الفني اليومي لب...QNB Group
 
QNBFS Daily Technical Trader Qatar - October 10, 2023 التحليل الفني اليومي لب...
QNBFS Daily Technical Trader Qatar - October 10, 2023 التحليل الفني اليومي لب...QNBFS Daily Technical Trader Qatar - October 10, 2023 التحليل الفني اليومي لب...
QNBFS Daily Technical Trader Qatar - October 10, 2023 التحليل الفني اليومي لب...QNB Group
 
QNBFS Daily Market Report October 04, 2023
QNBFS Daily Market Report October 04, 2023QNBFS Daily Market Report October 04, 2023
QNBFS Daily Market Report October 04, 2023QNB Group
 
QNBFS Daily Technical Trader Qatar - October 04, 2023 التحليل الفني اليومي لب...
QNBFS Daily Technical Trader Qatar - October 04, 2023 التحليل الفني اليومي لب...QNBFS Daily Technical Trader Qatar - October 04, 2023 التحليل الفني اليومي لب...
QNBFS Daily Technical Trader Qatar - October 04, 2023 التحليل الفني اليومي لب...QNB Group
 
QNBFS Daily Technical Trader Qatar - September 28, 2023 التحليل الفني اليومي ...
QNBFS Daily Technical Trader Qatar - September 28, 2023 التحليل الفني اليومي ...QNBFS Daily Technical Trader Qatar - September 28, 2023 التحليل الفني اليومي ...
QNBFS Daily Technical Trader Qatar - September 28, 2023 التحليل الفني اليومي ...QNB Group
 
QNBFS Daily Market Report September 24, 2023
QNBFS Daily Market Report September 24, 2023QNBFS Daily Market Report September 24, 2023
QNBFS Daily Market Report September 24, 2023QNB Group
 
QNBFS Daily Technical Trader Qatar - September 24, 2023 التحليل الفني اليومي ...
QNBFS Daily Technical Trader Qatar - September 24, 2023 التحليل الفني اليومي ...QNBFS Daily Technical Trader Qatar - September 24, 2023 التحليل الفني اليومي ...
QNBFS Daily Technical Trader Qatar - September 24, 2023 التحليل الفني اليومي ...QNB Group
 
QNBFS Daily Technical Trader Qatar - September 19, 2023 التحليل الفني اليومي ...
QNBFS Daily Technical Trader Qatar - September 19, 2023 التحليل الفني اليومي ...QNBFS Daily Technical Trader Qatar - September 19, 2023 التحليل الفني اليومي ...
QNBFS Daily Technical Trader Qatar - September 19, 2023 التحليل الفني اليومي ...QNB Group
 
QNBFS Daily Market Report September 17, 2023
QNBFS Daily Market Report September 17, 2023QNBFS Daily Market Report September 17, 2023
QNBFS Daily Market Report September 17, 2023QNB Group
 
QNBFS Weekly Market Report September 07, 2023
QNBFS Weekly Market Report September 07, 2023QNBFS Weekly Market Report September 07, 2023
QNBFS Weekly Market Report September 07, 2023QNB Group
 
QNBFS Daily Technical Trader Qatar - September 07, 2023 التحليل الفني اليومي ...
QNBFS Daily Technical Trader Qatar - September 07, 2023 التحليل الفني اليومي ...QNBFS Daily Technical Trader Qatar - September 07, 2023 التحليل الفني اليومي ...
QNBFS Daily Technical Trader Qatar - September 07, 2023 التحليل الفني اليومي ...QNB Group
 

More from QNB Group (20)

QNBFS Daily Market Report December 24, 2023
QNBFS Daily Market Report December 24, 2023QNBFS Daily Market Report December 24, 2023
QNBFS Daily Market Report December 24, 2023
 
QNBFS Daily Market Report November 29, 2023
QNBFS Daily Market Report November 29, 2023QNBFS Daily Market Report November 29, 2023
QNBFS Daily Market Report November 29, 2023
 
QNBFS Weekly Market Report November 23, 2023
QNBFS Weekly Market Report November 23, 2023QNBFS Weekly Market Report November 23, 2023
QNBFS Weekly Market Report November 23, 2023
 
QNBFS Weekly Market Report November 16, 2023
QNBFS Weekly Market Report November 16, 2023QNBFS Weekly Market Report November 16, 2023
QNBFS Weekly Market Report November 16, 2023
 
QNBFS Daily Technical Trader Qatar - November 14, 2023 التحليل الفني اليومي ل...
QNBFS Daily Technical Trader Qatar - November 14, 2023 التحليل الفني اليومي ل...QNBFS Daily Technical Trader Qatar - November 14, 2023 التحليل الفني اليومي ل...
QNBFS Daily Technical Trader Qatar - November 14, 2023 التحليل الفني اليومي ل...
 
QNBFS Daily Technical Trader Qatar - November 06, 2023 التحليل الفني اليومي ل...
QNBFS Daily Technical Trader Qatar - November 06, 2023 التحليل الفني اليومي ل...QNBFS Daily Technical Trader Qatar - November 06, 2023 التحليل الفني اليومي ل...
QNBFS Daily Technical Trader Qatar - November 06, 2023 التحليل الفني اليومي ل...
 
QNBFS Daily Market Report October 30, 2023
QNBFS Daily Market Report October 30, 2023QNBFS Daily Market Report October 30, 2023
QNBFS Daily Market Report October 30, 2023
 
QNBFS Daily Technical Trader Qatar - October 25, 2023 التحليل الفني اليومي لب...
QNBFS Daily Technical Trader Qatar - October 25, 2023 التحليل الفني اليومي لب...QNBFS Daily Technical Trader Qatar - October 25, 2023 التحليل الفني اليومي لب...
QNBFS Daily Technical Trader Qatar - October 25, 2023 التحليل الفني اليومي لب...
 
QNBFS Daily Technical Trader Qatar - October 10, 2023 التحليل الفني اليومي لب...
QNBFS Daily Technical Trader Qatar - October 10, 2023 التحليل الفني اليومي لب...QNBFS Daily Technical Trader Qatar - October 10, 2023 التحليل الفني اليومي لب...
QNBFS Daily Technical Trader Qatar - October 10, 2023 التحليل الفني اليومي لب...
 
QNBFS Daily Technical Trader Qatar - October 11, 2023 التحليل الفني اليومي لب...
QNBFS Daily Technical Trader Qatar - October 11, 2023 التحليل الفني اليومي لب...QNBFS Daily Technical Trader Qatar - October 11, 2023 التحليل الفني اليومي لب...
QNBFS Daily Technical Trader Qatar - October 11, 2023 التحليل الفني اليومي لب...
 
QNBFS Daily Technical Trader Qatar - October 10, 2023 التحليل الفني اليومي لب...
QNBFS Daily Technical Trader Qatar - October 10, 2023 التحليل الفني اليومي لب...QNBFS Daily Technical Trader Qatar - October 10, 2023 التحليل الفني اليومي لب...
QNBFS Daily Technical Trader Qatar - October 10, 2023 التحليل الفني اليومي لب...
 
QNBFS Daily Market Report October 04, 2023
QNBFS Daily Market Report October 04, 2023QNBFS Daily Market Report October 04, 2023
QNBFS Daily Market Report October 04, 2023
 
QNBFS Daily Technical Trader Qatar - October 04, 2023 التحليل الفني اليومي لب...
QNBFS Daily Technical Trader Qatar - October 04, 2023 التحليل الفني اليومي لب...QNBFS Daily Technical Trader Qatar - October 04, 2023 التحليل الفني اليومي لب...
QNBFS Daily Technical Trader Qatar - October 04, 2023 التحليل الفني اليومي لب...
 
QNBFS Daily Technical Trader Qatar - September 28, 2023 التحليل الفني اليومي ...
QNBFS Daily Technical Trader Qatar - September 28, 2023 التحليل الفني اليومي ...QNBFS Daily Technical Trader Qatar - September 28, 2023 التحليل الفني اليومي ...
QNBFS Daily Technical Trader Qatar - September 28, 2023 التحليل الفني اليومي ...
 
QNBFS Daily Market Report September 24, 2023
QNBFS Daily Market Report September 24, 2023QNBFS Daily Market Report September 24, 2023
QNBFS Daily Market Report September 24, 2023
 
QNBFS Daily Technical Trader Qatar - September 24, 2023 التحليل الفني اليومي ...
QNBFS Daily Technical Trader Qatar - September 24, 2023 التحليل الفني اليومي ...QNBFS Daily Technical Trader Qatar - September 24, 2023 التحليل الفني اليومي ...
QNBFS Daily Technical Trader Qatar - September 24, 2023 التحليل الفني اليومي ...
 
QNBFS Daily Technical Trader Qatar - September 19, 2023 التحليل الفني اليومي ...
QNBFS Daily Technical Trader Qatar - September 19, 2023 التحليل الفني اليومي ...QNBFS Daily Technical Trader Qatar - September 19, 2023 التحليل الفني اليومي ...
QNBFS Daily Technical Trader Qatar - September 19, 2023 التحليل الفني اليومي ...
 
QNBFS Daily Market Report September 17, 2023
QNBFS Daily Market Report September 17, 2023QNBFS Daily Market Report September 17, 2023
QNBFS Daily Market Report September 17, 2023
 
QNBFS Weekly Market Report September 07, 2023
QNBFS Weekly Market Report September 07, 2023QNBFS Weekly Market Report September 07, 2023
QNBFS Weekly Market Report September 07, 2023
 
QNBFS Daily Technical Trader Qatar - September 07, 2023 التحليل الفني اليومي ...
QNBFS Daily Technical Trader Qatar - September 07, 2023 التحليل الفني اليومي ...QNBFS Daily Technical Trader Qatar - September 07, 2023 التحليل الفني اليومي ...
QNBFS Daily Technical Trader Qatar - September 07, 2023 التحليل الفني اليومي ...
 

Recently uploaded

Independent Lucknow Call Girls 8923113531WhatsApp Lucknow Call Girls make you...
Independent Lucknow Call Girls 8923113531WhatsApp Lucknow Call Girls make you...Independent Lucknow Call Girls 8923113531WhatsApp Lucknow Call Girls make you...
Independent Lucknow Call Girls 8923113531WhatsApp Lucknow Call Girls make you...makika9823
 
Andheri Call Girls In 9825968104 Mumbai Hot Models
Andheri Call Girls In 9825968104 Mumbai Hot ModelsAndheri Call Girls In 9825968104 Mumbai Hot Models
Andheri Call Girls In 9825968104 Mumbai Hot Modelshematsharma006
 
Bladex Earnings Call Presentation 1Q2024
Bladex Earnings Call Presentation 1Q2024Bladex Earnings Call Presentation 1Q2024
Bladex Earnings Call Presentation 1Q2024Bladex
 
20240417-Calibre-April-2024-Investor-Presentation.pdf
20240417-Calibre-April-2024-Investor-Presentation.pdf20240417-Calibre-April-2024-Investor-Presentation.pdf
20240417-Calibre-April-2024-Investor-Presentation.pdfAdnet Communications
 
(办理学位证)加拿大萨省大学毕业证成绩单原版一比一
(办理学位证)加拿大萨省大学毕业证成绩单原版一比一(办理学位证)加拿大萨省大学毕业证成绩单原版一比一
(办理学位证)加拿大萨省大学毕业证成绩单原版一比一S SDS
 
Governor Olli Rehn: Dialling back monetary restraint
Governor Olli Rehn: Dialling back monetary restraintGovernor Olli Rehn: Dialling back monetary restraint
Governor Olli Rehn: Dialling back monetary restraintSuomen Pankki
 
How Automation is Driving Efficiency Through the Last Mile of Reporting
How Automation is Driving Efficiency Through the Last Mile of ReportingHow Automation is Driving Efficiency Through the Last Mile of Reporting
How Automation is Driving Efficiency Through the Last Mile of ReportingAggregage
 
BPPG response - Options for Defined Benefit schemes - 19Apr24.pdf
BPPG response - Options for Defined Benefit schemes - 19Apr24.pdfBPPG response - Options for Defined Benefit schemes - 19Apr24.pdf
BPPG response - Options for Defined Benefit schemes - 19Apr24.pdfHenry Tapper
 
Lundin Gold April 2024 Corporate Presentation v4.pdf
Lundin Gold April 2024 Corporate Presentation v4.pdfLundin Gold April 2024 Corporate Presentation v4.pdf
Lundin Gold April 2024 Corporate Presentation v4.pdfAdnet Communications
 
VIP Kolkata Call Girl Jodhpur Park 👉 8250192130 Available With Room
VIP Kolkata Call Girl Jodhpur Park 👉 8250192130  Available With RoomVIP Kolkata Call Girl Jodhpur Park 👉 8250192130  Available With Room
VIP Kolkata Call Girl Jodhpur Park 👉 8250192130 Available With Roomdivyansh0kumar0
 
Bladex 1Q24 Earning Results Presentation
Bladex 1Q24 Earning Results PresentationBladex 1Q24 Earning Results Presentation
Bladex 1Q24 Earning Results PresentationBladex
 
Call Girls Near Me WhatsApp:+91-9833363713
Call Girls Near Me WhatsApp:+91-9833363713Call Girls Near Me WhatsApp:+91-9833363713
Call Girls Near Me WhatsApp:+91-9833363713Sonam Pathan
 
VIP Kolkata Call Girl Serampore 👉 8250192130 Available With Room
VIP Kolkata Call Girl Serampore 👉 8250192130  Available With RoomVIP Kolkata Call Girl Serampore 👉 8250192130  Available With Room
VIP Kolkata Call Girl Serampore 👉 8250192130 Available With Roomdivyansh0kumar0
 
OAT_RI_Ep19 WeighingTheRisks_Apr24_TheYellowMetal.pptx
OAT_RI_Ep19 WeighingTheRisks_Apr24_TheYellowMetal.pptxOAT_RI_Ep19 WeighingTheRisks_Apr24_TheYellowMetal.pptx
OAT_RI_Ep19 WeighingTheRisks_Apr24_TheYellowMetal.pptxhiddenlevers
 
chapter_2.ppt The labour market definitions and trends
chapter_2.ppt The labour market definitions and trendschapter_2.ppt The labour market definitions and trends
chapter_2.ppt The labour market definitions and trendslemlemtesfaye192
 
Russian Call Girls In Gtb Nagar (Delhi) 9711199012 💋✔💕😘 Naughty Call Girls Se...
Russian Call Girls In Gtb Nagar (Delhi) 9711199012 💋✔💕😘 Naughty Call Girls Se...Russian Call Girls In Gtb Nagar (Delhi) 9711199012 💋✔💕😘 Naughty Call Girls Se...
Russian Call Girls In Gtb Nagar (Delhi) 9711199012 💋✔💕😘 Naughty Call Girls Se...shivangimorya083
 
government_intervention_in_business_ownership[1].pdf
government_intervention_in_business_ownership[1].pdfgovernment_intervention_in_business_ownership[1].pdf
government_intervention_in_business_ownership[1].pdfshaunmashale756
 
Call Girls In Yusuf Sarai Women Seeking Men 9654467111
Call Girls In Yusuf Sarai Women Seeking Men 9654467111Call Girls In Yusuf Sarai Women Seeking Men 9654467111
Call Girls In Yusuf Sarai Women Seeking Men 9654467111Sapana Sha
 

Recently uploaded (20)

Independent Lucknow Call Girls 8923113531WhatsApp Lucknow Call Girls make you...
Independent Lucknow Call Girls 8923113531WhatsApp Lucknow Call Girls make you...Independent Lucknow Call Girls 8923113531WhatsApp Lucknow Call Girls make you...
Independent Lucknow Call Girls 8923113531WhatsApp Lucknow Call Girls make you...
 
Andheri Call Girls In 9825968104 Mumbai Hot Models
Andheri Call Girls In 9825968104 Mumbai Hot ModelsAndheri Call Girls In 9825968104 Mumbai Hot Models
Andheri Call Girls In 9825968104 Mumbai Hot Models
 
Bladex Earnings Call Presentation 1Q2024
Bladex Earnings Call Presentation 1Q2024Bladex Earnings Call Presentation 1Q2024
Bladex Earnings Call Presentation 1Q2024
 
20240417-Calibre-April-2024-Investor-Presentation.pdf
20240417-Calibre-April-2024-Investor-Presentation.pdf20240417-Calibre-April-2024-Investor-Presentation.pdf
20240417-Calibre-April-2024-Investor-Presentation.pdf
 
(办理学位证)加拿大萨省大学毕业证成绩单原版一比一
(办理学位证)加拿大萨省大学毕业证成绩单原版一比一(办理学位证)加拿大萨省大学毕业证成绩单原版一比一
(办理学位证)加拿大萨省大学毕业证成绩单原版一比一
 
Governor Olli Rehn: Dialling back monetary restraint
Governor Olli Rehn: Dialling back monetary restraintGovernor Olli Rehn: Dialling back monetary restraint
Governor Olli Rehn: Dialling back monetary restraint
 
How Automation is Driving Efficiency Through the Last Mile of Reporting
How Automation is Driving Efficiency Through the Last Mile of ReportingHow Automation is Driving Efficiency Through the Last Mile of Reporting
How Automation is Driving Efficiency Through the Last Mile of Reporting
 
BPPG response - Options for Defined Benefit schemes - 19Apr24.pdf
BPPG response - Options for Defined Benefit schemes - 19Apr24.pdfBPPG response - Options for Defined Benefit schemes - 19Apr24.pdf
BPPG response - Options for Defined Benefit schemes - 19Apr24.pdf
 
Lundin Gold April 2024 Corporate Presentation v4.pdf
Lundin Gold April 2024 Corporate Presentation v4.pdfLundin Gold April 2024 Corporate Presentation v4.pdf
Lundin Gold April 2024 Corporate Presentation v4.pdf
 
VIP Kolkata Call Girl Jodhpur Park 👉 8250192130 Available With Room
VIP Kolkata Call Girl Jodhpur Park 👉 8250192130  Available With RoomVIP Kolkata Call Girl Jodhpur Park 👉 8250192130  Available With Room
VIP Kolkata Call Girl Jodhpur Park 👉 8250192130 Available With Room
 
Bladex 1Q24 Earning Results Presentation
Bladex 1Q24 Earning Results PresentationBladex 1Q24 Earning Results Presentation
Bladex 1Q24 Earning Results Presentation
 
Call Girls Near Me WhatsApp:+91-9833363713
Call Girls Near Me WhatsApp:+91-9833363713Call Girls Near Me WhatsApp:+91-9833363713
Call Girls Near Me WhatsApp:+91-9833363713
 
🔝+919953056974 🔝young Delhi Escort service Pusa Road
🔝+919953056974 🔝young Delhi Escort service Pusa Road🔝+919953056974 🔝young Delhi Escort service Pusa Road
🔝+919953056974 🔝young Delhi Escort service Pusa Road
 
VIP Kolkata Call Girl Serampore 👉 8250192130 Available With Room
VIP Kolkata Call Girl Serampore 👉 8250192130  Available With RoomVIP Kolkata Call Girl Serampore 👉 8250192130  Available With Room
VIP Kolkata Call Girl Serampore 👉 8250192130 Available With Room
 
OAT_RI_Ep19 WeighingTheRisks_Apr24_TheYellowMetal.pptx
OAT_RI_Ep19 WeighingTheRisks_Apr24_TheYellowMetal.pptxOAT_RI_Ep19 WeighingTheRisks_Apr24_TheYellowMetal.pptx
OAT_RI_Ep19 WeighingTheRisks_Apr24_TheYellowMetal.pptx
 
chapter_2.ppt The labour market definitions and trends
chapter_2.ppt The labour market definitions and trendschapter_2.ppt The labour market definitions and trends
chapter_2.ppt The labour market definitions and trends
 
Russian Call Girls In Gtb Nagar (Delhi) 9711199012 💋✔💕😘 Naughty Call Girls Se...
Russian Call Girls In Gtb Nagar (Delhi) 9711199012 💋✔💕😘 Naughty Call Girls Se...Russian Call Girls In Gtb Nagar (Delhi) 9711199012 💋✔💕😘 Naughty Call Girls Se...
Russian Call Girls In Gtb Nagar (Delhi) 9711199012 💋✔💕😘 Naughty Call Girls Se...
 
Monthly Economic Monitoring of Ukraine No 231, April 2024
Monthly Economic Monitoring of Ukraine No 231, April 2024Monthly Economic Monitoring of Ukraine No 231, April 2024
Monthly Economic Monitoring of Ukraine No 231, April 2024
 
government_intervention_in_business_ownership[1].pdf
government_intervention_in_business_ownership[1].pdfgovernment_intervention_in_business_ownership[1].pdf
government_intervention_in_business_ownership[1].pdf
 
Call Girls In Yusuf Sarai Women Seeking Men 9654467111
Call Girls In Yusuf Sarai Women Seeking Men 9654467111Call Girls In Yusuf Sarai Women Seeking Men 9654467111
Call Girls In Yusuf Sarai Women Seeking Men 9654467111
 

QNBFS Weekly Market Report July 29, 2020

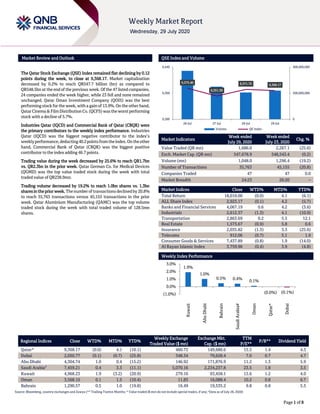
  • 1. ````` Page 1 of 8 Market Review and Outlook QSE Index and Volume The Qatar Stock Exchange (QSE) Index remained flat declining by 0.12 points during the week, to close at 9,368.17. Market capitalization decreased by 0.2% to reach QR547.7 billion (bn) as compared to QR548.5bn at the end of the previous week. Of the 47 listed companies, 24 companies ended the week higher, while 23 fell and none remained unchanged. Qatar Oman Investment Company (QOIS) was the best performing stock for the week, with a gain of 13.9%. On the other hand, QatarCinema &FilmDistributionCo. (QCFS) was the worst performing stock with a decline of 5.7%. Industries Qatar (IQCD) and Commercial Bank of Qatar (CBQK) were the primary contributors to the weekly index performance. Industries Qatar (IQCD) was the biggest negative contributor to the index’s weeklyperformance,deducting40.2pointsfromtheindex.Ontheother hand, Commercial Bank of Qatar (CBQK) was the biggest positive contributor to the index adding 46.7 points. Trading value during the week decreased by 25.6% to reach QR1.7bn vs. QR2.3bn in the prior week. Qatar German Co. for Medical Devices (QGMD) was the top value traded stock during the week with total traded value of QR238.9mn. Trading volume decreased by 19.2% to reach 1.0bn shares vs. 1.3bn shares in the prior week. The numberof transactions declinedby 20.8% to reach 35,763 transactions versus 45,155 transactions in the prior week. Qatar Aluminium Manufacturing (QAMC) was the top volume traded stock during the week with total traded volume of 128.5mn shares. Market Indicators Week ended July 29, 2020 Week ended July 23, 2020 Chg. % Value Traded (QR mn) 1,686.0 2,267.1 (25.6) Exch. Market Cap. (QR mn) 547,678.9 548,543.4 (0.2) Volume (mn) 1,048.0 1,296.4 (19.2) Number of Transactions 35,763 45,155 (20.8) Companies Traded 47 47 0.0 Market Breadth 24:23 26:20 – Market Indices Close WTD% MTD% YTD% Total Return 18,010.00 (0.0) 4.1 (6.1) ALL Share Index 2,923.17 (0.1) 4.2 (5.7) Banks and Financial Services 4,067.19 0.6 4.2 (3.6) Industrials 2,612.37 (1.3) 4.1 (10.9) Transportation 2,863.69 0.2 5.5 12.1 Real Estate 1,573.67 (0.9) 5.8 0.6 Insurance 2,035.82 (1.3) 3.3 (25.6) Telecoms 912.06 (0.7) 5.1 1.9 Consumer Goods & Services 7,437.89 (0.8) 1.9 (14.0) Al Rayan Islamic Index 3,759.96 (0.4) 3.9 (4.8) Weekly Index Performance Regional Indices Close WTD% MTD% YTD% Weekly Exchange Traded Value ($ mn) Exchange Mkt. Cap. ($ mn) TTM P/E** P/B** Dividend Yield Qatar* 9,368.17 (0.0) 4.1 (10.1) 460.73 149,680.6 15.3 1.4 4.3 Dubai 2,050.77 (0.1) (0.7) (25.8) 348.34 79,628.4 7.0 0.7 4.7 Abu Dhabi 4,304.74 1.0 0.4 (15.2) 146.92 171,876.9 11.2 1.3 5.9 Saudi Arabia# 7,459.21 0.4 3.3 (11.1) 5,070.16 2,234,237.8 23.5 1.8 3.5 Kuwait 4,968.23 1.9 (3.2) (20.9) 279.16 93,458.1 15.6 1.2 4.0 Oman 3,568.10 0.1 1.5 (10.4) 11.83 16,088.4 10.2 0.8 6.7 Bahrain 1,290.57 0.5 1.0 (19.8) 16.49 19,535.2 9.8 0.8 5.5 Source: Bloomberg, country exchanges and Zawya (** Trailing Twelve Months; * Value traded ($ mn) do not include special trades, if any; #Data as of July 28, 2020) 9,375.40 9,351.36 9,371.75 9,368.17 0 200,000,000 400,000,000 9,280 9,360 9,440 26-Jul 27-Jul 28-Jul 29-Jul Volume QE Index 1.9% 1.0% 0.5% 0.4% 0.1% (0.0%) (0.1%)(1.0%) 0.0% 1.0% 2.0% 3.0% Kuwait AbuDhabi Bahrain SaudiArabia# Oman Qatar* Dubai
  • 2. Page 2 of 8 News Economic /Corporate News  Qatar interested in hosting Olympics, as early as 2032 – Qatar Olympic Committee (QOC) announced on Monday it has formally submitted to the International Olympic Committee (IOC) its request to join the non-committal “Continuous Dialogue” to host a future edition of the Olympic and Paralympic Games, as early as 2032. Qatar delivered the request via an official letter to the IOC's headquarters in Lausanne, Switzerland. Commenting on the announcement, QOC’s President, HE Sheikh Joaan bin Hamad bin Khalifa Al-Thani said, “Never before has an Olympic Games been held in the Middle East. The Olympic rings are a symbol of peace, unity and hope for people around the world, including the people of our region. Today's announcement marks the beginning of a meaningful dialogue with the IOC's Future Host Commission to explore our interest further and identify how the Olympic Games can support Qatar's long-term development goals.” (Gulf-Times.com)  Al-Baker: Qatar set to offer massive tourism infrastructure investments – Qatar will have massive tourism infrastructure investments that will be on offer, according to Qatar Airways Group’s Chief Executive, and Secretary-General of Qatar National Tourism Council, HE Akbar Al-Baker. “It is an invitation to any investor who wants to come to Qatar and invest. We guarantee tax exemptions. We guarantee repatriation of profits. We guarantee their investments. Qatar has a very friendly business regime in place. And it is exactly what investors look at. So, as Qatar has such big plans to expand its tourism sector, there are many opportunities that will be available,” Al-Baker noted. On how Qatar is ready to deliver the 'best ever' FIFA World Cup tournament in 2022, he said, “Qatar is very much on the delivery of the FIFA 2022. We also want to deliver the best tournament ever happened in the world. You know several of our stadiums are already ready. (Gulf- Times.com)  Moody's: Qatar among top 10 emerging market sovereign issuers in 1H2020 – Qatar is among the 'top 10' emerging market (EM) sovereign issuers in 1H2020, with issuances totaling $10bn, according to Moody's Investors Service (Moody's). Investment-grade Middle East sovereigns accounted for $32bn of issuance in the first half of the year, Moody's said in its ‘Global Emerging Market Issuance Report’ issued on Thursday. Middle East countries accounted for 34% of EM sovereign issuance in 1H2020, as governments in the region turned to market issuance to cushion the impact of the coronavirus and oil price slide and fund counter-cyclical spending, it said. “This further reinforces the region’srising dominance of EM sovereign issuance. By contrast, Sub Saharan African Eurobond issuance has largely dried up, and a major revival in market borrowing is unlikely given that many countries in the region are facing acute external stress,” Moody’s noted. Despite enduring the temporary market shutdown in March, EM Eurobond issuance is running at a record rate, with volumes reaching $343bn in the first six months of 2020. Full-year issuance is on course to test all-time highs, as highly rated governments and companies take advantage of normalizing financial conditions to raise fresh funding and refinance existing obligations with longer maturities. That said, not all issuers will benefit from more favorable conditions. For those lower-down the credit quality spectrum, access to international capital markets is likely to remain challenging. While lower than last year, EM corporate deal flow is picking up. Investment-grade issuance has emerged largely unscathed from market turbulence in March and April, but high-yield segment has yet to fully recover. Oil and gas represented the largest-issuing sector in 1H2020 (26% of total), overtaking real estate and property for the first time since 2017. Many national oil companies have retained strong access to capital given their strategic importance to respective governments, Moody’s noted. Corporate bond issuance growth, it said is unlikely to accelerate materially in 2H2020 given the precarious investment outlook in most sectors, although a further pick-up in China property sales would underpin additional bond supply. (Gulf-Times.com)  CBQK posts 1.9% YoY decrease but 24.1% QoQ increase in net profit in 2Q2020, above our estimate – The Commercial Bank's (CBQK) net profit declined 1.9% YoY (but rose 24.1% on QoQ basis) to QR499.0mn in 2Q2020, above our estimate of QR456.2mn (variation of +9.4%). Net interest income increased 19.6% YoY in 2Q2020 to QR762.1mn. However, on QoQ basis Net interest income declined 5.8%. The bank’s net operating income came in at QR1,090.2mn in 2Q2020, which represents an increase of 15.1% YoY (+20.2% QoQ). EPS amounted to QR0.22 in 2Q2020 as compared to QR0.13 in 2Q2019 (1Q2020: QR0.10). The bank's total assets stood at QR143.7bn at the end of June 30, 2020, up 1.8% YoY. However, on QoQ basis the bank's total assets decreased 1.9%. Loans and advances to customers were QR87.0bn, registering a rise of 1.5% YoY at the end of June 30, 2020. However, on QoQ basis Loans and advances to customers decreased 2.0%. Customer deposits rose 0.4% both YoY and QoQ to reach QR77.7bn at the end of June 30, 2020. The Group’s investment securities increased by 14.1% to QR26.8bn in 1H2020 compared with QR23.5bn in 1H2019. The increase is mainly in Government bonds. In 1H2020, CBQK posted net profit of QR901.2mn as compared to QR948.2mn for the same period in 2019. Key financial highlights for the Group compared to the same period in 2019:– Operating profit of QR1,527.2mn, up by 17.9%. Cost to income ratio of 23.5% (normalized 26.5%), reduced from 29.9%. Gross loan provisions of QR530.9mn, up by 3.5% due to COVID-19 related model increases in ECL. This was offset by strong recoveries resulting in net provisions on loans and advances to customers at QR225.2mn, down by 48.1%. Operating profit for the Group increased by 17.9% to QR1,527.2mn for the half year ended June 30, 2020, compared to QR1,294.9mn achieved in the same period in 2019. Net interest income for the Group increased by 28.0% to QR1,558.8mn on a normalized basis for the half year ended June 30, 2020 compared to QR1,217.9mn achieved in the same period in 2019. Net interest margin increased to 2.4% for the half year ended June 30, 2020 compared to 2.0% achieved in the same period in 2019.
  • 3. Page 3 of 8 Although asset yields have reduced, the increase in margins is mainly due to proactive management of the cost of funding both in Qatar as well as Turkey. Non-interest income for the Group decreased by 17.4% to QR519.3mn on a normalized basis for the half year ended June 30, 2020 compared with QR628.8mn achieved in the same period in 2019. The overall decrease in non-interest income was mainly due to an adverse unrealized mark to market movement in investment and trading income as a result of the unprecedented volatility in the global markets. Total operating expenses reduced by 0.1% to QR550.9mn on a normalized basis for the half year ended June 30, 2020 compared with QR551.7mn in the same period in 2019. The Group’s net provisions for loans and advances decreased by 48.1% to QR225.2mn for the half year ended June 30, 2020, from QR433.7 million in the same period in 2019. The nonperforming loan (NPL) ratio increased marginally to 5.0% in H1 2020 compared to 4.9% in H1 2019. The loan coverage ratio was at 90.0% in H1 2020. The reduction in net provisions is due to strong recoveries in H1 2020. The underlying ECL provisions have increased due to the COVID 19 impact. (QNB FS Research, QSE, Company Press Release)  IQCD’s 2Q2020 Earnings Grow QoQ & Exceed Estimates Ex. Items; Market Perform - IQCD posts QR333.6mn in 2Q2020 earnings, excluding one-offs, down 57.5% YoY but up 63.7% QoQ – Normalized earnings were 8.8% higher than our estimate of QR306.7mn. Reported earnings of QR281.5mn included the impact of QR52.1mn in one-off non-cash expenses. These one- off expenses included: 1) an impairment charge of QR1.22bn related to mothballing of certain steel facilities (domestic rebar capacity lowered to 0.8MTPA from 1.5MTPA previously), which was partially offset by 2) QR1.17bn in fair value gain on revaluation of IQCD’s 75% stake in QAFCO given QP’s recent acquisition of Yara’s 25% stake in QAFCO. IQCD remains tax- exempt; the reporting of income taxes in IQCD’s income statement do not reflect any economic change but rather a reporting (accounting) change – Reported earnings included QR162.9mn in current and deferred income taxes. However, investors should note that IQCD remains tax-exempt with reported taxes on its share of earnings of JVs/subsidiaries being offset as other income in its income statement. This current accounting treatment for taxes formalizes the MOU between QP, the Ministry of Finance and the General Tax Authority. The reporting change for income taxes does not have any economic impact on IQCD. Another accounting change introduced is that IQCD is now recognizing QAFCO as a subsidiary (vs. a 75%- owned JV previously) and is now consolidating all revenue/expenses for QAFCO and netting out QP’s 25% stake as minority interest. Given QP’s recent purchase of Yara’s 25% stake in QAFCO, IQCD believes it has a de-facto control over QAFCO, with effect from January 1, allowing IQCD to account for QAFCO as a subsidiary. According to IQCD, ~5% lower ASPs YoY dented net income by roughly QR0.7bn in 1H2020. Petchems made up ~QR0.5bn of this decline and fertilizers contributed ~QR0.2bn. Overall sales volumes declined by 29% vs. 1H2019 due to weaker demand, lower production given mothballing of steel facilities and periodic planned/unplanned maintenance. Fertilizer sales volume also declined as QAFCO cannot recognize sales from QAFCO 1-4 under the interim gas processing agreement until a permanent agreement is put in place. Group revenue of QR4.9bn declined 26% YoY from QR6.7bn in 1H2019. Besides the previously mentioned mothballing of steel facilities, there were no demand-driven stoppage of production with 1H2020 production volume coming in at 7MT, down 14% YoY. There was a planned shutdown of the MTBE facility for a short period in 2Q2020, which had immaterial impact on overall results. Relative to 1Q2020, 2Q2020 overall revenue declined ~37% driven by lower prices and volumes. 2Q2020 net income benefited QoQ due to reduced operating costs given lower production and costs optimization initiatives. (QNB FS Research, Company Press Release, QSE)  DHBK's net profit declines 16.3% YoY and 45.5% QoQ in 2Q2020, below our estimate – Doha Bank's (DHBK) net profit declined 16.3% YoY (-45.5% QoQ) to QR176.6mn in 2Q2020, below our estimate of QR218.0mn (variation of -19.0%). Net interest income increased 11.6% YoY in 2Q2020 to QR523.5mn. However, on QoQ basis net interest income declined 4.5%. The company's net operating income came in at QR679.5mn in 2Q2020, which represents an increase of 3.6% YoY. However, on QoQ basis net operating income fell 9.3%. EPS amounted to QR0.06 in 2Q2020 as compared to QR0.07 in 2Q2019 (1Q2020: QR0.10). The bank's total assets stood at QR108.0bn at the end of June 30, 2020, up 7.2% YoY (+1.5% QoQ). Loans and advances to customers were QR62.5bn, registering a rise of 2.6% YoY at the end of June 30, 2020. However, on QoQ basis loans and advances to customers decreased 4.4%. Customer deposits rose 0.7% YoY and 2.2% QoQ to reach QR56.0bn at the end of June 30, 2020. In 1H2020, DHBK reported net profit of QR500.7mn compared to QR518.6mn for the same period of the previous year. DHBK’s Chairman, Sheikh Fahad bin Mohamed bin Jabor Al-Thani said the bank made significant progress in improving the cost management and efficient utilization of resources, whereby the operating cost for the period decreased by 2.2% as compared to the same period last year, thus reducing the cost to income ratio to 31.4% from 35.5%, showing bank’s productive operational performance. The chairman also pointed out that the total financial investment portfolio increased by QR1.2bn, showing a significant growth of 4.6% as compared to the same period of the last year. DHBK’s Managing Director, Sheikh Abdul Rehman bin Mohamed bin Jabor Al-Thani said, “The total shareholder’s equity stood at QR13.3bn as on June 30 this year, registering a growth of 0.2%. The bank continued to strengthen its key capitalization ratios, where the total capital adequacy ratio of the bank increased to 17.6% in June from 17.4% as compared to the same period last year. The bank, given the scale of its operations, has achieved a return on the average assets of 0.93% as on June 30, 2020”. (QNB FS Research, QSE, Gulf- Times.com)  VFQS' net profit declines 3.9% YoY and 30.7% QoQ in 2Q2020, below our estimate – Vodafone Qatar's (VFQS) net profit declined 3.9% YoY (-30.7% QoQ) to QR33.2mn in 2Q2020, below our estimate of QR51.4mn (variation of -35.4%). The company's Revenue came in at QR531.5mn in 2Q2020, which represents an increase of 0.8% YoY. However, on QoQ basis Revenue fell 1.7%. In 1H2020, VFQS reported net profit of QR81.1mn compared to net profit amounting to QR78.1mn for the same period of the previous year. EPS amounted to QR0.019 in 1H2020 as compared to QR0.018 in 1H2019. Service revenue grew by 3.4% to reach QR1bn while total revenue increased by 1% to
  • 4. Page 4 of 8 QR1.1bn, driven by the continued growth in postpaid and higher home broadband revenue, VFQS announced. EBITDA (earnings before interest, taxes, depreciation, and amortization) for the period stood at QR390mn; representing a strong improvement of 9% YoY, positively impacted by higher service revenue, continued cost optimization initiatives, lower equipment cost and the reduction in mobile termination rates. EBITDA margin further has improved by 2.6 percentage points to reach 36.3% in 1H2020. In response to the coronavirus pandemic, VFQS was quick to activate its business continuity measures, which has proved vital in minimizing operational disruptions. The company has continued to fully deliver services and products to all of its customers, thereby facilitating remote work, learning and other digital needs. VFQS has remained focused on executing its defined strategy to support the continuation of the current growth trajectory of the company. This includes expanding its ‘GigaNet’ network by accelerating the deployment of fiber and 5G in several strategic locations across the country. (QNB FS Research, QSE, Gulf-Times.com)  ORDS' bottom line rises 2.6% YoY and 11.6% QoQ in 2Q2020 – Ooredoo's (ORDS) net profit rose 2.6% YoY (+11.6% QoQ) to QR431.7mn in 2Q2020.The company's Revenue came in at QR6,822.8mn in 2Q2020, which represents a decrease of 6.7% YoY (-6.5% QoQ). EPS remained flat YoY at QR0.13 in 2Q2020 (1Q2020: QR0.12). In 1H2020, ORDS posted net profit of QR818.5mn compared to net profit amounting to QR841.2mn for the same period of the previous year. EPS remained flat YoY at QR0.26 in 1H2020. ORDS Group announced half yearly revenue of QR14.1bn, declined by 3% YoY due to the COVID-19 impact. A reduction in handset sales and roaming business as well as macroeconomic weakness in some of Ooredoo’s markets was partially offset by robust growth in Indonesia, Tunisia and Myanmar. EBITDA declined by 5% YoY to QR6bn, impacted by movement restrictions to contain the spread of COVID-19 in its markets as well as challenging market conditions in Algeria, Kuwait, Iraq and Oman. Group net profit attributable to shareholders has declined by 3% YoY to QR818.5mn in 1H2020, due to the reduction in EBITDA, which was partially offset by a more favorable foreign exchange environment compared to the same period last year. Data revenues account for more than 50% of total revenue driven by Ooredoo’s “data leadership and digital transformation initiatives across the countries we operate in.” ORDS Group said it has healthy cash reserve and liquidity levels to be able to absorb the impact of COVID-19 for 2020. In terms of COVID-19 response, it said it “remained sharply focused on mitigating the impact of COVID-19 during 2Q2020.” On the results, Sheikh Saud bin Nasser Al-Thani, Group CEO, said, “In our home market of Qatar, our post-paid customer base crossed the half-a-million mark and the 5G plans launched in December attracted over 200,000 customers already. In Kuwait and Oman, we have partnered with the respective Ministry of Education to launch e-learning platforms from home for the upcoming school year 2020–2021. With digitalization at our core, we continue to invest in new products and services to power the future of connectivity. In Oman we launched 5G Home Internet which enables customers to experience connectivity up to 10 times faster than the current home Internet services, while bringing high speed Internet access to new areas of the country, and in Algeria we continue to operate the fastest 4G network in the country spanning all 48 Wilayas.” Ooredoo Qatar has seen its customer numbers going up 1.3% YoY to 3.4mn in June, the company announced. (QSE, Gulf-Times.com)  BRES' bottom line rises ~331% YoY and ~131% QoQ in 2Q2020 – Barwa Real Estate Company's (BRES) net profit rose ~331% YoY (+~131% QoQ) to ~QR409mn in 2Q2020. 1H2020, BRES posted net profit of QR586mn, compared to a net profit of QR510mn for the same period of the previous year. EPS amounted to QR0.15 in 1H2020 as compared to QR0.13 in 1H2019. (QSE)
  • 5. Page 5 of 8 Qatar Stock Exchange Top Gainers Top Decliners Source: Qatar Stock Exchange (QSE) Source: Qatar Stock Exchange (QSE) Most Active Shares by Value (QR Million) Most Active Shares by Volume (Million) Source: Qatar Stock Exchange (QSE) Source: Qatar Stock Exchange (QSE) 13.9% 9.6% 8.7% 7.5% 7.3% 0.0% 5.0% 10.0% 15.0% Qatar Oman Investment Company Qatari German Company for Medical Devices The Commercial Bank Baladna Qatar First Bank -5.7% -4.2% -4.0% -3.9% -3.5% -7.5% -5.0% -2.5% 0.0% Qatar Cinema & Film Distribution Company Islamic Holding Group Industries Qatar Mannai Corporation Vodafone Qatar 238.9 112.4 99.4 93.1 88.0 0.0 100.0 200.0 300.0 Qatari German Company for Medical Devices Qatar Aluminium Manufacturing Company QNB Group Dlala Brokerage & Investment Holding Company Baladna 128.5 100.9 98.0 92.9 83.9 0.0 50.0 100.0 150.0 Qatar Aluminium Manufacturing Company Qatari German Company for Medical Devices Qatar Oman Investment Company Salam International Investment Limited Alijarah Holding
  • 6. Page 6 of 8 TECHNICAL ANALYSIS OF THE QSE INDEX Source: Bloomberg The QSE Index closed flattish, from the week before and finished at the 9,368.17 level. The Index bounced off the corrective uptrend channel, but it remains below its 200-day moving average; it should move above that level before the index becomes positive in the medium term. The general index needs to remain above the 9,000 to hold its ground. DEFINITIONS OF KEY TERMS USED IN TECHNICAL ANALYSIS RSI (Relative Strength Index) indicator – RSI is a momentum oscillator that measures the speedand change of price movements. The RSI oscillates between 0 to 100. The index is deemed to be overbought once the RSI approaches the 70 level, indicating that a correction is likely. On the other hand, if the RSI approaches 30, it is an indication that the index may be getting oversold and therefore likely to bounce back. MACD (Moving Average Convergence Divergence) indicator – The indicator consists of the MACD line and a signal line. The divergence or the convergence of the MACD line with the signal line indicates the strength in the momentum during the uptrend or downtrend, as the case may be. When the MACD crosses the signal line from below and trades above it, it gives a positive indication. The reverse is the situation for a bearish trend. Candlestick chart – A candlestick chart is a price chart that displays the high, low, open, and close for a security. The ‘body’ of the chart is portion between the open and close price, while the high and low intraday movements form the ‘shadow’. The candlestick may represent any time frame. We use a one-day candlestick chart (every candlestick represents one trading day) in our analysis. Doji candlestick pattern – A Doji candlestick is formed when a security's open and close are practically equal. The pattern indicates indecisiveness, and based on preceding price actions and future confirmation, may indicate a bullish or bearish trend reversal. ShootingStar/Inverted Hammer candlestick patterns – These candlestick patterns have a small real body (open price and close price are near to each other), and a long upper shadow (large intraday movement on the upside). The Shooting Star is a bearish reversal pattern that forms after a rally. The Inverted Hammer looks exactly like a Shooting Star, but forms after a downtrend. Inverted Hammers represent a potential bullish trend reversal.
  • 7. Page 7 of 8 Source: Bloomberg Company Name Price July 29 % Change WTD % Change YTD Market Cap. QR Million TTM P/E P/B Div. Yield Qatar National Bank 18.00 (0.50) (12.58) 166,256 14.3 2.4 3.3 Qatar Islamic Bank 16.10 0.63 5.02 38,043 13.4 2.3 3.3 Commercial Bank of Qatar 4.13 8.68 (12.13) 16,715 9.4 0.9 4.8 Doha Bank 2.37 (1.04) (6.32) 7,348 14.1 0.8 N/A Al Ahli Bank 3.30 3.12 (1.00) 8,018 13.1 1.4 4.3 Qatar International Islamic Bank 8.21 (0.70) (15.19) 12,427 14.1 2.1 5.2 Masraf Al Rayan 3.94 1.23 (0.56) 29,535 13.5 2.2 5.7 Al Khaliji Bank 1.55 (3.13) 18.32 5,580 9.3 0.9 4.8 Qatar First Bank 1.35 7.26 64.43 942 N/A 1.9 N/A National Leasing 0.91 5.84 28.51 448 16.7 0.7 5.5 Dlala Holding 1.91 3.52 212.77 543 N/A 2.9 N/A Qatar & Oman Investment 0.84 13.86 25.26 264 37.0 1.0 2.4 Islamic Holding Group 3.87 (4.19) 103.47 219 71.4 1.6 N/A Banking and Financial Services 286,338 Zad Holding 15.00 (1.25) 8.54 3,555 17.2 2.2 5.7 Qatar German Co. for Medical Devices 2.37 9.63 306.87 274 N/A 9.7 N/A Salam International Investment 0.46 0.44 (11.99) 520 N/A 0.5 N/A Baladna 1.72 7.50 72.00 3,270 N/A 1.5 1.2 Medicare Group 7.34 (1.30) (13.15) 2,065 28.5 2.2 24.5 Qatar Cinema & Film Distribution 3.31 (5.72) 50.45 208 46.2 0.2 3.0 Qatar Fuel 16.10 (1.04) (29.69) 16,008 17.0 2.0 5.0 Qatar Meat and Livestock 6.77 (1.46) 0.15 1,219 14.3 3.5 4.4 Mannai Corp. 2.81 (3.93) (8.77) 1,282 9.8 0.5 7.1 Al Meera Consumer Goods 19.15 0.84 25.16 3,830 19.9 3.0 4.4 Consumer Goods and Services 32,230 Qatar Industrial Manufacturing 2.70 (1.49) (24.26) 1,285 13.7 0.8 5.5 Qatar National Cement 3.68 0.68 (34.96) 2,402 17.4 0.8 8.2 Industries Qatar 7.82 (4.05) (23.93) 47,311 30.0 1.5 5.1 Qatari Investors Group 2.19 5.44 22.35 2,723 27.0 1.0 2.5 Qatar Electricity and Water 16.90 0.60 5.03 18,590 12.8 2.2 4.6 Aamal 0.77 (0.90) (5.41) 4,845 15.7 0.6 5.2 Gulf International Services 1.69 0.72 (2.03) 3,131 113.0 0.9 N/A Mesaieed Petrochemical Holding 2.09 0.19 (16.93) 26,194 26.9 1.8 3.4 Invesment Holding Group 0.51 (1.17) (9.93) 422 8.5 0.5 N/A Qatar Aluminum Manufacturing 0.85 3.43 8.19 4,715 N/A 0.8 1.2 Industrials 111,618 Qatar Insurance 2.01 (3.41) (36.33) 6,571 N/A 0.9 7.5 Doha Insurance 1.04 (0.48) (13.75) 518 11.1 0.5 7.7 Qatar General Insurance & Reinsurance 2.22 5.62 (9.84) 1,941 N/A 0.4 N/A Al Khaleej Takaful Insurance 1.83 5.71 (8.30) 468 14.8 0.9 2.7 Qatar Islamic Insurance 6.20 (1.18) (7.17) 930 13.7 2.5 6.0 Insurance 10,428 United Development 1.17 1.30 (23.16) 4,136 17.1 0.4 4.3 Barw a Real Estate 3.17 (2.62) (10.59) 12,316 7.7 0.6 6.3 Ezdan Real Estate 1.42 0.07 130.89 37,665 3955.4 1.2 N/A Mazaya Qatar Real Estate Development 0.88 (0.11) 21.84 1,014 35.8 0.8 N/A Real Estate 55,131 Ooredoo 6.70 0.36 (5.37) 21,461 12.8 1.0 3.7 Vodafone Qatar 1.26 (3.46) 8.19 5,305 36.5 1.2 4.0 Telecoms 26,766 Qatar Navigation (Milaha) 5.86 (2.01) (3.93) 6,711 12.5 0.5 5.1 Gulf Warehousing 5.03 (0.85) (8.16) 295 12.4 1.7 4.0 Qatar Gas Transport (Nakilat) 2.80 1.71 17.11 15,507 14.5 2.6 3.6 Transportation 22,513 Qatar Exchange 547,679
  • 8. Contacts Saugata Sarkar, CFA, CAIA Shahan Keushgerian Zaid al-Nafoosi , CMT, CFTe Head of Research Senior Research Analyst Senior Research Analyst Tel: (+974) 4476 6534 Tel: (+974) 4476 6509 Tel: (+974) 4476 6535 saugata.sarkar@qnbfs.com.qa shahan.keushgerian@qnbfs.com.qa zaid.alnafoosi@qnbfs.com.qa Mehmet Aksoy, PhD QNB Financial Services Co. W.L.L. Senior Research Analyst Contact Center: (+974) 4476 6666 Tel: (+974) 4476 6589 PO Box 24025 mehmet.aksoy@qnbfs.com.qa Doha, Qatar Disclaimer and Copyright Notice: This publication has been prepared by QNB Financial Services Co. W.L.L. (“QNB FS”) a wholly-owned subsidiary of Qatar National Bank (Q.P.S.C.). QNB FS is regulated by the Qatar Financial Markets Authority and the Qatar Exchange. Qatar National Bank (Q.P.S.C.) is regulated by the Qatar Central Bank. This publication expresses the views and opinions of QNB FS at a given time only. It is not an offer, promotion or recommendation to buy or sell securities or other investments, nor is it intended to constitute legal, tax, accounting, or financial advice. QNB FS accepts no liability whatsoever for any direct or indirect losses arising from use of this report. Any investment decision should depend on the individual circumstances of the investor and be based on specifically engaged investment advice. We therefore strongly advise potential investors to seek independent professional advice before making any investment decision. Although the information in this report has been obtained from sources that QNB FS believes to be reliable, we have not independently verified such information and it may not be accurate or complete. QNB FS does not make any representations or warranties as to the accuracy and completeness of the information it may contain, and declines any liability in that respect. For reports dealing with Technical Analysis, expressed opinions and/or recommendations may be different or contrary to the opinions/recommendations of QNB FS Fundamental Research as a result of depending solely on the historical technical data (price and volume). QNB FS reserves the right to amend the views and opinions expressed in this publication at any time. It may also express viewpoints or make investment decisions that differ significantly from, or even contradict, the views and opinions included in this report. This report may not be reproduced in whole or in part without permission from QNB FS COPYRIGHT: No part of this document may be reproduced without the explicit written permission of QNB FS. Page 8 of 8