QNBFS Weekly Market Report November 07, 2019
•
0 likes•114 views

The Qatar Stock Exchange (QSE) Index increased 85.59 points or 0.84% during the week, to close at 10,274.56

Recommended
More Related Content
What's hot
What's hot (20)
Similar to QNBFS Weekly Market Report November 07, 2019
Similar to QNBFS Weekly Market Report November 07, 2019 (20)
More from QNB Group
More from QNB Group (20)
Recently uploaded
Recently uploaded (20)
QNBFS Weekly Market Report November 07, 2019
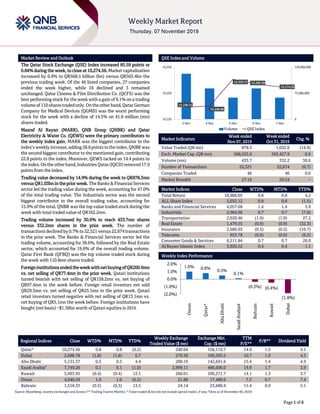
- 1. ` Page 1 of 6 Market Review and Outlook QSE Index and Volume The Qatar Stock Exchange (QSE) Index increased 85.59 points or 0.84% during the week, to close at 10,274.56. Market capitalization increased by 0.9% to QR568.5 billion (bn) versus QR563.4bn the previous trading week. Of the 46 listed companies, 27 companies ended the week higher, while 16 declined and 3 remained unchanged. Qatar Cinema & Film Distribution Co. (QCFS) was the best performing stock for the week with a gain of 9.1% on a trading volume of 110 sharestradedonly.Ontheother hand, QatarGerman Company for Medical Devices (QGMD) was the worst performing stock for the week with a decline of 14.5% on 41.9 million (mn) shares traded. Masraf Al Rayan (MARK), QNB Group (QNBK) and Qatar Electricity & Water Co. (QEWS) were the primary contributors to the weekly index gain. MARK was the biggest contributor to the index’sweekly increase,adding 28.6points to the index.QNBKwas the second biggest contributor to the mentioned gain, contributing 22.8 points to the index. Moreover, QEWS tacked on 14.4 points to the index.Onthe otherhand,IndustriesQatar(IQCD)removed17.9 points from the index. Trading value decreased by 14.9% during the week to QR878.3mn versus QR1.03bn in the prior week. The Banks & Financial Services sector led the trading value during the week, accounting for 47.0% of the total trading value. The Industrials sector was the second biggest contributor to the overall trading value, accounting for 15.9% of the total. QNBK was the top value traded stock during the week with total traded value of QR162.2mn. Trading volume increased by 30.6% to reach 433.7mn shares versus 332.2mn shares in the prior week. The number of transactions declined by 0.7% to 22,521 versus 22,674 transactions in the prior week. The Banks & Financial Services sector led the trading volume, accounting for 38.6%, followed by the Real Estate sector, which accounted for 19.6% of the overall trading volume. Qatar First Bank (QFBQ) was the top volume traded stock during the week with 110.8mn shares traded. Foreigninstitutions ended theweekwithnetbuyingofQR200.9mn vs. net selling of QR77.4mn in the prior week. Qatari institutions turned bearish with net selling of QR158.2mn vs. net buying of QR97.4mn in the week before. Foreign retail investors net sold QR29.5mn vs. net selling of QR25.1mn in the prior week. Qatari retail investors turned negative with net selling of QR13.1mn vs. net buying of QR5.1mn the week before. Foreign institutions have bought (net basis) ~$1.36bn worth of Qatari equities in 2019. Market Indicators Week ended Nov 07, 2019 Week ended Oct 31, 2019 Chg. % Value Traded (QR mn) 878.3 1,032.6 (14.9) Exch. Market Cap. (QR mn) 568,535.0 563,427.9 0.9 Volume (mn) 433.7 332.2 30.6 Number of Transactions 22,521 22,674 (0.7) Companies Traded 46 46 0.0 Market Breadth 27:16 20:24 – Market Indices Close WTD% MTD% YTD% Total Return 18,906.05 0.8 0.8 4.2 ALL Share Index 3,032.12 0.8 0.8 (1.5) Banks and Financial Services 4,057.68 1.4 1.4 5.9 Industrials 2,964.96 0.7 0.7 (7.8) Transportation 2,620.46 (1.0) (1.0) 27.2 Real Estate 1,479.55 (0.9) (0.9) (32.3) Insurance 2,686.03 (0.5) (0.5) (10.7) Telecoms 923.78 (0.6) (0.6) (6.5) Consumer Goods & Services 8,511.84 0.7 0.7 26.0 Al Rayan Islamic Index 3,926.52 0.4 0.4 1.1 Market Indices Weekly Index Performance Regional Indices Close WTD% MTD% YTD% Weekly Exchange Traded Value ($ mn) Exchange Mkt. Cap. ($ mn) TTM P/E** P/B** Dividend Yield Qatar* 10,274.56 0.8 0.8 (0.2) 240.04 156,119.7 14.9 1.5 4.1 Dubai 2,698.78 (1.8) (1.8) 6.7 270.36 100,593.5 10.7 1.0 4.3 Abu Dhabi 5,131.37 0.5 0.5 4.4 200.19 142,691.6 15.4 1.4 4.9 Saudi Arabia# 7,749.26 0.1 0.1 (1.0) 2,999.11 486,606.0 19.9 1.7 3.9 Kuwait 5,693.95 (0.4) (0.4) 12.1 260.01 106,271.7 14.1 1.3 3.7 Oman 4,040.59 1.0 1.0 (6.5) 21.80 17,489.6 7.5 0.7 7.4 Bahrain 1,518.33 (0.3) (0.3) 13.5 24.14 23,680.4 11.4 0.9 5.1 Source: Bloomberg, country exchanges and Zawya (** Trailing Twelve Months; * Value traded ($ mn) do not include special trades, if any; #Data as of November 06, 2019) 10,196.13 10,200.98 10,303.73 10,285.38 10,274.56 0 75,000,000 150,000,000 10,150 10,250 10,350 3-Nov 4-Nov 5-Nov 6-Nov 7-Nov Volume QSE Index 1.0% 0.8% 0.5% 0.1% (0.3%) (0.4%) (1.8%) (2.0%) (1.0%) 0.0% 1.0% 2.0% Oman Qatar* AbuDhabi SaudiArabia# Bahrain Kuwait Dubai
- 2. Page 2 of 6 News Company/Market News QCB issues T-bills worth QR600mn in November – Qatar Central Bank (QCB) has issued Treasury bills (T-bills) for the month of November 2019 worth QR600mn for three, six and nine months. According to a statement issued by QCB on Tuesday, Treasury bond issuances were distributed as follows: QR300mn for three months at an interest rate of 1.73%, QR200mn for six months at a rate of 1.76%, and QR100mn for nine months at an interest rate of 1.81%. QCB’s issuance of Treasury bills comes within the framework of its efforts to develop the monetary policy in Qatar and increase its effectiveness, and to contribute to the robustness of the banking and financial system, activate the open market instruments as one of the monetary policy tools, and implement the mechanism of coordination between fiscal and monetary policies. (Qatar Tribune) Masraf Al Rayan completes successful issuance of $500mn Sukuk – Masraf Al Rayan has announced the successful issuance of $500mn Sukuk with a term of five years under the bank’s existing $2bn Sukuk program. Masraf Al Rayan’s debut issuance was three times oversubscribed as a result of strong investor demand. The issue was priced at a spread of 140 basis points over the five-year mid swaps carrying fixed profit rate of 3.025% per annum. The participation included investors from around the world with 44% from Asia, 44% from MENA and 12% from Europe. By type, 47% were fund managers, 38% were banks and private banks, and 15% were insurance and agencies. The success of this process was based on a comprehensive marketing strategy that aimed to showcase the strong fundamentals of Masraf Al Rayan and the strength of the Qatari economy to international investors. Al Rayan Investment, Boubyan Bank, MUFG, QNB Capital and Standard Chartered Bank acted as Joint Lead Managers & Bookrunners on this transaction. (QSE) QIIK begins a business tour involving a series of meetings with investors in several countries – Qatar International Islamic Bank (QIIK) appointed Standard Chartered Bank as Sole Structuring Advisor, QNB Capital and Standard Chartered Bank as Joint Global Coordinators, and Barwa Bank, Kuwait International Bank, QInvest, QNB Capital and Standard Chartered Bank as Joint Lead Managers and Joint Bookrunners to arrange fixed income investor meetings in Singapore, Hong Kong and London commencing on November 8, 2019. A fixed rate resettable Regulation S Registered USD Additional Tier 1 perpetual non-call 5-year unrated Sukuk may follow, subject to market conditions. FCA/ICMA stabilization applies. MiFID II professionals/ECPs-only/No PRIIPs KID. (QSE) Baladna forecasts expansion, revenue growth by 2019-end – Baladna Food Industries (BFI), is expecting to expand its product portfolio in the Qatari market, and is forecasting further revenue growth by the end of the year, according to a senior official. Currently, the company has 115 products, ranging from dairy and cheese to fruit juices and beef, according to Power International Holding’s Vice Chairman and BFI’s Co-Founder, Ramez Al-Khayyat. Al-Khayyat said, “After the completion of the new production lines for the third phase recently, the company started the process of launching 57 new products, and the process extends over the next three months, bringing the total number of products to 172. The company will develop its product list on an annual basis and will introduce new products to serve the Qatari market and other selected markets and provide them with the best products.” (Gulf-Times.com) Baladna sales revenue scales up to QR36mn per month in second quarter – Driven by significant capital investments to expand its production infrastructure, Baladna Food Industries (Baladna) has seen its revenues scale up to QR36mn per month in second quarter of 2019, figures released by the company showed on Sunday. Revenues grew from an average of QR18mn per month in 2018 to an average of QR25mn per month in the first quarter of this year. The rapid growth in revenue comes as Baladna has outlined an ambitious vision for growth as part of its announced IPO, which will enable Qatari citizens and corporates to share in Baladna’s success and future expansion. Figures released by Baladna on Sunday showed that the ‘program of investment’ has resulted in a substantial boost in sales revenue. Baladna is now targeting further growth ambitions, and has outlined a vision to become the preferred brand for natural and fresh food and beverages. (Gulf- Times.com) Baladna forecasts expansion, revenue growth by 2019-end – Baladna Food Industries (BFI), is expecting to expand its product portfolio in the Qatari market, and is forecasting further revenue growth by the end of the year, according to a senior official. Currently, the company has 115 products, ranging from dairy and cheese to fruit juices and beef, according to Power International Holding’s Vice Chairman and BFI’s Co-Founder, Ramez Al-Khayyat. Al-Khayyat said, “After the completion of the new production lines for the third phase recently, the company started the process of launching 57 new products, and the process extends over the next three months, bringing the total number of products to 172. The company will develop its product list on an annual basis and will introduce new products to serve the Qatari market and other selected markets and provide them with the best products.” (Gulf-Times.com)
- 3. Page 3 of 6 Qatar Stock Exchange Top Gainers Top Decliners Source: Qatar Stock Exchange (QSE) Source: Qatar Stock Exchange (QSE) Most Active Shares by Value (QR Million) Most Active Shares by Volume (Million) Source: Qatar Stock Exchange (QSE) Source: Qatar Stock Exchange (QSE) Investor Trading Percentage to Total Value Traded Net Traded Value by Nationality (QR Million) Source: Qatar Stock Exchange (QSE) Source: Qatar Stock Exchange (QSE) 9.1% 7.3% 5.3% 3.8% 3.5% 0.0% 4.0% 8.0% 12.0% Qatar Cinema & Film Distribution Co. Al Khaleej Takaful Insurance Co. Gulf International Services Aamal Company Qatar Electricity & Water Co. -14.5% -9.8% -4.1% -3.1% -2.9% -18.0% -12.0% -6.0% 0.0% QatariGermanCo. forMedical Dev. QatarGeneral Ins.& Reins.Co. Vodafone Qatar QatarNavigation DlalaBrokerage & Inv.HoldingCo. 162.2 75.1 60.8 57.4 43.7 0.0 60.0 120.0 180.0 QNB Group Qatar International Islamic Bank Masraf Al Rayan Qatar Fuel Company Ezdan Holding Group 110.9 67.4 41.9 34.7 16.1 0.0 40.0 80.0 120.0 Qatar First Bank Ezdan Holding Group QatariGerman Co. for Medical Dev. Aamal Company Qatar Aluminium Manufacturing Company 0% 20% 40% 60% 80% 100% Buy Sell 33.25% 34.74% 16.34% 34.36% 10.77% 14.13% 39.63% 16.77% Qatari Individuals Qatari Institutions Non-Qatari Individuals Non-Qatari Institutions 436 443 607 271 (171) 171 (400) (200) - 200 400 600 800 Qatari Non-Qatari Net Investment Total Sold Total Bought
- 4. Page 4 of 6 TECHNICAL ANALYSIS OF THE QSE INDEX Source: Bloomberg The QE Index closed up by 0.84% from the week before, and closed at the 10,274.56 level. The Index kept moving inside the corrective channel and bounced below the strong resistance, around the 10,600 level. We keep our expected weekly-resistance level at 10,800 points and the 9,700 level as our weekly support. DEFINITIONS OF KEY TERMS USED IN TECHNICAL ANALYSIS RSI (Relative Strength Index) indicator – RSI is a momentum oscillator that measures the speedand change of price movements. The RSI oscillates between 0 to 100. The index is deemed to be overbought once the RSI approaches the 70 level, indicating that a correction is likely. On the other hand, if the RSI approaches 30, it is an indication that the index may be getting oversold and therefore likely to bounce back. MACD (Moving Average Convergence Divergence) indicator – The indicator consists of the MACD line and a signal line. The divergence or the convergence of the MACD line with the signal line indicates the strength in the momentum during the uptrend or downtrend, as the case may be. When the MACD crosses the signal line from below and trades above it, it gives a positive indication. The reverse is the situation for a bearish trend. Candlestick chart – A candlestick chart is a price chart that displays the high, low, open, and close for a security. The ‘body’ of the chart is portion between the open and close price, while the high and low intraday movements form the ‘shadow’. The candlestick may represent any time frame. We use a one-day candlestick chart (every candlestick represents one trading day) in our analysis. Doji candlestick pattern – A Doji candlestick is formed when a security's open and close are practically equal. The pattern indicates indecisiveness, and based on preceding price actions and future confirmation, may indicate a bullish or bearish trend reversal. ShootingStar/Inverted Hammer candlestick patterns – These candlestick patterns have a small real body (open price and close price are near to each other), and a long upper shadow (large intraday movement on the upside). The Shooting Star is a bearish reversal pattern that forms after a rally. The Inverted Hammer looks exactly like a Shooting Star, but forms after a downtrend. Inverted Hammers represent a potential bullish trend reversal.
- 5. Page 5 of 6 Source: Bloomberg Company Name Price November 07 % Change WTD % Change YTD Market Cap. QR Million TTM P/E P/B Div. Yield Qatar National Bank 19.20 (3.03) (1.54) 177,339 13.8 2.5 3.1 Qatar Islamic Bank 15.22 (1.17) 0.13 35,964 13.1 2.2 3.3 Commercial Bank of Qatar 4.30 (4.66) 9.16 17,403 10.6 1.0 3.5 Doha Bank 2.53 0.40 14.41 7,844 11.1 0.8 3.9 Al Ahli Bank 3.60 0.00 41.43 8,330 12.4 1.4 2.5 Qatar International Islamic Bank 9.51 2.81 43.83 14,395 16.5 2.4 4.2 Masraf Al Rayan 3.75 (1.32) (10.03) 28,125 13.1 2.1 5.3 Al Khaliji Bank 1.20 2.56 3.99 4,320 7.4 0.7 6.3 Qatar First Bank 0.31 5.74 (23.28) 626 N/A 0.9 N/A National Leasing 0.66 (2.96) (25.37) 325 44.7 0.5 7.6 Dlala Holding 0.65 (3.01) (35.50) 183 N/A 0.9 N/A Qatar & Oman Investment 0.51 (2.88) (5.43) 159 59.6 0.5 5.9 Islamic Holding Group 1.90 2.15 (13.04) 108 201.9 0.8 N/A Banking and Financial Services 295,122 Zad Holding 13.96 0.79 34.23 2,009 15.5 2.2 6.1 Qatar German Co. for Medical Devices 0.70 5.78 22.79 80 N/A 2.3 N/A Salam International Investment 0.40 (0.74) (6.70) 462 N/A 0.4 N/A Medicare Group 9.00 8.70 42.63 2,533 31.2 2.6 20.0 Qatar Cinema & Film Distribution 2.20 (0.45) 15.67 138 17.9 1.0 6.8 Qatar Fuel 22.10 0.59 33.14 21,973 18.2 2.7 3.6 Qatar Meat and Livestock 6.43 (1.23) (8.14) 1,157 10.9 3.4 7.0 Mannai Corp. 3.10 (3.13) (43.59) 1,414 5.0 0.6 6.5 Al Meera Consumer Goods 15.70 (0.63) 6.08 3,140 17.0 2.4 5.4 Consumer Goods and Services 32,907 Qatar Industrial Manufacturing 3.55 1.43 (16.86) 1,687 15.0 1.1 7.0 Qatar National Cement 5.80 (0.17) (2.52) 3,790 15.6 1.2 8.6 Industries Qatar 10.51 (4.37) (21.34) 63,586 19.6 1.9 5.7 Qatari Investors Group 1.66 2.47 (40.31) 2,064 15.9 0.7 4.5 Qatar Electricity and Water 15.80 (1.25) (14.59) 17,380 13.1 1.9 4.9 Aamal 0.71 (0.56) (20.25) 4,442 12.2 0.6 8.5 Gulf International Services 1.69 0.60 (0.59) 3,141 N/A 0.9 N/A Mesaieed Petrochemical Holding 2.50 (6.37) 66.33 31,408 36.7 2.2 3.2 Invesment Holding Group 0.52 0.58 6.95 434 7.1 0.6 4.8 Qatar Aluminum Manufacturing 0.82 (2.73) (38.58) 4,576 N/A N/A 2.4 Industrials 132,507 Qatar Insurance 3.07 (3.15) (14.48) 10,027 17.1 1.2 4.9 Doha Insurance 1.04 2.97 (20.55) 520 8.4 0.5 7.7 Qatar General Insurance & Reinsurance 2.64 (19.76) (41.18) 2,310 12.8 0.4 3.8 Al Khaleej Takaful Insurance 2.05 (3.76) 138.65 523 13.1 1.0 2.4 Qatar Islamic Insurance 6.95 (0.71) 29.40 1,043 16.0 2.9 5.0 Insurance 14,423 United Development 1.40 1.45 (5.08) 4,957 13.3 0.5 7.1 Barw a Real Estate 3.40 0.59 (14.31) 13,230 8.6 0.7 7.3 Ezdan Real Estate 0.63 3.12 (51.62) 16,658 50.2 0.5 N/A Mazaya Qatar Real Estate Development 0.71 (0.42) (9.62) 816 N/A 0.6 7.1 Real Estate 35,661 Ooredoo 7.30 0.27 (2.67) 23,383 16.0 1.0 3.4 Vodafone Qatar 1.23 0.00 (21.25) 5,199 34.8 1.2 4.1 Telecoms 28,583 Qatar Navigation (Milaha) 6.50 0.93 (1.53) 7,444 13.8 0.5 4.6 Gulf Warehousing 5.10 2.20 32.57 299 15.9 1.7 3.7 Qatar Gas Transport (Nakilat) 2.47 (1.20) 37.76 13,684 14.3 2.1 4.0 Transportation 21,427 Qatar Exchange 568,535
- 6. Contacts Saugata Sarkar, CFA, CAIA Shahan Keushgerian Zaid al-Nafoosi , CMT, CFTe Head of Research Senior Research Analyst Senior Research Analyst Tel: (+974) 4476 6534 Tel: (+974) 4476 6509 Tel: (+974) 4476 6535 saugata.sarkar@qnbfs.com.qa shahan.keushgerian@qnbfs.com.qa zaid.alnafoosi@qnbfs.com.qa Mehmet Aksoy, PhD QNB Financial Services Co. W.L.L. Senior Research Analyst Contact Center: (+974) 4476 6666 Tel: (+974) 4476 6589 PO Box 24025 mehmet.aksoy@qnbfs.com.qa Doha, Qatar Disclaimer and Copyright Notice: This publication has been prepared by QNB Financial Services Co. W.L.L. (“QNB FS”) a wholly-owned subsidiary of Qatar National Bank (Q.P.S.C.). QNB FS is regulated by the Qatar Financial Markets Authority and the Qatar Exchange. Qatar National Bank (Q.P.S.C.) is regulated by the Qatar Central Bank. This publication expresses the views and opinions of QNB FS at a given time only. It is not an offer, promotion or recommendation to buy or sell securities or other investments, nor is it intended to constitute legal, tax, accounting, or financial advice. QNB FS accepts no liability whatsoever for any direct or indirect losses arising from use of this report. Any investment decision should depend on the individual circumstances of the investor and be based on specifically engaged investment advice. We therefore strongly advise potential investors to seek independent professional advice before making any investment decision. Although the information in this report has been obtained from sources that QNB FS believes to be reliable, we have not independently verified such information and it may not be accurate or complete. QNB FS does not make any representations or warranties as to the accuracy and completeness of the information it may contain, and declines any liability in that respect. For reports dealing with Technical Analysis, expressed opinions and/or recommendations may be different or contrary to the opinions/recommendations of QNB FS Fundamental Research as a result of depending solely on the historical technical data (price and volume). QNB FS reserves the right to amend the views and opinions expressed in this publication at any time. It may also express viewpoints or make investment decisions that differ significantly from, or even contradict, the views and opinions included in this report. This report may not be reproduced in whole or in part without permission from QNB FS COPYRIGHT: No part of this document may be reproduced without the explicit written permission of QNB FS. Page 6 of 6