QNBFS Weekly Market Report April 07, 2022
•
0 likes•117 views

The Qatar Stock Exchange (QSE) Index surged by 556.31 points or 4.11% during the week to close at 14,089.47

Recommended
Recommended
More Related Content
Similar to QNBFS Weekly Market Report April 07, 2022
Similar to QNBFS Weekly Market Report April 07, 2022 (20)
More from QNB Group
More from QNB Group (20)
Recently uploaded
Recently uploaded (20)
QNBFS Weekly Market Report April 07, 2022
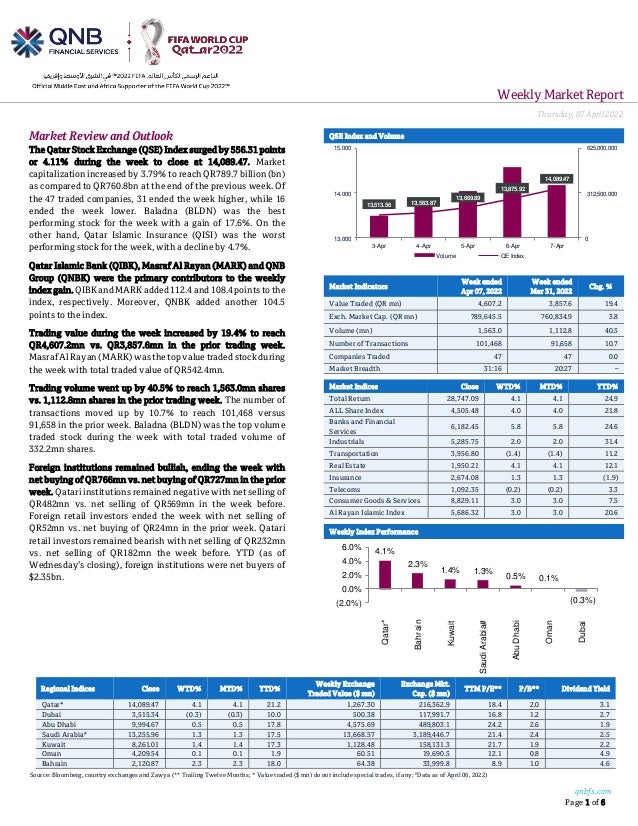
- 1. Weekly MarketReport Thursday,07April2022 qnbfs.com Page 1 of 6 Regional Indices Close WTD% MTD% YTD% Weekly Exchange Traded Value ($ mn) Exchange Mkt. Cap. ($ mn) TTM P/E** P/B** Dividend Yield Qatar* 14,089.47 4.1 4.1 21.2 1,267.30 216,362.9 18.4 2.0 3.1 Dubai 3,515.34 (0.3) (0.3) 10.0 500.38 117,991.7 16.8 1.2 2.7 Abu Dhabi 9,994.67 0.5 0.5 17.8 4,575.69 489,803.1 24.2 2.6 1.9 Saudi Arabia# 13,255.96 1.3 1.3 17.5 13,668.57 3,189,446.7 21.4 2.4 2.5 Kuwait 8,261.01 1.4 1.4 17.3 1,128.48 158,131.3 21.7 1.9 2.2 Oman 4,209.54 0.1 0.1 1.9 60.51 19,690.5 12.1 0.8 4.9 Bahrain 2,120.87 2.3 2.3 18.0 64.38 33,999.8 8.9 1.0 4.6 Source: Bloomberg, country exchanges and Zawya (** Trailing Twelve Months; * Value traded ($ mn) do not include special trades, if any; #Data as of April 06, 2022) Market Review and Outlook QSE Index and Volume The Qatar Stock Exchange (QSE) Index surged by 556.31 points or 4.11% during the week to close at 14,089.47. Market capitalization increased by 3.79% to reach QR789.7 billion (bn) as compared to QR760.8bn at the end of the previous week. Of the 47 traded companies, 31 ended the week higher, while 16 ended the week lower. Baladna (BLDN) was the best performing stock for the week with a gain of 17.6%. On the other hand, Qatar Islamic Insurance (QISI) was the worst performing stock for the week, with a decline by 4.7%. Qatar Islamic Bank (QIBK), Masraf Al Rayan (MARK) and QNB Group (QNBK) were the primary contributors to the weekly index gain. QIBKandMARKadded112.4and108.4pointstothe index, respectively. Moreover, QNBK added another 104.5 points to the index. Trading value during the week increased by 19.4% to reach QR4,607.2mn vs. QR3,857.6mn in the prior trading week. MasrafAl Rayan (MARK)wasthetopvaluetraded stock during the week with total traded value of QR542.4mn. Trading volume went up by 40.5% to reach 1,563.0mn shares vs. 1,112.8mn shares in the prior trading week. The number of transactions moved up by 10.7% to reach 101,468 versus 91,658 in the prior week. Baladna (BLDN) was the top volume traded stock during the week with total traded volume of 332.2mn shares. Foreign institutions remained bullish, ending the week with net buying of QR766mn vs. net buying of QR727mn in the prior week. Qatari institutions remained negative with net selling of QR482mn vs. net selling of QR569mn in the week before. Foreign retail investors ended the week with net selling of QR52mn vs. net buying of QR24mn in the prior week. Qatari retail investors remained bearish with net selling of QR232mn vs. net selling of QR182mn the week before. YTD (as of Wednesday’s closing), foreign institutions were net buyers of $2.35bn. Market Indicators Week ended Apr 07, 2022 Week ended Mar 31, 2022 Chg. % Value Traded (QR mn) 4,607.2 3,857.6 19.4 Exch. Market Cap. (QR mn) 789,645.5 760,834.9 3.8 Volume (mn) 1,563.0 1,112.8 40.5 Number of Transactions 101,468 91,658 10.7 Companies Traded 47 47 0.0 Market Breadth 31:16 20:27 – Market Indices Close WTD% MTD% YTD% Total Return 28,747.09 4.1 4.1 24.9 ALL Share Index 4,505.48 4.0 4.0 21.8 Banks and Financial Services 6,182.45 5.8 5.8 24.6 Industrials 5,285.75 2.0 2.0 31.4 Transportation 3,956.80 (1.4) (1.4) 11.2 Real Estate 1,950.21 4.1 4.1 12.1 Insurance 2,674.08 1.3 1.3 (1.9) Telecoms 1,092.35 (0.2) (0.2) 3.3 Consumer Goods & Services 8,829.11 3.0 3.0 7.5 Al Rayan Islamic Index 5,686.32 3.0 3.0 20.6 Weekly Index Performance 13,513.56 13,563.87 13,669.89 13,875.92 14,089.47 0 312,500,000 625,000,000 13,000 14,000 15,000 3-Apr 4-Apr 5-Apr 6-Apr 7-Apr Volume QE Index 4.1% 2.3% 1.4% 1.3% 0.5% 0.1% (0.3%) (2.0%) 0.0% 2.0% 4.0% 6.0% Qatar* Bahrain Kuwait Saudi Arabia# Abu Dhabi Oman Dubai
- 2. qnbfs.com Page 2 of 6 Economic, Market & Company News QNB Group announces the completion of legal formalities with respect to increase in foreign ownership limit to 100% – Following shareholder approval of amendments to QNB Group’s Articles of Association at the Extraordinary General Assembly meeting held on 13 February 2022, QNB Group announces that it has procured all the required regulatory approvals from respective regulators to amend Article 10 of QNB Group’s Articlesof Association, toallow foreign ownership limit of up to 100%. The Bank will process the application to increase the limit with the competent authorities with immediate effect. (QSE) QCSD amends the percentage of foreign ownership in QNB to become 100% of the capital – Qatar Central Securities Depository has modified the foreigners’ ownership limit of QatarNational Bank (QNB) tobe 100%of the capital, which is equal to (9,236,428,570) shares. (QSE) Masraf Al Rayan 100% FOL enters into effect – Masraf Al Rayan QPSC announced that it has completed all requirements and obtained necessary approvals to increase Foreign Ownership Limit in the Bank’s capital to 100%. The Bank will process the application to increase the limit with the competent party with immediate effect. Qatar Central Depository Company amends the percentage of foreign ownership in Masraf Al Rayan to become 100% of the capital – Qatar Central Securities Depository has modified the foreigners’ ownership limit of Masraf Al Rayan to be 100% of the capital, which is an equal to (9,300,000,000) shares. (QSE) QSE will launchnew trading system in cooperation with LSEG – LSEG (London Stock Exchange Group plc), announced it has entered into an agreement to provide its trading and market surveillance technology to Qatar Stock Exchange (QSE). The new platform will replace QSE’s existing trading and market surveillance systems and will enable QSE to expand into derivatives trading in the future. Qatar Stock Exchange will be powered by the same technology used by LSEG. The new QSE solution will be based upon LSEG’s financial markets product suite, a robust, scalable, and high-performance technology offering, which includes trading, market data, data analytics, and market surveillance. Utilizing a common foundation, all products adhere to a unified architecture and share the same technology framework, data constructs and software engineering methodology. At the completion of this project, QSE will have a proven technology solution, offering high performance, low latency matching and a powerful market surveillance solution including market data visualization and analytics. LSEG’s financial markets technology products are used by over 25 financial markets infrastructure operators across the globe, including Johannesburg Stock Exchange, Singapore Exchange and LSEG. Mr. Tamim Hamad Al-Kawari, CEO of Qatar Stock Exchange, said: “QSE is looking forward to working with LSEG to provide us with industry leading resilience, performance, and business capabilities. The implementation of this technology will enable QSE and its customers to pave the way for QSE to become the leading financial markets innovator in the region.” The launch of the new trading system will be a great milestone for QSE. It enables us to deliver even greater value as well as offering new products and services to a whole new range of potential clients and participants in the derivative and equity capital markets arena. I would like to thank all our stakeholders who have supported us with this strategic initiative which is very important as we seek to sustain future growth, Ms. Aisha Al-Mahmoud, QSE’s IT Director, commented. Mr. Peter Jessup, Head of Market Infrastructure Business Development, Trading & Banking Solutions, LSEG, said: “We are excited to have several of our products selected by QSE to power their market and provide the foundation of QSE’s ongoing growth.” (QSE) Qatar stock exchange-listed companies reported QR43bn net profits for the year 2021 – 48 companies listed on Qatar Stock Exchange disclosed their annual financial results for the year ended December 31, 2021, as the net profits for that period amounted to QR43.28bn compared to QR 30.68bn for the same period last year 2020, the amount shows an increase of 41%. It is worth noting that all financial data of the listed companies are available on the website of the Qatar Stock Exchange. Qatar Stock Exchange would like to thank all listed companies for their efforts in enhancing the disclosure and transparency principles. (QSE) Total assets of Qatari banks rise 0.9% to QR1.81tn in Feb – Total assets of Qatar’s banking sector increased by 0.9% month-on-month (MoM) in February 2022 to reach QR1.818tn, QNB Financial Services (QNBFS) has said in a report released on Monday. According to the report, the total loan book of Qatar’s banking sector went down marginally by 0.2% MoM and deposits went up by 0.4% MoM in February this year. The public sector pushed the credit lower by 1.5% MoM in February. As deposits went up by 0.4% in February, the report said, the LDR went down to 125.5 % against 126.4% in January 2022. Private sector deposits went up by 2.7% MoM for the month of February this year resulting in the overall gain in deposits. On the private sector front, the report said, the companies and institutions’ segment increased by 4.2% MoM and the consumer segment went up by 1.5% MoM. Public sector deposits moved down 0.4%, MoM. Looking at segment details, the report said, the government segment which represents 30% of public sector deposits fell by 9.7% MoM, while the semi-government institutions’ segment moved down by 3.5% MoM. However, the government institutions’ segment which represents 57% of public sector deposits increased by 6.2%, MoM. Non-resident deposits declined by 2.1% MoM. The overall loan book moved lower by 0.2 % in February 2022. Domestic public sector loans went down by 1.5% MoM. The government segment’s loan book declined 4.4%, MoM. (Qatar Tribune) Qatar’s economy grows 2% in Q4 of last year – The Qatari economy achieved a real growth rate - constant prices - of 2 % in the fourth quarter of 2021 year- on-year, according to data issued by the Planning and Statistics Authority. The quarterly GDP at constant prices reached QR166.242bn in Q4 of 2021 compared to the estimate of QR136.062bn in Q4 of 2020, recording an increase of 2 %. When compared to the Q3 of 2021 revised estimate of QR167.772bn, a decrease of 0.9 % is also recorded. The quarterly GDP at current prices in Q4 of 2021 is estimated at QR174.266bn. This represents an increase of 29.3 % compared to the estimate for Q4 of 2020. The nominal gross value added (GVA) estimate of Mining and Quarrying activities is estimated at QR63.639bn in Q4 2021, which shows an increase of 63.7 % over the estimate of Q4 2020 placed at QR38.879bn. Compared to the previous quarter’s Q3 2021 revised estimate at QR67.812bn, a decrease of 6.2 % in the GVA of this sector is recorded. The real GVA of these activities is estimated at QR61.253bn in Q4 2021, which shows an increase of 1.3 % compared to the estimate of QR60.456bn in Q4 2020. Compared to the Q3 2021 revised estimate of QR62.685bn, a decrease of 2.3 % in the real GVA of this sector is also recorded. The nominal GVA of Non-Mining and Quarrying activities is estimated at QR110.626bn in Q4 2021, which shows an increase of 15.4 % over the estimate of QR95.883bn in Q4 2020. Comparedto the previous quarter’s Q3 2021 revised estimate of QR106.994bn, an increase of 3.4 % is recorded. The real GVA of Non-Mining and Quarrying activities is estimated at QR104.989bn in Q4 2021, which shows an increase of 2.3 % over the estimate of QR102.606bn in Q4 2020. When compared to the Q3 2021 revised estimate of QR105.088bn, a decrease of 0.1 % is also recorded. (Peninsula Qatar) Qatar supplies first gas shipment to Shandong Province, China – The state- backed Shanghai Petroleum and Natural Gas Exchange said on Tuesday that a liquefied natural gas terminal in eastern China operated by state-owned oil and gas giant Sinopec Corp has received its first shipment from Qatar. The stock exchange said that the shipment, with a volume of 205,000 cubic meters, began unloading at the Qingdao station in Shandong Province on the third of April, the first supply of Qatari gas to the province in eastern China. This shipment of gas ispart of a 10-year supply contract that Sinopec entered into with Qatar Petroleum in March of last year for an annual supply of two million tons, or 2.8bn cubic meters, starting this year. Sinopec is expanding the Qingdao plant in an effort to double its annual capacity to 14mn tons by the end of 2023. (Bloomberg)
- 3. qnbfs.com Page 3 of 6 Qatar Stock Exchange Top Gainers Top Decliners Source: Qatar Stock Exchange (QSE) Source: Qatar Stock Exchange (QSE) Most Active Shares by Value (QR Million) Most Active Shares by Volume (Million) Source: Qatar Stock Exchange (QSE) Source: Qatar Stock Exchange (QSE) Investor Trading Percentage to Total Value Traded Net Traded Value by Nationality (QR Million) Source: Qatar Stock Exchange (QSE) Source: Qatar Stock Exchange (QSE) 17.6% 9.8% 9.8% 8.7% 7.3% 0.0% 7.0% 14.0% 21.0% Baladna Investment Holding Group Dlala Brokerage & Investment Holding Company Qatar International Islamic Bank Masraf Al Rayan -4.7% -4.1% -2.4% -2.3% -1.7% -6.0% -4.0% -2.0% 0.0% Qatar Islamic Insurance Company Al Khaleej Takaful Insurance Company Widam Food Company Qatar Navigation Gulf International Services 542.4 536.2 408.7 331.4 298.1 0.0 210.0 420.0 630.0 Masraf Al Rayan Baladna QNB Group Qatar Islamic Bank Investment Holding Group 332.2 208.8 121.2 100.9 94.9 0.0 120.0 240.0 360.0 Baladna Salam International Investment Limited Investment Holding Group Masraf Al Rayan Gulf International Services 0% 20% 40% 60% 80% 100% Buy Sell 40.39% 45.22% 16.53% 26.55% 14.13% 15.21% 28.95% 13.01% Qatari Individuals Qatari Institutions Non-Qatari Individuals Non-Qatari Institutions 2,736 2,070 3,449 1,356 -714 714 -1,000 0 1,000 2,000 3,000 4,000 Qatari Non-Qatari Net Investment Total Sold Total Bought
- 4. qnbfs.com Page 4 of 6 TECHNICAL ANALYSIS OF THE QSE INDEX Source: Bloomberg Despite past week’s indecisive signals, the QE Index closed 4.7% up from the week before. It closed above the 13,800 resistance and reached the 14,000 psychological barrier. The trend remains up on the Index, but the Index reached the upper side of the uptrend channel. Our resistance is at the 14,000 level and our support at the 12,200 level. DEFINITIONS OF KEY TERMS USED IN TECHNICAL ANALYSIS RSI (Relative Strength Index) indicator – RSI is a momentum oscillator that measures the speedand change of price movements. The RSI oscillates between 0 to 100. The index is deemed to be overbought once the RSI approaches the 70 level, indicating that a correction is likely. On the other hand, if the RSI approaches 30, it is an indication that the index may be getting oversold and therefore likely to bounce back. MACD (Moving Average Convergence Divergence) indicator – The indicator consists of the MACD line and a signal line. The divergence or the convergence of the MACD line with the signal line indicates the strength in the momentum during the uptrend or downtrend, as the case may be. When the MACD crosses the signal line from below and trades above it, it gives a positive indication. The reverse is the situation for a bearish trend. Candlestick chart – A candlestick chart is a price chart that displays the high, low, open, and close for a security. The ‘body’ of the chart is portion between the open and close price, while the high and low intraday movements form the ‘shadow’. The candlestick may represent any time frame. We use a one-day candlestick chart (every candlestick represents one trading day) in our analysis. Doji candlestick pattern – A Doji candlestick is formed when a security's open and close are practically equal. The pattern indicates indecisiveness, and based on preceding price actions and future confirmation, may indicate a bullish or bearish trend reversal. ShootingStar/Inverted Hammer candlestick patterns – These candlestick patterns have a small real body (open price and close price are near to each other), and a long upper shadow (large intraday movement on the upside). The Shooting Star is a bearish reversal pattern that forms after a rally. The Inverted Hammer looks exactly like a Shooting Star, but forms after a downtrend. Inverted Hammers represent a potential bullish trend reversal.
- 5. qnbfs.com Page 5 of 6 Source: Bloomberg Com pan y Nam e P rice April 07 % Ch an ge WTD % Ch an ge YTD Marke t Cap. QR Million TTM P /E P /B Div. Yie ld Qatar National Bank 24.29 5.29 20.31 224,353 18.4 2.8 2.3 Qatar Islamic Bank 25.21 5.75 37.53 59,570 17.7 2.9 2.3 Commercial Bank of Qatar 7.90 5.76 17.05 31,973 15.6 1.8 2.0 Doha Bank 2.62 1.55 (18.13) 8,123 15.8 0.8 2.9 Al Ahli Bank 3.91 (0.76) 7.19 9,975 14.0 1.5 3.7 Qatar International Islamic Bank 12.04 8.66 30.73 18,225 20.2 2.8 3.1 Masraf Al Rayan 5.55 7.33 19.59 51,606 24.8 2.1 3.1 Qatar First Bank 1.48 0.82 (5.37) 1,128 8.1 2.1 N/A National Leasing 0.91 3.06 (3.19) 450 N/A 0.7 N/A Dlala Holding 1.65 9.79 33.63 469 54.7 2.1 N/A Qatar & Oman Investment 0.91 4.38 11.30 285 58.4 1.0 1.1 Islamic Holding Group 5.83 (0.51) 47.78 330 54.1 2.3 0.9 Ban kin g an d Fin an cial Se rvice s 406,487 Zad Holding 20.00 4.17 19.76 5,214 28.2 3.4 3.2 Qatar German Co. for Medical Devices 2.41 (0.82) (24.28) 278 239.0 8.4 N/A Salam International Investment 1.12 0.72 36.63 1,279 24.8 0.8 N/A Baladna 1.70 17.65 17.65 3,232 24.4 1.4 3.1 Medicare Group 7.03 (0.93) (17.27) 1,979 24.8 2.0 25.6 Qatar Cinema & Film Distribution 3.77 (0.19) 6.20 237 108.7 1.7 1.6 Qatar Fuel 18.25 2.07 (0.16) 18,145 18.7 2.0 4.2 Qatar Meat and Livestock 3.17 (2.37) (11.91) 570 N/A 2.1 N/A Mannai Corp. 9.11 3.47 91.76 4,154 15.1 1.9 0.1 Al Meera Consumer Goods 19.32 0.05 (1.43) 3,864 19.6 2.5 4.7 Con sum e r Goods an d Se rvice s 38,951 Qatar Industrial Manufacturing 3.11 0.29 1.30 1,478 10.7 0.9 3.9 Qatar National Cement 5.16 (0.66) 1.10 3,370 14.9 1.1 5.8 Industries Qatar 19.60 3.16 26.53 118,580 14.7 3.0 5.1 Qatari Investors Group 2.68 4.24 20.68 3,331 17.7 1.1 N/A Qatar Electricity and Water 18.07 (1.26) 8.86 19,877 13.4 1.7 4.4 Aamal 1.21 4.21 11.90 7,642 24.9 1.0 4.1 Gulf International Services 1.93 (1.73) 12.47 3,587 66.3 1.1 N/A Mesaieed Petrochemical Holding 2.88 (1.03) 37.80 36,182 19.5 2.1 3.8 Invesment Holding Group 2.54 9.80 106.92 2,111 79.6 2.5 N/A Qatar Aluminum Manufacturing 2.64 3.57 46.64 14,737 17.7 2.3 3.0 In dustrials 210,894 Qatar Insurance 2.45 1.66 (10.91) 8,002 17.1 1.0 4.1 QLM Life & Medical Insurance 5.34 2.67 5.74 1,869 17.7 3.1 4.1 Doha Insurance 1.91 (0.31) (0.52) 955 13.0 0.8 6.3 Qatar General Insurance & Reinsurance 1.99 4.46 (0.50) 1,741 18.6 0.3 N/A Al Khaleej Takaful Insurance 3.84 (4.13) 6.53 979 24.2 1.9 2.0 Qatar Islamic Insurance 8.64 (4.73) 8.00 1,296 16.0 3.2 4.6 In suran ce 14,842 United Development 1.50 2.04 (2.60) 5,311 16.3 0.5 3.7 Barwa Real Estate 3.69 5.29 20.42 14,339 12.9 0.7 4.7 Ezdan Real Estate 1.39 4.84 3.28 36,737 503.6 1.1 N/A Mazaya Qatar Real Estate Development 0.91 5.55 (0.76) 1,057 N/A 0.8 3.3 Re al Estate 57,445 Ooredoo 7.05 (0.87) 0.43 22,583 599.0 1.1 4.3 Vodafone Qatar 1.62 1.38 (3.00) 6,835 20.8 1.5 3.7 Te le com s 29,418 Qatar Navigation (Milaha) 8.40 (2.31) 9.99 9,545 13.2 0.6 3.6 Gulf Warehousing 4.30 1.51 (5.27) 252 11.2 1.2 2.3 Qatar Gas Transport (Nakilat) 3.54 (1.01) 7.39 19,635 14.4 2.2 3.4 Tran sportation 29,432 Qatar Exch an ge 789,646
- 6. qnbfs.com Contacts QNB Financial Services Co. W.L.L. Contact Center: (+974) 4476 6666 info@qnbfs.com.qa Doha, Qatar Saugata Sarkar, CFA, CAIA Head of Research saugata.sarkar@qnbfs.com.qa Shahan Keushgerian Senior Research Analyst shahan.keushgerian@qnbfs.com.qa . Disclaimer and Copyright Notice: This publication has been prepared by QNB Financial Services Co. W.L.L. (“QNBFS”) a wholly-owned subsidiary of Qatar National Bank (Q.P.S.C.). QNB FS is regulated by the Qatar Financial Markets Authority and the Qatar Exchange. Qatar National Bank (Q.P.S.C.) is regulated by the Qatar Central Bank. This publication expresses the views and opinions of QNBFS at a given time only. It is not an offer, promotion or recommendation to buy or sell securities or other investments, nor is it intended to constitute legal, tax, accounting, or financial advice. QNBFS accepts no liability whatsoever for any direct or indirect losses arising from use of this report. Any investment decision should depend on the individual circumstances of the investor and be based on specifically engaged investment advice. We therefore strongly advise potential investors to seek independent professional advice before making any investment decision. Although the information in this report has been obtained from sources that QNBFS believes to be reliable, we have not independently verified such information and it may not be accurate or complete. QNBFS does not make any representations or warranties as to the accuracy and completeness of the information it may contain, and declines any liability in that respect. For reports dealing with Technical Analysis, expressed opinions and/or recommendations may be different or contrary to the opinions/recommendations of QNBFS Fundamental Research as a result of depending solely on the historical technical data (price and volume). QNBFS reserves the right to amend the views and opinions expressed in this publication at any time. It may also express viewpoints or make investment decisions that differ significantly from, or even contradict, the views and opinions included in this report. This report may not be reproduced in whole or in part without permission from QNBFS. COPYRIGHT: No part of this document may be reproduced without the explicit written permission of QNBFS. Page 6 of 6