QNBFS Weekly Market Report May 4, 2017
•
0 likes•107 views

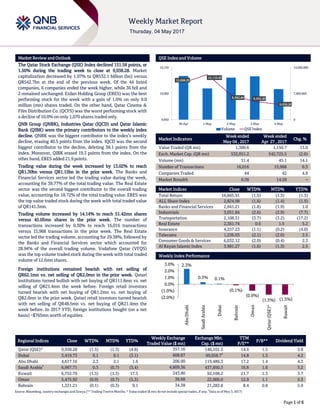
· The Qatar Stock Exchange (QSE) Index declined 151.58 points, or 1.50% during the trading week to close at 9,938.28. Market capitalization decreased by 1.97% to QR532.1 billion (bn) versus QR542.7bn at the end of the previous week. Of the 44 listed companies, 6 companies ended the week higher, while 36 fell and 2 remained unchanged. Ezdan Holding Group (ERES) was the best performing stock for the week with a gain of 1.6% on only 9.0 million (mn) shares traded. On the other hand, Qatar Cinema & Film Distribution Co. (QCFS) was the worst performing stock with a decline of 10.0% on only 1,070 shares traded only.

Recommended
Recommended
More Related Content
What's hot
What's hot (20)
Similar to QNBFS Weekly Market Report May 4, 2017
Similar to QNBFS Weekly Market Report May 4, 2017 (20)
More from QNB Group
More from QNB Group (20)
Recently uploaded
Recently uploaded (20)
QNBFS Weekly Market Report May 4, 2017
- 1. ` Page 1 of 6 Market Review and Outlook QSE Index and Volume The Qatar Stock Exchange (QSE) Index declined 151.58 points, or 1.50% during the trading week to close at 9,938.28. Market capitalization decreased by 1.97% to QR532.1 billion (bn) versus QR542.7bn at the end of the previous week. Of the 44 listed companies, 6 companies ended the week higher, while 36 fell and 2 remained unchanged. Ezdan Holding Group (ERES) was the best performing stock for the week with a gain of 1.6% on only 9.0 million (mn) shares traded. On the other hand, Qatar Cinema & Film Distribution Co. (QCFS) was the worst performing stock with a decline of 10.0% on only 1,070 shares traded only. QNB Group (QNBK), Industries Qatar (IQCD) and Qatar Islamic Bank (QIBK) were the primary contributors to the weekly index decline. QNBK was the biggest contributor to the index’s weekly decline, erasing 40.5 points from the index. IQCD was the second biggest contributor to the decline, deleting 38.1 points from the index. Moreover, QIBK erased 19.3 points from the index. On the other hand, ERES added 21.9 points. Trading value during the week increased by 13.02% to reach QR1.30bn versus QR1.15bn in the prior week. The Banks and Financial Services sector led the trading value during the week, accounting for 38.77% of the total trading value. The Real Estate sector was the second biggest contributor to the overall trading value, accounting for 18.72% of the total trading value. ERES was the top value traded stock during the week with total traded value of QR141.3mn. Trading volume increased by 14.14% to reach 51.42mn shares versus 45.05mn shares in the prior week. The number of transactions increased by 0.30% to reach 16,016 transactions versus 15,968 transactions in the prior week. The Real Estate sector led the trading volume, accounting for 29.38%, followed by the Banks and Financial Services sector which accounted for 28.94% of the overall trading volume. Vodafone Qatar (VFQS) was the top volume traded stock during the week with total traded volume of 12.6mn shares. Foreign institutions remained bearish with net selling of QR62.1mn vs. net selling of QR2.0mn in the prior week. Qatari institutions turned bullish with net buying of QR111.8mn vs. net selling of QR21.4mn the week before. Foreign retail investors turned bearish with net buying of QR1.2mn vs. net buying of QR2.0mn in the prior week. Qatari retail investors turned bearish with net selling of QR48.5mn vs. net buying of QR21.4mn the week before. In 2017 YTD, foreign institutions bought (on a net basis) ~$765mn worth of equities. Market Indicators Week ended May 04 , 2017 Week ended Apr 27 , 2017 Chg. % Value Traded (QR mn) 1,300.6 1,150.7 13.0 Exch. Market Cap. (QR mn) 532,051.2 542,725.5 (2.0) Volume (mn) 51.4 45.1 14.1 Number of Transactions 16,016 15,968 0.3 Companies Traded 44 42 4.8 Market Breadth 6:36 14:28 – Market Indices Close WTD% MTD% YTD% Total Return 16,665.91 (1.5) (1.3) (1.3) ALL Share Index 2,824.98 (1.6) (1.4) (1.5) Banks and Financial Services 2,941.21 (1.8) (1.9) 1.0 Industrials 3,051.84 (2.6) (2.9) (7.7) Transportation 2,108.31 (3.7) (3.2) (17.2) Real Estate 2,361.74 0.6 1.5 5.2 Insurance 4,257.23 (1.1) (0.2) (4.0) Telecoms 1,236.03 (2.1) (2.0) 2.5 Consumer Goods & Services 6,032.12 (2.0) (0.4) 2.3 Al Rayan Islamic Index 3,981.27 (1.6) (1.3) 2.5 Market Indices Weekly Index Performance Regional Indices Close WTD% MTD% YTD% Weekly Exchange Traded Value ($ mn) Exchange Mkt. Cap. ($ mn) TTM P/E** P/B** Dividend Yield Qatar (QSE)* 9,938.28 (1.5) (1.3) (4.8) 357.16 146,101.3 14.9 1.5 3.8 Dubai 3,419.73 0.1 0.1 (3.1) 608.87 99,058.7# 14.8 1.3 4.2 Abu Dhabi 4,617.16 2.3 2.1 1.6 206.00 119,486.3 17.2 1.4 4.3 Saudi Arabia# 6,967.71 0.3 (0.7) (3.4) 4,809.36 437,850.3 16.8 1.6 3.2 Kuwait 6,752.79 (1.5) (1.3) 17.5 243.80 92,108.2 21.7 1.3 3.7 Oman 5,475.92 (0.9) (0.7) (5.3) 36.68 22,006.0 12.9 1.1 5.3 Bahrain 1,331.21 (0.1) (0.3) 9.1 34.38 21,283.8 8.4 0.8 5.9 Source: Bloomberg, country exchanges and Zawya (** Trailing Twelve Months; * Value traded ($ mn) do not include special trades, if any; # Data as of May 3, 2017) 10,064.35 10,110.45 9,992.84 9,955.40 9,938.28 0 7,000,000 14,000,000 9,850 10,000 10,150 30-Apr 1-May 2-May 3-May 4-May Volume QSE Index 2.3% 0.3% 0.1% (0.1%) (0.9%) (1.5%) (1.5%)(2.0%) (1.0%) 0.0% 1.0% 2.0% 3.0% AbuDhabi SaudiArabia Dubai Bahrain Oman Qatar(QSE)* Kuwait
- 2. Page 2 of 6 News Economic & Corporate News Qatar Central Bank sells Treasury bills worth QR1.55bn – The Qatar Central Bank (QCB) said on May 3, 2017 that it had sold QR1.55bn of Treasury bills in a monthly auction, with the yield curve steepening from the previous month. It sold QR800mn of 3-month bills at 1.94%, QR500mn of 6-month bills at 2.07% and QR250mn of 9-month bills at 2.17%. (Zawya) QNB Group: Oil market likely to rebalance in 2017 – The oil market is expected to rebalance in 2017 and oil price is likely to be at $55 per barrel. Production cuts are likely to be extended, but even if they are not, aggregate world oil supply will probably remain largely unaffected, QNB Group noted in its report. “An extension to the OPEC agreement is becoming increasingly likely. Discussions between producers have moved in favor of extending. The Saudi oil Minister recently said that OPEC and non-OPEC producers were close to reaching a deal to extend the cuts. Additionally, an extension to the agreement would sustain prices at the current level or higher,” said the report. However, there are also arguments against extending. The lack of compliance with last year’s deal among non-OPEC producers might make it difficult to broker a new deal. Furthermore, the production cuts have handed a lifeline to US producers, which have managed to increase production in response, grabbing market share. (Peninsula Qatar) ERES' bottom line rises to QR945.97mn in 1Q2017 – Ezdan Holding Group's (ERES) net profit rose 82.1% QoQ (+61.5% YoY) to QR945.97mn in 1Q2017 driven by a surge in net gains in AFS. Earnings per share (EPS) increased to QR0.36 in 1Q2017 from QR0.22 in 1Q2016. ERES’ CEO Ali Mohamed al- Obaidli said, “The remarkable results for this quarter are very promising. We are well confident that the year 2017 will witness full operation of all Ezdan projects and ventures.” Highlighting the first phase of Ezdan Oasis project, a company spokesman said the first phase consists of a total 2,058 residential, commercial and administrative units. During this phase, it is planned to open up to 180 commercial units, which would include restaurants, cafes and vital facilities. Al-Obaidli described Ezdan Oasis project, which consists of up to 9,346 housing units, as the most important project among its portfolio in the realty sector because it targets a population of at least 35,000 people, who will be able to enjoy the development witnessed in Al Wakrah area. Ezdan Oasis dwellers would benefit from diverse services provided by the company through its commercial centers such as Wukair and Al Wakrah Malls. During the current year, the group intends to fully open Ezdan Malls Al Wakrah and Al Wukair. Ezdan is now gearing up for the opening of the Curve Hotel in the coming period. The hotel consists of 24 floors and includes 600 hotel apartments, sprawling over 6,788 square meters and overlooking the West Bay. The group is also preparing to finalize Ezdan Palace Hotel, its fully owned hotel. It is the group’s first five-star hotel, located on Al Shamal Road, featuring up to 194 hotel rooms and suites. (QSE, Gulf- Times.com) MPHC’s net profit declines to ~QR212mn in 1Q2017 – Mesaieed Petrochemical Holding Company (MPHC) reported net profit of ~QR212mn in 1Q2017 as compared to QR279mn in 4Q2016. On YoY basis, net profit was flat. Earnings per share (EPS) also remained flat YoY at QR0.17 in 1Q2017. The company, a holding entity with interests in production of olefins, polyolefin, alpha olefins and chlor-alkali, witnessed lower sales volumes on periodic turnaround in some of the group companies’ plants, but was offset by the increase in the selling prices. A MPHC spokesman said, “The 1Q2017 financial performance exceeded the group’s budget expectations by over 42%.” The group’s profit for the quarter was also aided by recognition of a tax refund of approximately QR18mn. It continued to benefit from the supply of competitively priced ethane feedstock and fuel gas under long-term supply agreements. The spokesman said, “This contracting arrangement is an important value driver for the group profitability in a challenging market condition.” The company also witnessed QR191.29mn as share of profit from joint ventures and QR7.42mn from other income, even as its general and administrative expenses were QR4.39mn in 1Q2017. The closing cash position after the first three months of operations and QR697.9mn dividend payout for the previous year, stood at a robust QR721.8mn as on March 31, 2017. The company’s total assets were valued at QR13.91bn, comprising current assets of QR0.83bn and non-current assets of QR13.08bn. Total equity stood at QR13.74bn on a capital base of QR12.56bn at the end of March 31, 2017. (QSE, Gulf-Times.com) QIMD posts higher net profit of QR60.44mn despite lower sales in 1Q2017 – Qatar Industrial Manufacturing Company’s (QIMD) net profit rose 96.8% QoQ (+10.1% YoY) to QR60.44mn in 1Q2017. On YoY basis, net income was boosted by rise in other income to QR6.30mn in 1Q2017 compared to QR0.85mn in 1Q2016. However, sales fell sharply to QR110.48mn (-61.9% QoQ and -45.7% YoY) in 1Q2017. Earnings per share (EPS) increased to QR1.27 in 1Q2017 from QR1.16 in 1Q2016. (QSE) NLCS reports net profit of QR0.71mn in 1Q2017 – Alijarah Holding (NLCS) reported sharp rise in net profit to QR0.71mn in 1Q2017 as compared to QR0.11mn in 4Q2016. However, on YoY basis net profit fell 66.4%. The company's total Income came in at QR38.70mn in 1Q2017, registering a decline of 19% QoQ (-30.4% YoY). Earnings per share (EPS) fell to QR0.01 in 1Q2017 from QR0.04 in 1Q2016. (QSE) AKHI reports QR13.87mn net profit in 1Q2017 – Al Khaleej Takaful Group (AKHI) recorded net profit of QR13.87mn in 1Q2017 as compared to net loss of QR5.31mn in 4Q2016. On YoY basis, net profit fell 2.1%. Earnings per share (EPS) amounted to QR0.54 in 1Q2017 as compared to QR0.55 in 1Q2016. (QSE) SIIS’ net profit declines to ~QR20.4mn in 1Q2017 – Salam International Investment Limited’s (SIIS) net profit declined to ~QR20.4mn in 1Q2017 from QR44.0mn in 4Q2016 and QR32.1mn in 1Q2016. EPS amounted to QR0.18 in 1Q2017 as compared to QR0.28 in 1Q2016. (QSE) ZHCD reports net profit of ~QR49.25mn in 1Q2017 – Zad Holding Company (ZHCD) reported net profit of ~QR49.25mn in 1Q2017 as compared to QR24.60mn in 4Q2016 and QR51.67mn in 1Q2016. EPS amounted to QR2.29 in 1Q2017 as compared to QR2.40 in 1Q2016. (QSE)
- 3. Page 3 of 6 Qatar Stock Exchange Top Gainers Top Decliners Source: Qatar Stock Exchange (QSE) Source: Qatar Stock Exchange (QSE) Most Active Shares by Value (QR Million) Most Active Shares by Volume (Million) Source: Qatar Stock Exchange (QSE) Source: Qatar Stock Exchange (QSE) Investor Trading Percentage to Total Value Traded Net Traded Value by Nationality (QR Million) Source: Qatar Stock Exchange (QSE) Source: Qatar Stock Exchange (QSE) 1.6% 1.3% 1.0% 0.3% 0.2% 0.0% 0.6% 1.2% 1.8% Ezdan Real Estate Al Khaliji Qatar Islamic Insurance Doha Bank Masraf Al Rayan -9.9% -5.4% -5.0% -4.1% -3.7% -12.0% -8.0% -4.0% 0.0% QatarCinema& FilmDistribution QatarNational Cement Milaha Al AhliBank Industries Qatar 141.3 117.5 105.1 97.8 95.8 0.0 50.0 100.0 150.0 Ezdan Real Estate Vodafone Qatar Commercial Bank of Qatar Industries Qatar Dlala Holding 12.6 9.1 4.6 3.8 3.5 0.0 5.0 10.0 15.0 Vodafone Qatar Ezdan Real Estate Mazaya Qatar Dlala Holding Commercial Bank of Qatar 0% 20% 40% 60% 80% 100% Buy Sell 43.40% 47.13% 28.56% 19.96% 9.47% 9.57% 18.57% 23.34% Qatari Individuals Qatari Institutions Non-Qatari Individuals Non-Qatari Institutions 936 365 873 428 63 (63) (200) - 200 400 600 800 1,000 Qatari Non-Qatari Net Investment Total Sold Total Bought
- 4. Page 4 of 6 TECHNICAL ANALYSIS OF THE QSE INDEX Source: Bloomberg The QSE index fell 1.5% during the week to a level of 9,938.28. On the weekly chart, the index has been trending down for the past few weeks indicating weakness. MACD line went below the signal line indicating a downside. Our support level remains at 9,500 and resistance level remains at 10,500. DEFINITIONS OF KEY TERMS USED IN TECHNICAL ANALYSIS RSI (Relative Strength Index) indicator – RSI is a momentum oscillator that measures the speed and change of price movements. The RSI oscillates between 0 to 100. The index is deemed to be overbought once the RSI approaches the 70 level, indicating that a correction is likely. On the other hand, if the RSI approaches 30, it is an indication that the index may be getting oversold and therefore likely to bounce back. MACD (Moving Average Convergence Divergence) indicator – The indicator consists of the MACD line and a signal line. The divergence or the convergence of the MACD line with the signal line indicates the strength in the momentum during the uptrend or downtrend, as the case may be. When the MACD crosses the signal line from below and trades above it, it gives a positive indication. The reverse is the situation for a bearish trend. Candlestick chart – A candlestick chart is a price chart that displays the high, low, open, and close for a security. The ‘body’ of the chart is portion between the open and close price, while the high and low intraday movements form the ‘shadow’. The candlestick may represent any time frame. We use a one-day candlestick chart (every candlestick represents one trading day) in our analysis. Doji candlestick pattern – A Doji candlestick is formed when a security's open and close are practically equal. The pattern indicates indecisiveness, and based on preceding price actions and future confirmation, may indicate a bullish or bearish trend reversal. Shooting Star/Inverted Hammer candlestick patterns – These candlestick patterns have a small real body (open price and close price are near to each other), and a long upper shadow (large intraday movement on the upside). The Shooting Star is a bearish reversal pattern that forms after a rally. The Inverted Hammer looks exactly like a Shooting Star, but forms after a downtrend. Inverted Hammers represent a potential bullish trend reversal.
- 5. Page 5 of 6 Source: Bloomberg Company Name Price May 04 % Change WTD % Change YTD Market Cap. QR Million TTM P/E P/B Div. Yield Qatar National Bank 140.00 (2.64) (5.46) 129,310 10.4 2.2 2.3 Qatar Islamic Bank 98.00 (2.97) (5.68) 23,157 11.3 1.7 4.8 Commercial Bank of Qatar 29.80 (0.50) (3.72) 12,061 94.5 0.7 N/M Doha Bank 31.40 0.32 (6.82) 8,113 9.8 0.9 9.2 Al Ahli Bank 34.00 (4.09) (8.46) 6,812 10.7 1.4 2.8 Qatar International Islamic Bank 60.70 (3.34) (3.34) 9,188 11.5 1.3 6.6 Masraf Al Rayan 41.95 0.24 11.57 31,463 15.4 2.7 4.8 Al Khalij Commercial Bank 14.82 1.30 (12.82) 5,335 12.3 0.8 5.1 Qatar First Bank 8.49 (0.70) (17.57) 1,698 N/M 0.9 N/M National Leasing 16.65 (3.31) 8.68 824 231.7 0.8 3.0 Dlala Holding 25.05 0.20 16.57 712 52.5 2.7 N/M Qatar & Oman Investment 9.40 (1.36) (5.53) 296 26.5 1.0 5.3 Islamic Holding Group 60.60 (0.66) (0.66) 343 65.7 2.5 1.6 Banking and Financial Services 229,311 Zad Holding 72.70 (2.55) (18.50) 951 9.5 1.1 6.2 Qatar German Co. for Medical Devices 9.25 (1.49) (8.42) 107 N/M 1.4 N/M Salam International Investment 10.26 (2.29) (7.15) 1,173 11.4 0.7 7.8 Medicare Group 96.30 (0.72) 53.10 2,710 39.3 2.8 1.9 Qatar Cinema & Film Distribution 32.35 (9.89) 17.85 203 53.0 1.6 3.1 Qatar Fuel 124.90 (2.42) (6.37) 12,418 15.2 1.8 5.1 Widam Food Co. 61.80 (3.44) (9.12) 1,112 N/M 4.3 5.7 Mannai Corp. 78.00 (0.64) (2.50) 3,558 7.1 1.4 5.1 Al Meera Consumer Goods 153.50 (2.17) (12.54) 3,070 16.1 2.4 5.9 Consumer Goods and Services 25,303 Qatar Industrial Manufacturing 43.30 (0.35) (2.70) 2,058 10.3 1.4 6.9 Qatar National Cement 71.50 (5.42) (8.55) 4,673 10.7 1.6 5.1 Industries Qatar 100.40 (3.74) (14.55) 60,742 19.1 1.9 4.0 Qatari Investors Group 56.30 (1.23) (3.76) 7,000 24.4 2.8 1.8 Qatar Electricity and Water 204.60 (1.63) (9.87) 22,506 14.6 2.8 3.7 Aamal 13.24 (0.15) (2.86) 8,341 18.7 1.0 4.5 Gulf International Services 24.95 (2.54) (19.77) 4,637 1495.3 1.3 4.0 Mesaieed Petrochemical Holding 14.52 (2.88) (8.10) 18,242 18.3 1.3 4.1 Industrials 128,198 Qatar Insurance 70.10 (1.27) (4.94) 19,439 18.8 2.0 1.9 Doha Insurance 16.27 (3.38) (10.60) 814 10.5 0.8 3.7 Qatar General Insurance & Reinsurance 39.10 0.00 (16.81) 3,422 16.4 0.5 3.8 Al Khaleej Takaful Insurance 20.00 0.00 (5.21) 511 39.8 0.9 3.0 Qatar Islamic Insurance 61.50 0.99 21.54 923 14.4 2.9 5.7 Insurance 25,107 United Development 19.10 (0.47) (7.51) 6,763 11.4 0.6 6.5 Barw a Real Estate 33.35 (1.91) 0.30 12,977 9.0 0.7 7.5 Ezdan Real Estate 15.55 1.63 2.91 41,246 18.8 1.3 3.2 Mazaya Qatar Real Estate Development 12.41 (1.90) (9.45) 1,437 27.1 1.0 N/M Real Estate 62,423 Ooredoo 101.70 (2.02) (0.10) 32,577 17.2 1.5 3.4 Vodafone Qatar 9.20 (2.44) (1.81) 7,778 N/M 1.6 N/M Telecoms 40,354 Qatar Navigation (Milaha) 67.00 (4.96) (29.92) 7,673 12.8 0.5 5.2 Gulf Warehousing 51.00 (2.86) (8.93) 2,989 14.2 2.0 3.1 Qatar Gas Transport (Nakilat) 19.30 (3.02) (16.41) 10,693 11.8 2.2 5.2 Transportation 21,355 Qatar Exchange 532,051
- 6. Contacts Saugata Sarkar Shahan Keushgerian Zaid al-Nafoosi , CMT, CFTe Head of Research Senior Research Analyst Senior Research Analyst Tel: (+974) 4476 6534 Tel: (+974) 4476 6509 Tel: (+974) 4476 6535 saugata.sarkar@qnbfs.com.qa shahan.keushgerian@qnbfs.com.qa zaid.alnafoosi@qnbfs.com.qa Mohamed Abo Daff QNB Financial Services Co. W.L.L. Senior Research Analyst Contact Center: (+974) 4476 6666 Tel: (+974) 4476 6589 PO Box 24025 mohd.abodaff@qnbfs.com.qa Doha, Qatar Disclaimer and Copyright Notice: This publication has been prepared by QNB Financial Services Co. W.L.L. (“QNBFS”) a wholly-owned subsidiary of Qatar National Bank (Q.P.S.C.). QNBFS is regulated by the Qatar Financial Markets Authority and the Qatar Exchange. Qatar National Bank (Q.P.S.C.) is regulated by the Qatar Central Bank. This publication expresses the views and opinions of QNBFS at a given time only. It is not an offer, promotion or recommendation to buy or sell securities or other investments, nor is it intended to constitute legal, tax, accounting, or financial advice. QNBFS accepts no liability whatsoever for any direct or indirect losses arising from use of this report. Any investment decision should depend on the individual circumstances of the investor and be based on specifically engaged investment advice. We therefore strongly advise potential investors to seek independent professional advice before making any investment decision. Although the information in this report has been obtained from sources that QNBFS believes to be reliable, we have not independently verified such information and it may not be accurate or complete. QNBFS does not make any representations or warranties as to the accuracy and completeness of the information it may contain, and declines any liability in that respect. For reports dealing with Technical Analysis, expressed opinions and/or recommendations may be different or contrary to the opinions/recommendations of QNBFS Fundamental Research as a result of depending solely on the historical technical data (price and volume). QNBFS reserves the right to amend the views and opinions expressed in this publication at any time. It may also express viewpoints or make investment decisions that differ significantly from, or even contradict, the views and opinions included in this report. This report may not be reproduced in whole or in part without permission from QNBFS COPYRIGHT: No part of this document may be reproduced without the explicit written permission of QNBFS. Page 6 of 6