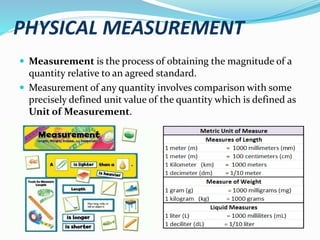
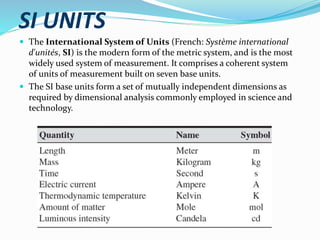
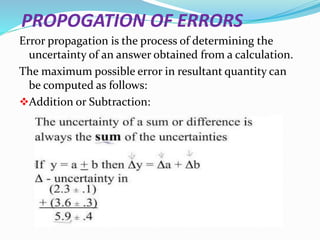
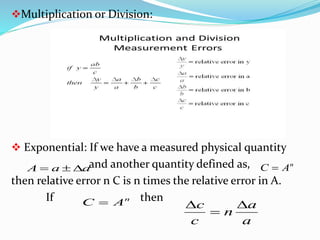
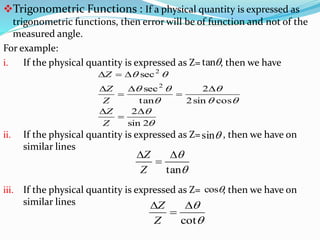
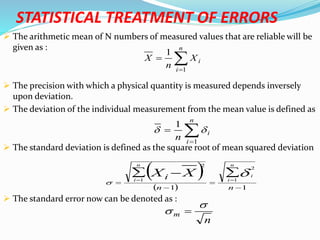
This document discusses physical measurement and errors in measurement. It defines key terms like measurement, units, observations, and least count. It describes the International System of Units (SI) as the modern metric system. It also discusses different types of errors like absolute error and relative error. Systematic errors can be corrected while random errors are reduced by taking multiple measurements. Accuracy refers to systematic errors while precision describes random errors. The document outlines methods to calculate propagation of errors and statistical treatment of error values.


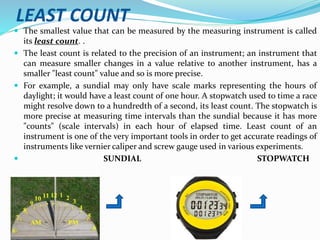


![[Deck] What's New in Spark-Iceberg Integration via DSV2.pptx](https://cdn.slidesharecdn.com/ss_thumbnails/deckwhatsnewinspark-icebergintegrationviadsv2-260210005337-25955b12-thumbnail.jpg?width=640&height=640&fit=bounds)
