Recommended

Recommended
More Related Content
What's hot
What's hot (20)
Similar to Augmentation of Quality Assurance in Radiation Therapy
Similar to Augmentation of Quality Assurance in Radiation Therapy (20)
Recently uploaded
Recently uploaded (20)
Augmentation of Quality Assurance in Radiation Therapy
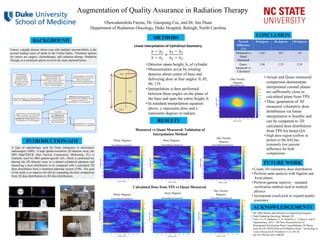
- 1. Augmentation of Quality Assurance in Radiation Therapy Oluwadamilola Fasina, Dr. Guoqiang Cui, and Dr. Jun Duan Department of Radiation Oncology, Duke Hospital, Raleigh, North Carolina INTRODUCTION/AIM METHODS BACKGROUND FUTURE WORK CONCLUSION Cancer, a deadly disease where your cells multiply uncontrollably, is the second leading cause of death in the United States. Treatment options for cancer are surgery, chemotherapy, and radiation therapy. Radiation Therapy as a treatment option involves the steps depicted below. A type of radiotherapy used for brain metastases is stereotactic radiosurgery (SRS). A high spatial-resolution 2D detector array, the SRS MapCHECK (Sun Nuclear Corporation, Melbourne, FL) is routinely used for SRS patient-specific QA, which is performed by placing the 2D detector array in a domed cylindrical phantom and measuring a dose distribution to be compared with a calculated 2D dose distribution from a treatment planning system (TPS). The goal of the study is to improve the QA by expanding the dose comparison from 2D dose distributions to 3D dose distributions. Linear Interpolation of Cylindrical Geometry Measured vs Quasi Measured: Validation of Interpolation Method Calculated Dose from TPS vs Quasi Measured ACKNOWLEDGEMENTS 𝑦 − 𝑦1 𝑥 − 𝑥1 = 𝑦2 − 𝑦1 𝑥2 − 𝑥1 • Detector spans height, h, of cylinder • Measurements occur by rotating detector about center of base and delivering dose at four angles: 0, 45, 90, 135. • Interpolation is then performed between these angles on the plane of the base and span the entire height, h. • In standard interpolation equation above, y represents dose and x represents degrees in radians. One Twenty DegreesSixty DegreesThirty Degrees RESULTS Thirty Degrees One Twenty DegreesSixty Degrees Percent Difference (%) 30 degrees 60 degrees 120 degrees Measured vs Quasi Measured 1.627 .827 .63 Quasi- measured vs Calculated 2.68 1.23 2.34 • Actual and Quasi measured comparison demonstrate interpolated coronal planes are sufficiently close to calculated plans from TPS. • Thus, generation of 3D measured volumetric dose distribution via linear interpolation is feasible and can be compared to 3D calculated dose distribution from TPS for better QA • High dose region (yellow in picture to the left) has extremely low percent difference for both comparisons. • Create 3D volumetric dose distribution • Perform same analysis with Sagittal and Axial planes • Perform gamma analysis – standard verification method used in medical physics • Incorporate couch kick to expand quality assurance • NC State Women and Minority in Engineering Program • Duke Radiation Oncology, Raleigh, NC • Calvo, O., S. Stathakis, A. N. Gutiérrez, C. Esquivel, and N. Papanikolaou. 2012. “3D Dose Reconstruction of Pretreatment Verification Plans Using Multiple 2D Planes from the OCTAVIUS/Seven29 Phantom Array.” Technology in Cancer Research & Treatment 11 (1): 69–82. doi:10.7785/tcrt.2012.500236 One Twenty Degrees