SlideShare a Scribd company logo
1 of 4
1. Understand the Problem The
first step is to read the problem
carefully until it is clearly
understood. Ask yourself: What
is the unknown? What are the
given quantities?
What are the given conditions?
2. Draw a Diagram In most
problems it is useful to draw a
diagram and identify the
given and required quantities on
the diagram.
3. Introduce Notation Assign a
symbol to the quantity that is to
be maximized or minimized (let´s
call Q for now). Also select
symbols (a, b, c, …,x, y) for other
unknown quantities and label
the diagram with these symbols.
It may help to use
initials as suggestive symbols—
for example, A for area, h for
height, t for time.
4. Express Q in terms of some of
the other symbols from Step 3.
5. If Q has been expressed as a
function of more than one
variable in Step 4, use the
given information to find
relationships (in the form of
equations) among these
variables. Then use these
equations to eliminate all but
one of the variables in the
expression for Q. Thus Q will be
expressed as a function of one
variable x, say, Q=f(x).
Write the domain of this
function.
6. Use the derivative to find the
absolute maximum or minimum
value of . In particular.
1. Understand the Problem The first step is
to read the problem carefully until it is
clearly understood. Ask yourself: What is
the unknown? What are the given
quantities? What are the given conditions?
2. Draw a Diagram In most problems it is useful to draw a diagram
and identify the given and required quantities on the diagram.
3. Introduce Notation Assign a symbol to the quantity that is to be
maximized or minimized (let´s call Q for now). Also select symbols (a, b, c,
…,x, y) for other unknown quantities and label the diagram with these
symbols. It may help to use initials as suggestive symbols—for example, A for
area, h for height, t for time.
4. Express Q in terms of some of the other symbols from Step 3.
5. If Q has been expressed as a function of more than one variable in Step 4,
use the given information to find relationships (in the form of equations)
among these variables. Then use these equations to eliminate all but one of
the variables in the expression for Q. Thus Q will be expressed as a function of
one variable x, say, Q=f(x). Write the domain of this function.
6. Use the derivative to find the absolute maximum or minimum value of . In
particular.
2. A farmer has 2400 ft of
fencing and wants to fence off a
rectangular field that borders a
straight river. He needs no fence
along the river. What are the
dimensions of the field that has
the largest area?
1. Understand the Problem The first step is
to read the problem carefully until it is
clearly understood. Ask yourself: What is
the unknown? What are the given
quantities? What are the given conditions?
2. Draw a Diagram In most problems it is useful to draw a diagram
and identify the given and required quantities on the diagram.
3. Introduce Notation Assign a symbol to the quantity that is to be
maximized or minimized (let´s call Q for now). Also select symbols (a, b, c,
…,x, y) for other unknown quantities and label the diagram with these
symbols. It may help to use initials as suggestive symbols—for example, A for
area, h for height, t for time.
4. Express Q in terms of some of the other symbols from Step 3.
5. If Q has been expressed as a function of more than one variable in Step 4,
use the given information to find relationships (in the form of equations)
among these variables. Then use these equations to eliminate all but one of
the variables in the expression for Q. Thus Q will be expressed as a function of
one variable x, say, Q=f(x). Write the domain of this function.
6. Use the derivative to find the absolute maximum or minimum value of . In
particular.
3.Find two numbers whose
difference is 100 and whose
product is a minimum.
1. Understand the Problem The first step is
to read the problem carefully until it is
clearly understood. Ask yourself: What is
the unknown? What are the given
quantities? What are the given conditions?
2. Draw a Diagram In most problems it is useful to draw a diagram
and identify the given and required quantities on the diagram.
3. Introduce Notation Assign a symbol to the quantity that is to be
maximized or minimized (let´s call Q for now). Also select symbols (a, b, c,
…,x, y) for other unknown quantities and label the diagram with these
symbols. It may help to use initials as suggestive symbols—for example, A for
area, h for height, t for time.
4. Express Q in terms of some of the other symbols from Step 3.
5. If Q has been expressed as a function of more than one variable in Step 4,
use the given information to find relationships (in the form of equations)
among these variables. Then use these equations to eliminate all but one of
the variables in the expression for Q. Thus Q will be expressed as a function of
one variable x, say, Q=f(x). Write the domain of this function.
6. Use the derivative to find the absolute maximum or minimum value of . In
particular.
4. Find the dimensions of a
rectangle with perimeter 100
m whose area is as large as
possible.

More Related Content

What's hot

AP Calculus January 15, 2009
AP Calculus January 15, 2009AP Calculus January 15, 2009
AP Calculus January 15, 2009Darren Kuropatwa
 
Algorithm chapter 11
Algorithm chapter 11Algorithm chapter 11
Algorithm chapter 11chidabdu
 
Matlab lecture 7 – regula falsi or false position method@taj
Matlab lecture 7 – regula falsi or false position method@tajMatlab lecture 7 – regula falsi or false position method@taj
Matlab lecture 7 – regula falsi or false position method@tajTajim Md. Niamat Ullah Akhund
 
5.5 back tracking
5.5 back tracking5.5 back tracking
5.5 back trackingKrish_ver2
 
Concepts of Maxima And Minima
Concepts of Maxima And MinimaConcepts of Maxima And Minima
Concepts of Maxima And MinimaJitin Pillai
 
Analysis and design of algorithms part 4
Analysis and design of algorithms part 4Analysis and design of algorithms part 4
Analysis and design of algorithms part 4Deepak John
 
Cs6402 design and analysis of algorithms may june 2016 answer key
Cs6402 design and analysis of algorithms may june 2016 answer keyCs6402 design and analysis of algorithms may june 2016 answer key
Cs6402 design and analysis of algorithms may june 2016 answer keyappasami
 
The n Queen Problem
The n Queen ProblemThe n Queen Problem
The n Queen ProblemSukrit Gupta
 

What's hot (20)

Chapter 3 ds
Chapter 3 dsChapter 3 ds
Chapter 3 ds
 
Computer algebra-system-maple
Computer algebra-system-mapleComputer algebra-system-maple
Computer algebra-system-maple
 
Function and graphs
Function and graphsFunction and graphs
Function and graphs
 
Maple
MapleMaple
Maple
 
AP Calculus January 15, 2009
AP Calculus January 15, 2009AP Calculus January 15, 2009
AP Calculus January 15, 2009
 
Algorithm chapter 11
Algorithm chapter 11Algorithm chapter 11
Algorithm chapter 11
 
Unit 1.7
Unit 1.7Unit 1.7
Unit 1.7
 
Visual Techniques
Visual TechniquesVisual Techniques
Visual Techniques
 
Unit 2.4
Unit 2.4Unit 2.4
Unit 2.4
 
Unit 2.6
Unit 2.6Unit 2.6
Unit 2.6
 
Matlab lecture 7 – regula falsi or false position method@taj
Matlab lecture 7 – regula falsi or false position method@tajMatlab lecture 7 – regula falsi or false position method@taj
Matlab lecture 7 – regula falsi or false position method@taj
 
5.5 back tracking
5.5 back tracking5.5 back tracking
5.5 back tracking
 
Concepts of Maxima And Minima
Concepts of Maxima And MinimaConcepts of Maxima And Minima
Concepts of Maxima And Minima
 
Shape Analysis
Shape AnalysisShape Analysis
Shape Analysis
 
Analysis and design of algorithms part 4
Analysis and design of algorithms part 4Analysis and design of algorithms part 4
Analysis and design of algorithms part 4
 
Unit 2.5
Unit 2.5Unit 2.5
Unit 2.5
 
Unit 2.8
Unit 2.8Unit 2.8
Unit 2.8
 
Cs6402 design and analysis of algorithms may june 2016 answer key
Cs6402 design and analysis of algorithms may june 2016 answer keyCs6402 design and analysis of algorithms may june 2016 answer key
Cs6402 design and analysis of algorithms may june 2016 answer key
 
Unit 2.1
Unit 2.1Unit 2.1
Unit 2.1
 
The n Queen Problem
The n Queen ProblemThe n Queen Problem
The n Queen Problem
 

Similar to Ruta solucion de problemas

Function notation by sadiq
Function notation by sadiqFunction notation by sadiq
Function notation by sadiqSadiq Hussain
 
Essay On Linear Function
Essay On Linear FunctionEssay On Linear Function
Essay On Linear FunctionAngie Lee
 
Edsc 304 lesson 1
Edsc 304 lesson 1Edsc 304 lesson 1
Edsc 304 lesson 1urenaa
 
Lesson 1
Lesson 1Lesson 1
Lesson 1urenaa
 
Lesson 1
Lesson 1Lesson 1
Lesson 1urenaa
 
REPRESENTATION OF FUNCTIONS.pptx
REPRESENTATION OF FUNCTIONS.pptxREPRESENTATION OF FUNCTIONS.pptx
REPRESENTATION OF FUNCTIONS.pptxGiezerAgamata1
 
Introduction to Functions of Several Variables
Introduction to Functions of Several VariablesIntroduction to Functions of Several Variables
Introduction to Functions of Several VariablesNhan Nguyen
 
MTH 2001 Project 2Instructions• Each group must choos.docx
MTH 2001 Project 2Instructions• Each group must choos.docxMTH 2001 Project 2Instructions• Each group must choos.docx
MTH 2001 Project 2Instructions• Each group must choos.docxgilpinleeanna
 
3 1 Quadratic Functions
3 1 Quadratic Functions3 1 Quadratic Functions
3 1 Quadratic Functionssilvia
 
Parametric Equations with Mathcad Prime
Parametric Equations with Mathcad PrimeParametric Equations with Mathcad Prime
Parametric Equations with Mathcad PrimeCaroline de Villèle
 
How to combine interpolation and regression graphs in R
How to combine interpolation and regression graphs in RHow to combine interpolation and regression graphs in R
How to combine interpolation and regression graphs in RDougLoqa
 

Similar to Ruta solucion de problemas (20)

Function notation by sadiq
Function notation by sadiqFunction notation by sadiq
Function notation by sadiq
 
Essay On Linear Function
Essay On Linear FunctionEssay On Linear Function
Essay On Linear Function
 
Math 116 pres. 5
Math 116 pres. 5Math 116 pres. 5
Math 116 pres. 5
 
Edsc 304 lesson 1
Edsc 304 lesson 1Edsc 304 lesson 1
Edsc 304 lesson 1
 
Introduction to R
Introduction to RIntroduction to R
Introduction to R
 
Lesson 1
Lesson 1Lesson 1
Lesson 1
 
Functions
FunctionsFunctions
Functions
 
Statistics lab 1
Statistics lab 1Statistics lab 1
Statistics lab 1
 
Lesson 1
Lesson 1Lesson 1
Lesson 1
 
REPRESENTATION OF FUNCTIONS.pptx
REPRESENTATION OF FUNCTIONS.pptxREPRESENTATION OF FUNCTIONS.pptx
REPRESENTATION OF FUNCTIONS.pptx
 
Advance algebra
Advance algebraAdvance algebra
Advance algebra
 
17481 1235049029519454-2
17481 1235049029519454-217481 1235049029519454-2
17481 1235049029519454-2
 
Introduction to Functions of Several Variables
Introduction to Functions of Several VariablesIntroduction to Functions of Several Variables
Introduction to Functions of Several Variables
 
1.6 all notes
1.6 all notes1.6 all notes
1.6 all notes
 
Lecture co4 math21-1
Lecture co4 math21-1Lecture co4 math21-1
Lecture co4 math21-1
 
MTH 2001 Project 2Instructions• Each group must choos.docx
MTH 2001 Project 2Instructions• Each group must choos.docxMTH 2001 Project 2Instructions• Each group must choos.docx
MTH 2001 Project 2Instructions• Each group must choos.docx
 
3 1 Quadratic Functions
3 1 Quadratic Functions3 1 Quadratic Functions
3 1 Quadratic Functions
 
variables_expressions
variables_expressionsvariables_expressions
variables_expressions
 
Parametric Equations with Mathcad Prime
Parametric Equations with Mathcad PrimeParametric Equations with Mathcad Prime
Parametric Equations with Mathcad Prime
 
How to combine interpolation and regression graphs in R
How to combine interpolation and regression graphs in RHow to combine interpolation and regression graphs in R
How to combine interpolation and regression graphs in R
 

Recently uploaded

Spring gala 2024 photo slideshow - Celebrating School-Community Partnerships
Spring gala 2024 photo slideshow - Celebrating School-Community PartnershipsSpring gala 2024 photo slideshow - Celebrating School-Community Partnerships
Spring gala 2024 photo slideshow - Celebrating School-Community Partnershipsexpandedwebsite
 
會考英文會考英文會考英文會考英文會考英文會考英文會考英文會考英文會考英文會考英文會考英文
會考英文會考英文會考英文會考英文會考英文會考英文會考英文會考英文會考英文會考英文會考英文會考英文會考英文會考英文會考英文會考英文會考英文會考英文會考英文會考英文會考英文會考英文
會考英文會考英文會考英文會考英文會考英文會考英文會考英文會考英文會考英文會考英文會考英文中 央社
 
Stl Algorithms in C++ jjjjjjjjjjjjjjjjjj
Stl Algorithms in C++ jjjjjjjjjjjjjjjjjjStl Algorithms in C++ jjjjjjjjjjjjjjjjjj
Stl Algorithms in C++ jjjjjjjjjjjjjjjjjjMohammed Sikander
 
e-Sealing at EADTU by Kamakshi Rajagopal
e-Sealing at EADTU by Kamakshi Rajagopale-Sealing at EADTU by Kamakshi Rajagopal
e-Sealing at EADTU by Kamakshi RajagopalEADTU
 
OSCM Unit 2_Operations Processes & Systems
OSCM Unit 2_Operations Processes & SystemsOSCM Unit 2_Operations Processes & Systems
OSCM Unit 2_Operations Processes & SystemsSandeep D Chaudhary
 
PSYPACT- Practicing Over State Lines May 2024.pptx
PSYPACT- Practicing Over State Lines May 2024.pptxPSYPACT- Practicing Over State Lines May 2024.pptx
PSYPACT- Practicing Over State Lines May 2024.pptxMarlene Maheu
 
ANTI PARKISON DRUGS.pptx
ANTI         PARKISON          DRUGS.pptxANTI         PARKISON          DRUGS.pptx
ANTI PARKISON DRUGS.pptxPoojaSen20
 
Basic Civil Engineering notes on Transportation Engineering & Modes of Transport
Basic Civil Engineering notes on Transportation Engineering & Modes of TransportBasic Civil Engineering notes on Transportation Engineering & Modes of Transport
Basic Civil Engineering notes on Transportation Engineering & Modes of TransportDenish Jangid
 
Đề tieng anh thpt 2024 danh cho cac ban hoc sinh
Đề tieng anh thpt 2024 danh cho cac ban hoc sinhĐề tieng anh thpt 2024 danh cho cac ban hoc sinh
Đề tieng anh thpt 2024 danh cho cac ban hoc sinhleson0603
 
MOOD STABLIZERS DRUGS.pptx
MOOD     STABLIZERS           DRUGS.pptxMOOD     STABLIZERS           DRUGS.pptx
MOOD STABLIZERS DRUGS.pptxPoojaSen20
 
Sternal Fractures & Dislocations - EMGuidewire Radiology Reading Room
Sternal Fractures & Dislocations - EMGuidewire Radiology Reading RoomSternal Fractures & Dislocations - EMGuidewire Radiology Reading Room
Sternal Fractures & Dislocations - EMGuidewire Radiology Reading RoomSean M. Fox
 
Personalisation of Education by AI and Big Data - Lourdes Guàrdia
Personalisation of Education by AI and Big Data - Lourdes GuàrdiaPersonalisation of Education by AI and Big Data - Lourdes Guàrdia
Personalisation of Education by AI and Big Data - Lourdes GuàrdiaEADTU
 
SPLICE Working Group: Reusable Code Examples
SPLICE Working Group:Reusable Code ExamplesSPLICE Working Group:Reusable Code Examples
SPLICE Working Group: Reusable Code ExamplesPeter Brusilovsky
 
How to Send Pro Forma Invoice to Your Customers in Odoo 17
How to Send Pro Forma Invoice to Your Customers in Odoo 17How to Send Pro Forma Invoice to Your Customers in Odoo 17
How to Send Pro Forma Invoice to Your Customers in Odoo 17Celine George
 
Improved Approval Flow in Odoo 17 Studio App
Improved Approval Flow in Odoo 17 Studio AppImproved Approval Flow in Odoo 17 Studio App
Improved Approval Flow in Odoo 17 Studio AppCeline George
 
TỔNG HỢP HƠN 100 ĐỀ THI THỬ TỐT NGHIỆP THPT TOÁN 2024 - TỪ CÁC TRƯỜNG, TRƯỜNG...
TỔNG HỢP HƠN 100 ĐỀ THI THỬ TỐT NGHIỆP THPT TOÁN 2024 - TỪ CÁC TRƯỜNG, TRƯỜNG...TỔNG HỢP HƠN 100 ĐỀ THI THỬ TỐT NGHIỆP THPT TOÁN 2024 - TỪ CÁC TRƯỜNG, TRƯỜNG...
TỔNG HỢP HƠN 100 ĐỀ THI THỬ TỐT NGHIỆP THPT TOÁN 2024 - TỪ CÁC TRƯỜNG, TRƯỜNG...Nguyen Thanh Tu Collection
 

Recently uploaded (20)

Spring gala 2024 photo slideshow - Celebrating School-Community Partnerships
Spring gala 2024 photo slideshow - Celebrating School-Community PartnershipsSpring gala 2024 photo slideshow - Celebrating School-Community Partnerships
Spring gala 2024 photo slideshow - Celebrating School-Community Partnerships
 
會考英文會考英文會考英文會考英文會考英文會考英文會考英文會考英文會考英文會考英文會考英文
會考英文會考英文會考英文會考英文會考英文會考英文會考英文會考英文會考英文會考英文會考英文會考英文會考英文會考英文會考英文會考英文會考英文會考英文會考英文會考英文會考英文會考英文
會考英文會考英文會考英文會考英文會考英文會考英文會考英文會考英文會考英文會考英文會考英文
 
Stl Algorithms in C++ jjjjjjjjjjjjjjjjjj
Stl Algorithms in C++ jjjjjjjjjjjjjjjjjjStl Algorithms in C++ jjjjjjjjjjjjjjjjjj
Stl Algorithms in C++ jjjjjjjjjjjjjjjjjj
 
e-Sealing at EADTU by Kamakshi Rajagopal
e-Sealing at EADTU by Kamakshi Rajagopale-Sealing at EADTU by Kamakshi Rajagopal
e-Sealing at EADTU by Kamakshi Rajagopal
 
OSCM Unit 2_Operations Processes & Systems
OSCM Unit 2_Operations Processes & SystemsOSCM Unit 2_Operations Processes & Systems
OSCM Unit 2_Operations Processes & Systems
 
PSYPACT- Practicing Over State Lines May 2024.pptx
PSYPACT- Practicing Over State Lines May 2024.pptxPSYPACT- Practicing Over State Lines May 2024.pptx
PSYPACT- Practicing Over State Lines May 2024.pptx
 
ANTI PARKISON DRUGS.pptx
ANTI         PARKISON          DRUGS.pptxANTI         PARKISON          DRUGS.pptx
ANTI PARKISON DRUGS.pptx
 
Basic Civil Engineering notes on Transportation Engineering & Modes of Transport
Basic Civil Engineering notes on Transportation Engineering & Modes of TransportBasic Civil Engineering notes on Transportation Engineering & Modes of Transport
Basic Civil Engineering notes on Transportation Engineering & Modes of Transport
 
Supporting Newcomer Multilingual Learners
Supporting Newcomer  Multilingual LearnersSupporting Newcomer  Multilingual Learners
Supporting Newcomer Multilingual Learners
 
Đề tieng anh thpt 2024 danh cho cac ban hoc sinh
Đề tieng anh thpt 2024 danh cho cac ban hoc sinhĐề tieng anh thpt 2024 danh cho cac ban hoc sinh
Đề tieng anh thpt 2024 danh cho cac ban hoc sinh
 
Including Mental Health Support in Project Delivery, 14 May.pdf
Including Mental Health Support in Project Delivery, 14 May.pdfIncluding Mental Health Support in Project Delivery, 14 May.pdf
Including Mental Health Support in Project Delivery, 14 May.pdf
 
MOOD STABLIZERS DRUGS.pptx
MOOD     STABLIZERS           DRUGS.pptxMOOD     STABLIZERS           DRUGS.pptx
MOOD STABLIZERS DRUGS.pptx
 
Sternal Fractures & Dislocations - EMGuidewire Radiology Reading Room
Sternal Fractures & Dislocations - EMGuidewire Radiology Reading RoomSternal Fractures & Dislocations - EMGuidewire Radiology Reading Room
Sternal Fractures & Dislocations - EMGuidewire Radiology Reading Room
 
Mattingly "AI & Prompt Design: Named Entity Recognition"
Mattingly "AI & Prompt Design: Named Entity Recognition"Mattingly "AI & Prompt Design: Named Entity Recognition"
Mattingly "AI & Prompt Design: Named Entity Recognition"
 
VAMOS CUIDAR DO NOSSO PLANETA! .
VAMOS CUIDAR DO NOSSO PLANETA!                    .VAMOS CUIDAR DO NOSSO PLANETA!                    .
VAMOS CUIDAR DO NOSSO PLANETA! .
 
Personalisation of Education by AI and Big Data - Lourdes Guàrdia
Personalisation of Education by AI and Big Data - Lourdes GuàrdiaPersonalisation of Education by AI and Big Data - Lourdes Guàrdia
Personalisation of Education by AI and Big Data - Lourdes Guàrdia
 
SPLICE Working Group: Reusable Code Examples
SPLICE Working Group:Reusable Code ExamplesSPLICE Working Group:Reusable Code Examples
SPLICE Working Group: Reusable Code Examples
 
How to Send Pro Forma Invoice to Your Customers in Odoo 17
How to Send Pro Forma Invoice to Your Customers in Odoo 17How to Send Pro Forma Invoice to Your Customers in Odoo 17
How to Send Pro Forma Invoice to Your Customers in Odoo 17
 
Improved Approval Flow in Odoo 17 Studio App
Improved Approval Flow in Odoo 17 Studio AppImproved Approval Flow in Odoo 17 Studio App
Improved Approval Flow in Odoo 17 Studio App
 
TỔNG HỢP HƠN 100 ĐỀ THI THỬ TỐT NGHIỆP THPT TOÁN 2024 - TỪ CÁC TRƯỜNG, TRƯỜNG...
TỔNG HỢP HƠN 100 ĐỀ THI THỬ TỐT NGHIỆP THPT TOÁN 2024 - TỪ CÁC TRƯỜNG, TRƯỜNG...TỔNG HỢP HƠN 100 ĐỀ THI THỬ TỐT NGHIỆP THPT TOÁN 2024 - TỪ CÁC TRƯỜNG, TRƯỜNG...
TỔNG HỢP HƠN 100 ĐỀ THI THỬ TỐT NGHIỆP THPT TOÁN 2024 - TỪ CÁC TRƯỜNG, TRƯỜNG...
 

Ruta solucion de problemas

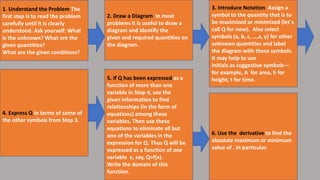
  • 1. 1. Understand the Problem The first step is to read the problem carefully until it is clearly understood. Ask yourself: What is the unknown? What are the given quantities? What are the given conditions? 2. Draw a Diagram In most problems it is useful to draw a diagram and identify the given and required quantities on the diagram. 3. Introduce Notation Assign a symbol to the quantity that is to be maximized or minimized (let´s call Q for now). Also select symbols (a, b, c, …,x, y) for other unknown quantities and label the diagram with these symbols. It may help to use initials as suggestive symbols— for example, A for area, h for height, t for time. 4. Express Q in terms of some of the other symbols from Step 3. 5. If Q has been expressed as a function of more than one variable in Step 4, use the given information to find relationships (in the form of equations) among these variables. Then use these equations to eliminate all but one of the variables in the expression for Q. Thus Q will be expressed as a function of one variable x, say, Q=f(x). Write the domain of this function. 6. Use the derivative to find the absolute maximum or minimum value of . In particular.
  • 2. 1. Understand the Problem The first step is to read the problem carefully until it is clearly understood. Ask yourself: What is the unknown? What are the given quantities? What are the given conditions? 2. Draw a Diagram In most problems it is useful to draw a diagram and identify the given and required quantities on the diagram. 3. Introduce Notation Assign a symbol to the quantity that is to be maximized or minimized (let´s call Q for now). Also select symbols (a, b, c, …,x, y) for other unknown quantities and label the diagram with these symbols. It may help to use initials as suggestive symbols—for example, A for area, h for height, t for time. 4. Express Q in terms of some of the other symbols from Step 3. 5. If Q has been expressed as a function of more than one variable in Step 4, use the given information to find relationships (in the form of equations) among these variables. Then use these equations to eliminate all but one of the variables in the expression for Q. Thus Q will be expressed as a function of one variable x, say, Q=f(x). Write the domain of this function. 6. Use the derivative to find the absolute maximum or minimum value of . In particular. 2. A farmer has 2400 ft of fencing and wants to fence off a rectangular field that borders a straight river. He needs no fence along the river. What are the dimensions of the field that has the largest area?
  • 3. 1. Understand the Problem The first step is to read the problem carefully until it is clearly understood. Ask yourself: What is the unknown? What are the given quantities? What are the given conditions? 2. Draw a Diagram In most problems it is useful to draw a diagram and identify the given and required quantities on the diagram. 3. Introduce Notation Assign a symbol to the quantity that is to be maximized or minimized (let´s call Q for now). Also select symbols (a, b, c, …,x, y) for other unknown quantities and label the diagram with these symbols. It may help to use initials as suggestive symbols—for example, A for area, h for height, t for time. 4. Express Q in terms of some of the other symbols from Step 3. 5. If Q has been expressed as a function of more than one variable in Step 4, use the given information to find relationships (in the form of equations) among these variables. Then use these equations to eliminate all but one of the variables in the expression for Q. Thus Q will be expressed as a function of one variable x, say, Q=f(x). Write the domain of this function. 6. Use the derivative to find the absolute maximum or minimum value of . In particular. 3.Find two numbers whose difference is 100 and whose product is a minimum.
  • 4. 1. Understand the Problem The first step is to read the problem carefully until it is clearly understood. Ask yourself: What is the unknown? What are the given quantities? What are the given conditions? 2. Draw a Diagram In most problems it is useful to draw a diagram and identify the given and required quantities on the diagram. 3. Introduce Notation Assign a symbol to the quantity that is to be maximized or minimized (let´s call Q for now). Also select symbols (a, b, c, …,x, y) for other unknown quantities and label the diagram with these symbols. It may help to use initials as suggestive symbols—for example, A for area, h for height, t for time. 4. Express Q in terms of some of the other symbols from Step 3. 5. If Q has been expressed as a function of more than one variable in Step 4, use the given information to find relationships (in the form of equations) among these variables. Then use these equations to eliminate all but one of the variables in the expression for Q. Thus Q will be expressed as a function of one variable x, say, Q=f(x). Write the domain of this function. 6. Use the derivative to find the absolute maximum or minimum value of . In particular. 4. Find the dimensions of a rectangle with perimeter 100 m whose area is as large as possible.