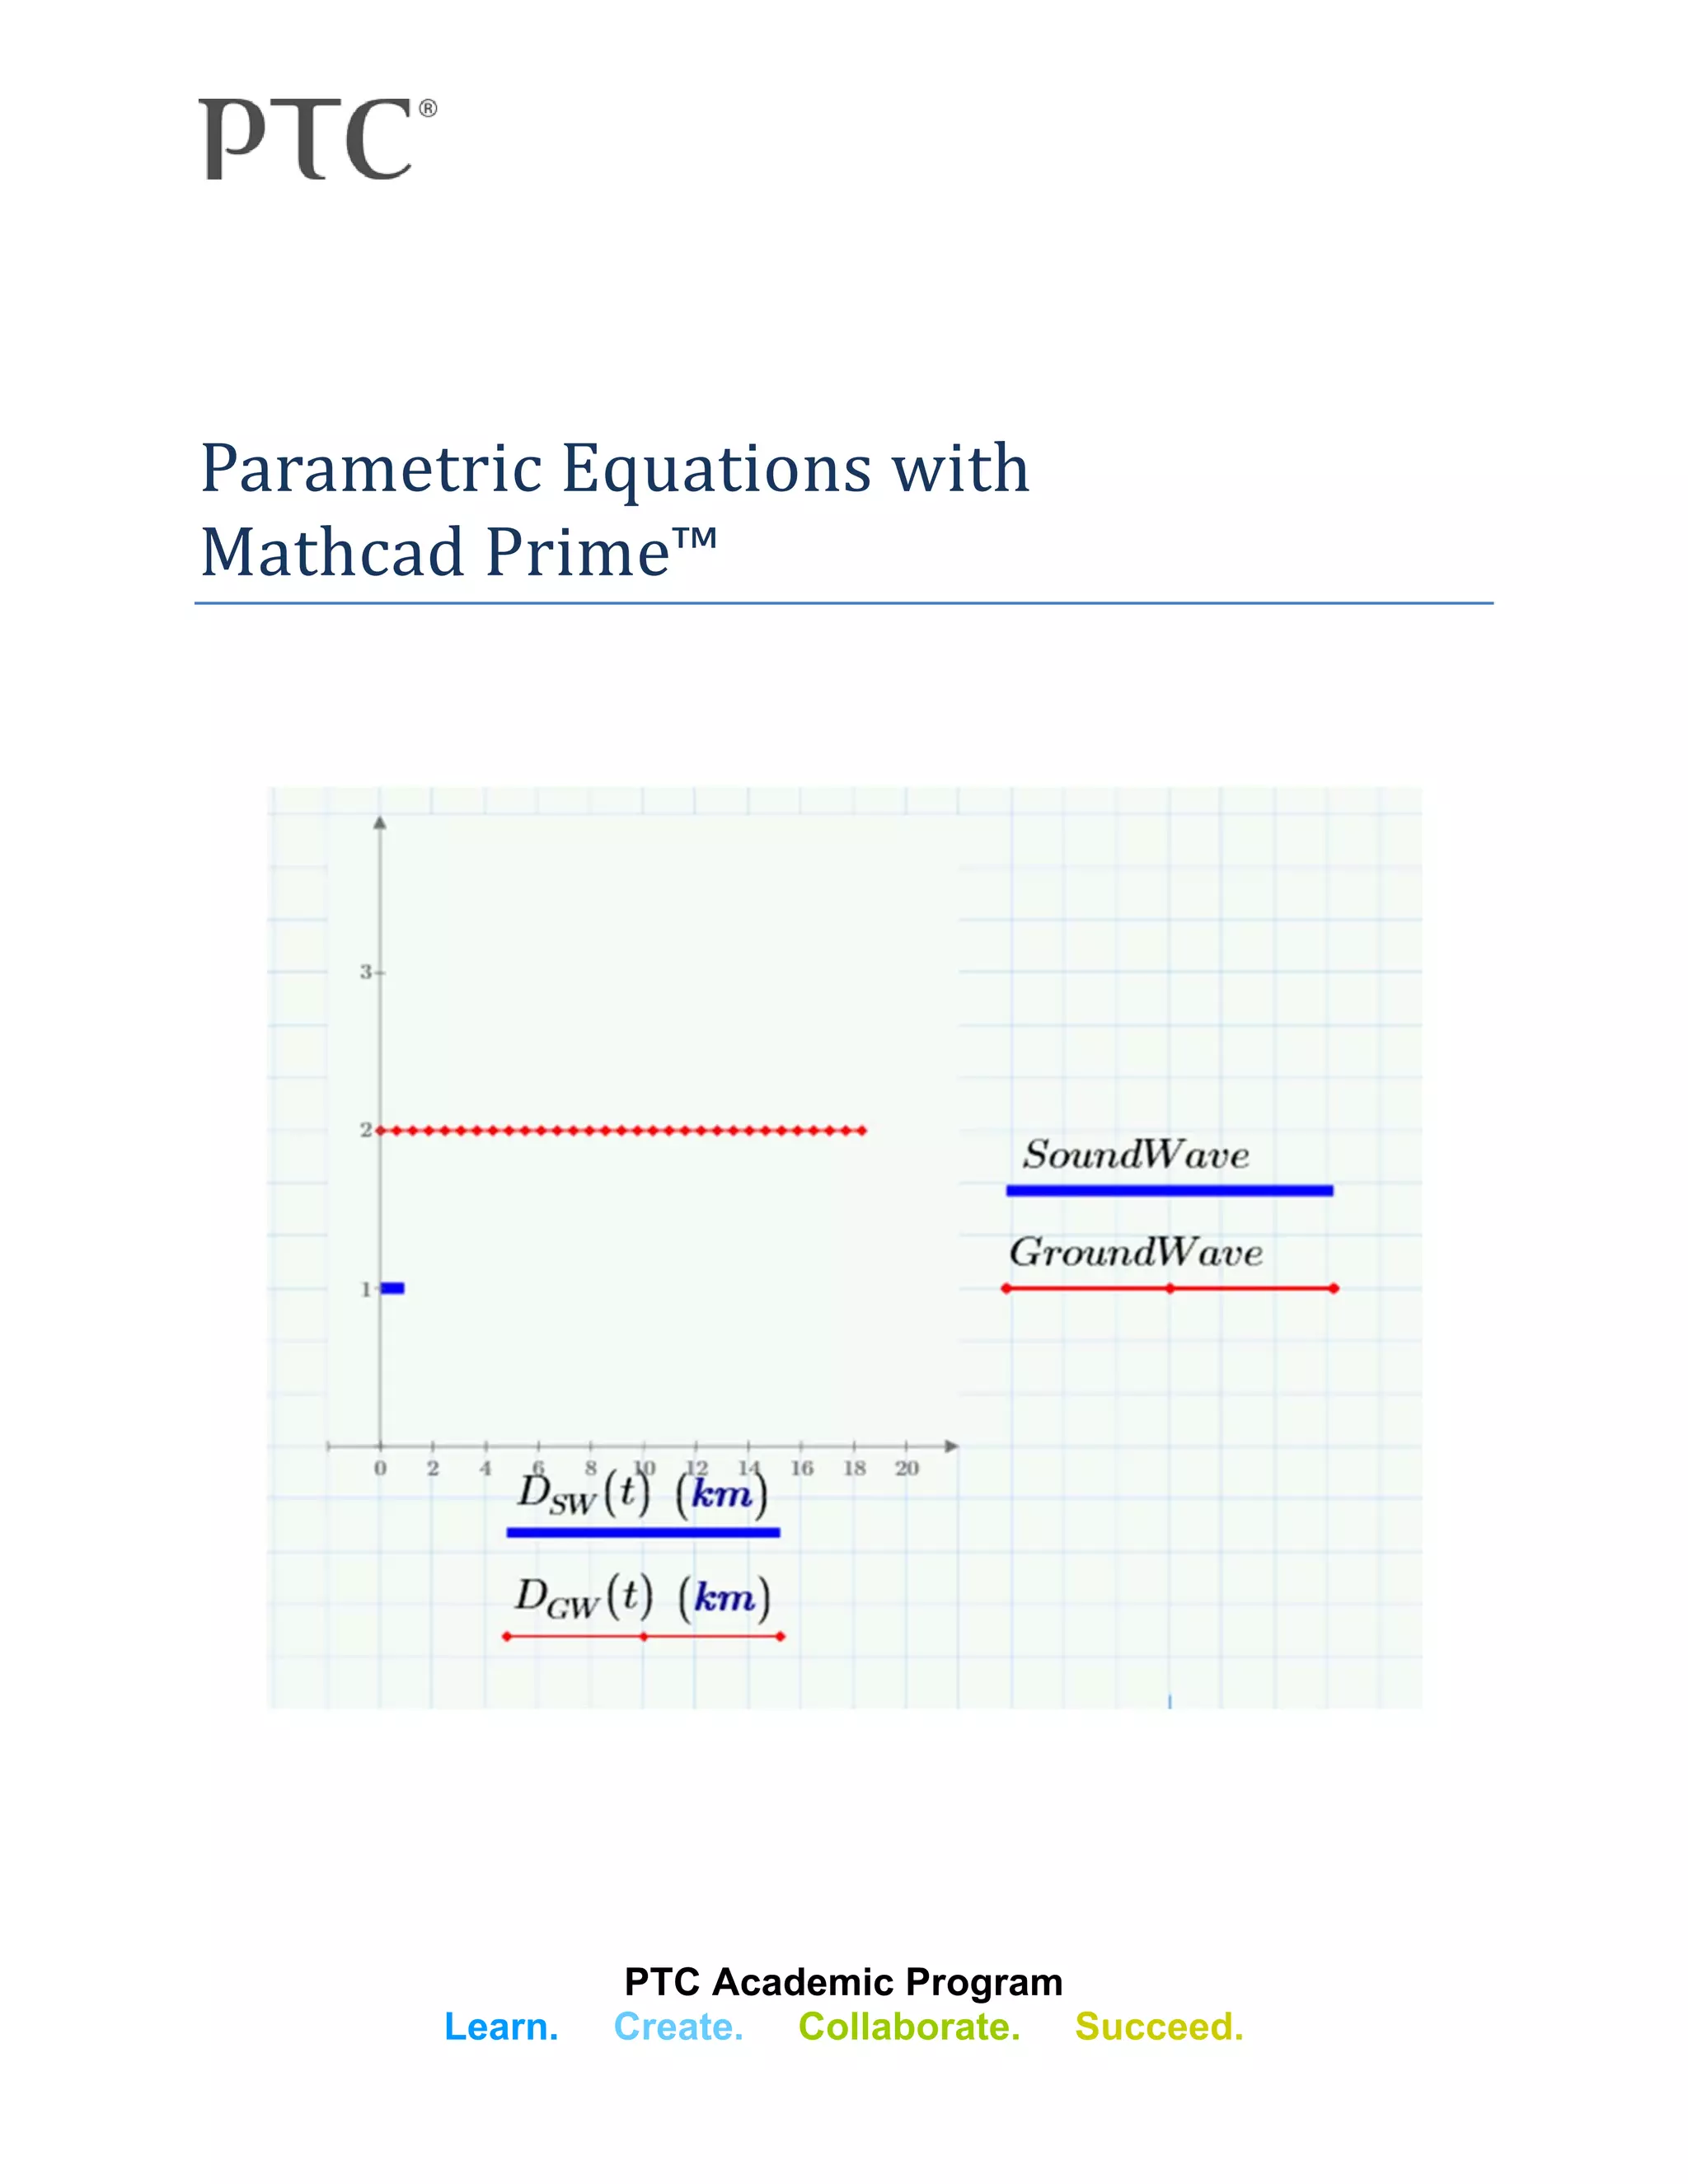
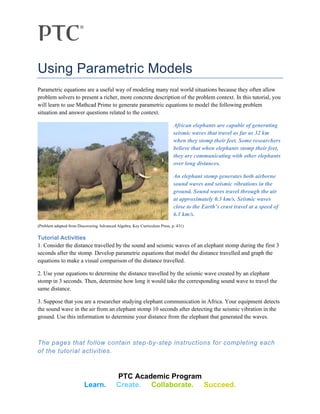
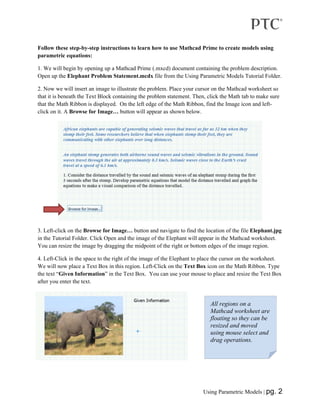
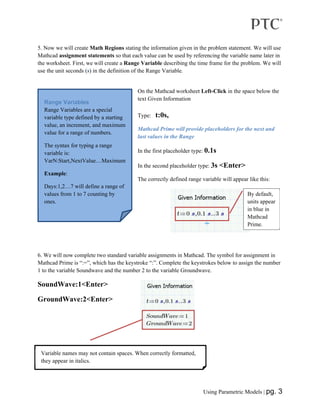
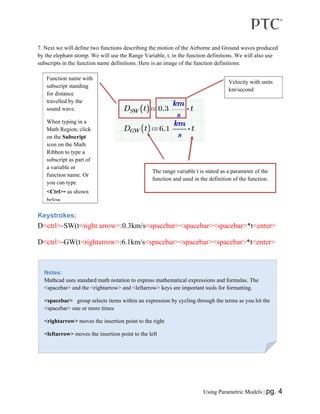
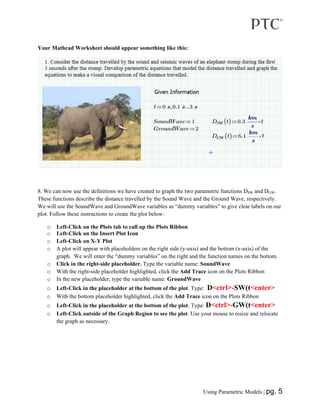
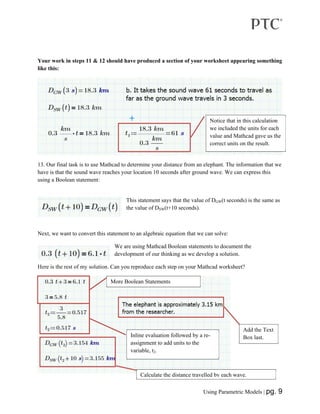
3. PTC Academic Program
Learn. Create. Collaborate. Succeed.
Using Parametric Models
Parametric equations are a useful way of modeling many real world situations because they often allow
problem solvers to present a richer, more concrete description of the problem context. In this tutorial, you
will learn to use Mathcad Prime to generate parametric equations to model the following problem
situation and answer questions related to the context.
African elephants are capable of generating
seismic waves that travel as far as 32 km
when they stomp their feet. Some researchers
believe that when elephants stomp their feet,
they are communicating with other elephants
over long distances.
An elephant stomp generates both airborne
sound waves and seismic vibrations in the
ground. Sound waves travel through the air
at approximately 0.3 km/s. Seismic waves
close to the Earth’s crust travel at a speed of
6.1 km/s.
(Problem adapted from Discovering Advanced Algebra, Key Curriculum Press, p. 431)
Tutorial Activities
1. Consider the distance travelled by the sound and seismic waves of an elephant stomp during the first 3
seconds after the stomp. Develop parametric equations that model the distance travelled and graph the
equations to make a visual comparison of the distance travelled.
2. Use your equations to determine the distance travelled by the seismic wave created by an elephant
stomp in 3 seconds. Then, determine how long it would take the corresponding sound wave to travel the
same distance.
3. Suppose that you are a researcher studying elephant communication in Africa. Your equipment detects
the sound wave in the air from an elephant stomp 10 seconds after detecting the seismic vibration in the
ground. Use this information to determine your distance from the elephant that generated the waves.
The pages that follow contain step-by-step instructions for completing each
of the tutorial activities.
4. Using Parametric Models | pg. 2
Follow these step-by-step instructions to learn how to use Mathcad Prime to create models using
parametric equations:
1. We will begin by opening up a Mathcad Prime (.mxcd) document containing the problem description.
Open up the Elephant Problem Statement.mcdx file from the Using Parametric Models Tutorial Folder.
2. Now we will insert an image to illustrate the problem. Place your cursor on the Mathcad worksheet so
that it is beneath the Text Block containing the problem statement. Then, click the Math tab to make sure
that the Math Ribbon is displayed. On the left edge of the Math Ribbon, find the Image icon and left-
click on it. A Browse for Image… button will appear as shown below.
3. Left-click on the Browse for Image… button and navigate to find the location of the file Elephant.jpg
in the Tutorial Folder. Click Open and the image of the Elephant will appear in the Mathcad worksheet.
You can resize the image by dragging the midpoint of the right or bottom edges of the image region.
4. Left-Click in the space to the right of the image of the Elephant to place the cursor on the worksheet.
We will now place a Text Box in this region. Left-Click on the Text Box icon on the Math Ribbon. Type
the text “Given Information” in the Text Box. You can use your mouse to place and resize the Text Box
after you enter the text.
All regions on a
Mathcad worksheet are
floating so they can be
resized and moved
using mouse select and
drag operations.
5. Using Parametric Models | pg. 3
5. Now we will create Math Regions stating the information given in the problem statement. We will use
Mathcad assignment statements so that each value can be used by referencing the variable name later in
the worksheet. First, we will create a Range Variable describing the time frame for the problem. We will
use the unit seconds (s) in the definition of the Range Variable.
On the Mathcad worksheet Left-Click in the space below the
text Given Information
Type: t:0s,
Mathcad Prime will provide placeholders for the next and
last values in the Range
In the first placeholder type: 0.1s
In the second placeholder type: 3s <Enter>
The correctly defined range variable will appear like this:
6. We will now complete two standard variable assignments in Mathcad. The symbol for assignment in
Mathcad Prime is “:=”, which has the keystroke “:”. Complete the keystrokes below to assign the number
1 to the variable Soundwave and the number 2 to the variable Groundwave.
SoundWave:1<Enter>
GroundWave:2<Enter>
Range Variables
Range Variables are a special
variable type defined by a starting
value, an increment, and maximum
value for a range of numbers.
The syntax for typing a range
variable is:
VarN:Start,NextValue…Maximum
Example:
Days:1,2…7 will define a range of
values from 1 to 7 counting by
ones.
By default,
units appear
in blue in
Mathcad
Prime.
Variable names may not contain spaces. When correctly formatted,
they appear in italics.
6. Using Parametric Models | pg. 4
7. Next we will define two functions describing the motion of the Airborne and Ground waves produced
by the elephant stomp. We will use the Range Variable, t, in the function definitions. We will also use
subscripts in the function name definitions. Here is an image of the function definitions:
Keystrokes:
D<ctrl>-SW(t<right arrow>:0.3km/s<spacebar><spacebar><spacebar>*t<enter>
D<ctrl>-GW(t<rightarrow>:6.1km/s<spacebar><spacebar><spacebar>*t<enter>
Function name with
subscript standing
for distance
travelled by the
sound wave.
When typing in a
Math Region, click
on the Subscript
icon on the Math
Ribbon to type a
subscript as part of
a variable or
function name. Or
you can type
<Ctrl>- as shown
below
Velocity with units
km/second
The range variable t is stated as a parameter of the
function and used in the definition of the function.
Notes:
Mathcad uses standard math notation to express mathematical expressions and formulas. The
<spacebar> and the <rightarrow> and <leftarrow> keys are important tools for formatting.
<spacebar> group selects items within an expression by cycling through the terms as you hit the
<spacebar> one or more times
<rightarrow> moves the insertion point to the right
<leftarrow> moves the insertion point to the left
7. Using Parametric Models | pg. 5
Your Mathcad Worksheet should appear something like this:
8. We can now use the definitions we have created to graph the two parametric functions DSW and DGW.
These functions describe the distance travelled by the Sound Wave and the Ground Wave, respectively.
We will use the SoundWave and GroundWave variables as “dummy variables” to give clear labels on our
plot. Follow these instructions to create the plot below:
o Left-Click on the Plots tab to call up the Plots Ribbon
o Left-Click on the Insert Plot Icon
o Left-Click on X-Y Plot
o A plot will appear with placeholders on the right side (y-axis) and the bottom (x-axis) of the
graph. We will enter the “dummy variables” on the right and the function names on the bottom.
o Click in the right-side placeholder. Type the variable name: SoundWave
o With the right-side placeholder highlighted, click the Add Trace icon on the Plots Ribbon
o In the new placeholder, type the variable name: GroundWave
o Left-Click in the placeholder at the bottom of the plot. Type: D<ctrl>-SW(t<enter>
o With the bottom placeholder highlighted, click the Add Trace icon on the Plots Ribbon
o Left-Click in the placeholder at the bottom of the plot. Type: D<ctrl>-GW(t<enter>
o Left-Click outside of the Graph Region to see the plot. Use your mouse to resize and relocate
the graph as necessary.
8. Using Parametric Models | pg. 6
Here is my initial plot illustrating the distance travelled by each wave in 3 seconds:
9. Follow these steps to change the formatting of the plot:
o Change the Upper Limit tick mark on the y-axis
to 3 to set the maximum value
o Change the Interval Tick Mark to 2 to make the
increment 1 unit
o Change the units on the x-axis from meters to
kilometers by deleting the unit m for each function and
replacing it with km. Note how the changes in units on the
x-axis.
o Change the formatting of the GroundWave plot to
Red and add a symbol
o Change the thickness of the SoundWave Plot
Mathcad XY Plots
Mathcad auto-formats the plot
based on the values assigned to
the variables
A plot can be rescaled by
changing maximum and
increment values on the plot
axes
The Plots Ribbon contains
formatting tools for changing
the appearance of the plot
Change the units from m to km
Select, delete, and type to
change the Upper Interval
Tick Mark to 3
Select, delete, and type to
change the Interval Tick
Mark to 2
Left-click on the trace name to select a
trace. Then, use the formatting options
on the Plots ribbon to change a plot’s
appearance.
9. Using Parametric Models | pg. 7
10. The plot enables us to compare the distance traveled by each wave in 3 seconds. On this Plot the
“dummy variables” are effectively labels for the position of each wave. The data that we are interested in
to answer our questions should be read off the x-axis. We can see that the ground wave is travelling much
farther than the sound wave in 3 seconds.
11. The second task for this tutorial is to use the equations for DSW and DGW to determine exactly how far
the ground wave travels in 3 seconds, and, how long it will take the sound wave to travel the same
distance. We will use this exercise to demonstrate the functions of Mathcad’s different equality symbols.
Type the following :
D<ctrl>-GW(3s=
This is an evaluation statement resulting in:
D<ctrl>-SW(t)<ctrl>=18.3km<enter>
This is an equivalence statement resulting in:
This graph shows the
distance travelled as a
line. In effect, we are
observing the radius of the
circle measuring the
distance travelled by the
waves.
10. Using Parametric Models | pg. 8
Compare these two statements:
The first line is an evaluation statement. Mathcad has
evaluated the function DGW for the given input, 3 seconds
determining that the function is equal to 18.3 km at this
point in time. The second line uses Mathcad’s Boolean
Equivalence symbol “=” that has the keystroke “<ctrl>=”.
In this case we are stating that we need the value of the
variable t when the value of DSW(t) is the same as 18.3 km.
Now type this Mathcad Boolean statement:
0.3km/s<spacebar> <spacebar><spacebar>*t<ctrl>=18.3km<enter>
We now have an algebraic equation (with units) that can be solved
for the unknown quantity t.
We will now use an Assignment Statement with inline evaluation to calculate the answer.
Type:
t<ctrl>-1:18.3km<spacebar> <spacebar>/0.3km/s=
To produce:
We call this inline evaluation because we are using both Mathcad’s
assignment symbol “:=” and the evaluation symbol “=” in the same
math region. Note that the use of the subscript t1 is important in this
case because we have already defined t as a range variable. If we
had simply used t in this assignment statement, we would have
changed the definition of t from this point onward in the worksheet.
12. Since we now know the answer to the second part of the tutorial task, let’s take advantage of
Mathcad’s text capabilities to briefly state our answer. Create a Text Box on your worksheet containing
the text: “It takes the sound wave 61 seconds to travel as far as the ground wave travels in 3
seconds.”
11. Using Parametric Models | pg. 9
Your work in steps 11 & 12 should have produced a section of your worksheet appearing something
like this:
13. Our final task is to use Mathcad to determine your distance from an elephant. The information that we
have is that the sound wave reaches your location 10 seconds after ground wave. We can express this
using a Boolean statement:
This statement says that the value of DGW(t seconds) is the same as
the value of DSW(t+10 seconds).
Next, we want to convert this statement to an algebraic equation that we can solve:
We are using Mathcad Boolean statements to document the
development of our thinking as we develop a solution.
Here is the rest of my solution. Can you reproduce each step on your Mathcad worksheet?
Notice that in this calculation
we included the units for each
value and Mathcad gave us the
correct units on the result.
Add the Text
Box last.
More Boolean Statements
Inline evaluation followed by a re-
assignment to add units to the
variable, t2.
Calculate the distance travelled by each wave.
12. Using Parametric Models | pg. 10
Summary
1. In this tutorial you have learned:
To add an image to a document
To define and use a range variable
To define parametric functions
To use Mathcad’s units in variable definitions, function definitions, and evaluation
statements
To plot parametric functions
To add traces to a plot
To use Mathcad’s Boolean equivalence, evaluation, and assignment equal signs to
perform step-by-step algebraic solutions
To use subscripts in naming variables and functions
To combine text, images, graphics, and symbolic algebra in a single worksheet
2. At this point you should have a complete Mathcad worksheet. Please make note of the following:
o It is possible to use your mouse to drag and resize all of the regions on your worksheet to
improve the formatting.
o If you edit any of the numerical values in assignment statements (e.g., extend the range
variable t to 4 seconds), then the worksheet will update wherever t is used (e.g., the graph
in this case).
o Editing numerical values in Boolean equality statements will not result in changes
elsewhere in the worksheet.
3. For more assistance in learning to use Mathcad Prime, consider the following:
o The Tutorials provided with Mathcad Prime that are accessible from the Getting Started
Tab
o Free tutorials available from PTC University’s Learning Exchange: LEX.ptc.com
o Video tutorials available from the Mathcad Academic YouTube Channel:
www.youtube.com/MathcadAcademic
Great job completing this tutorial!