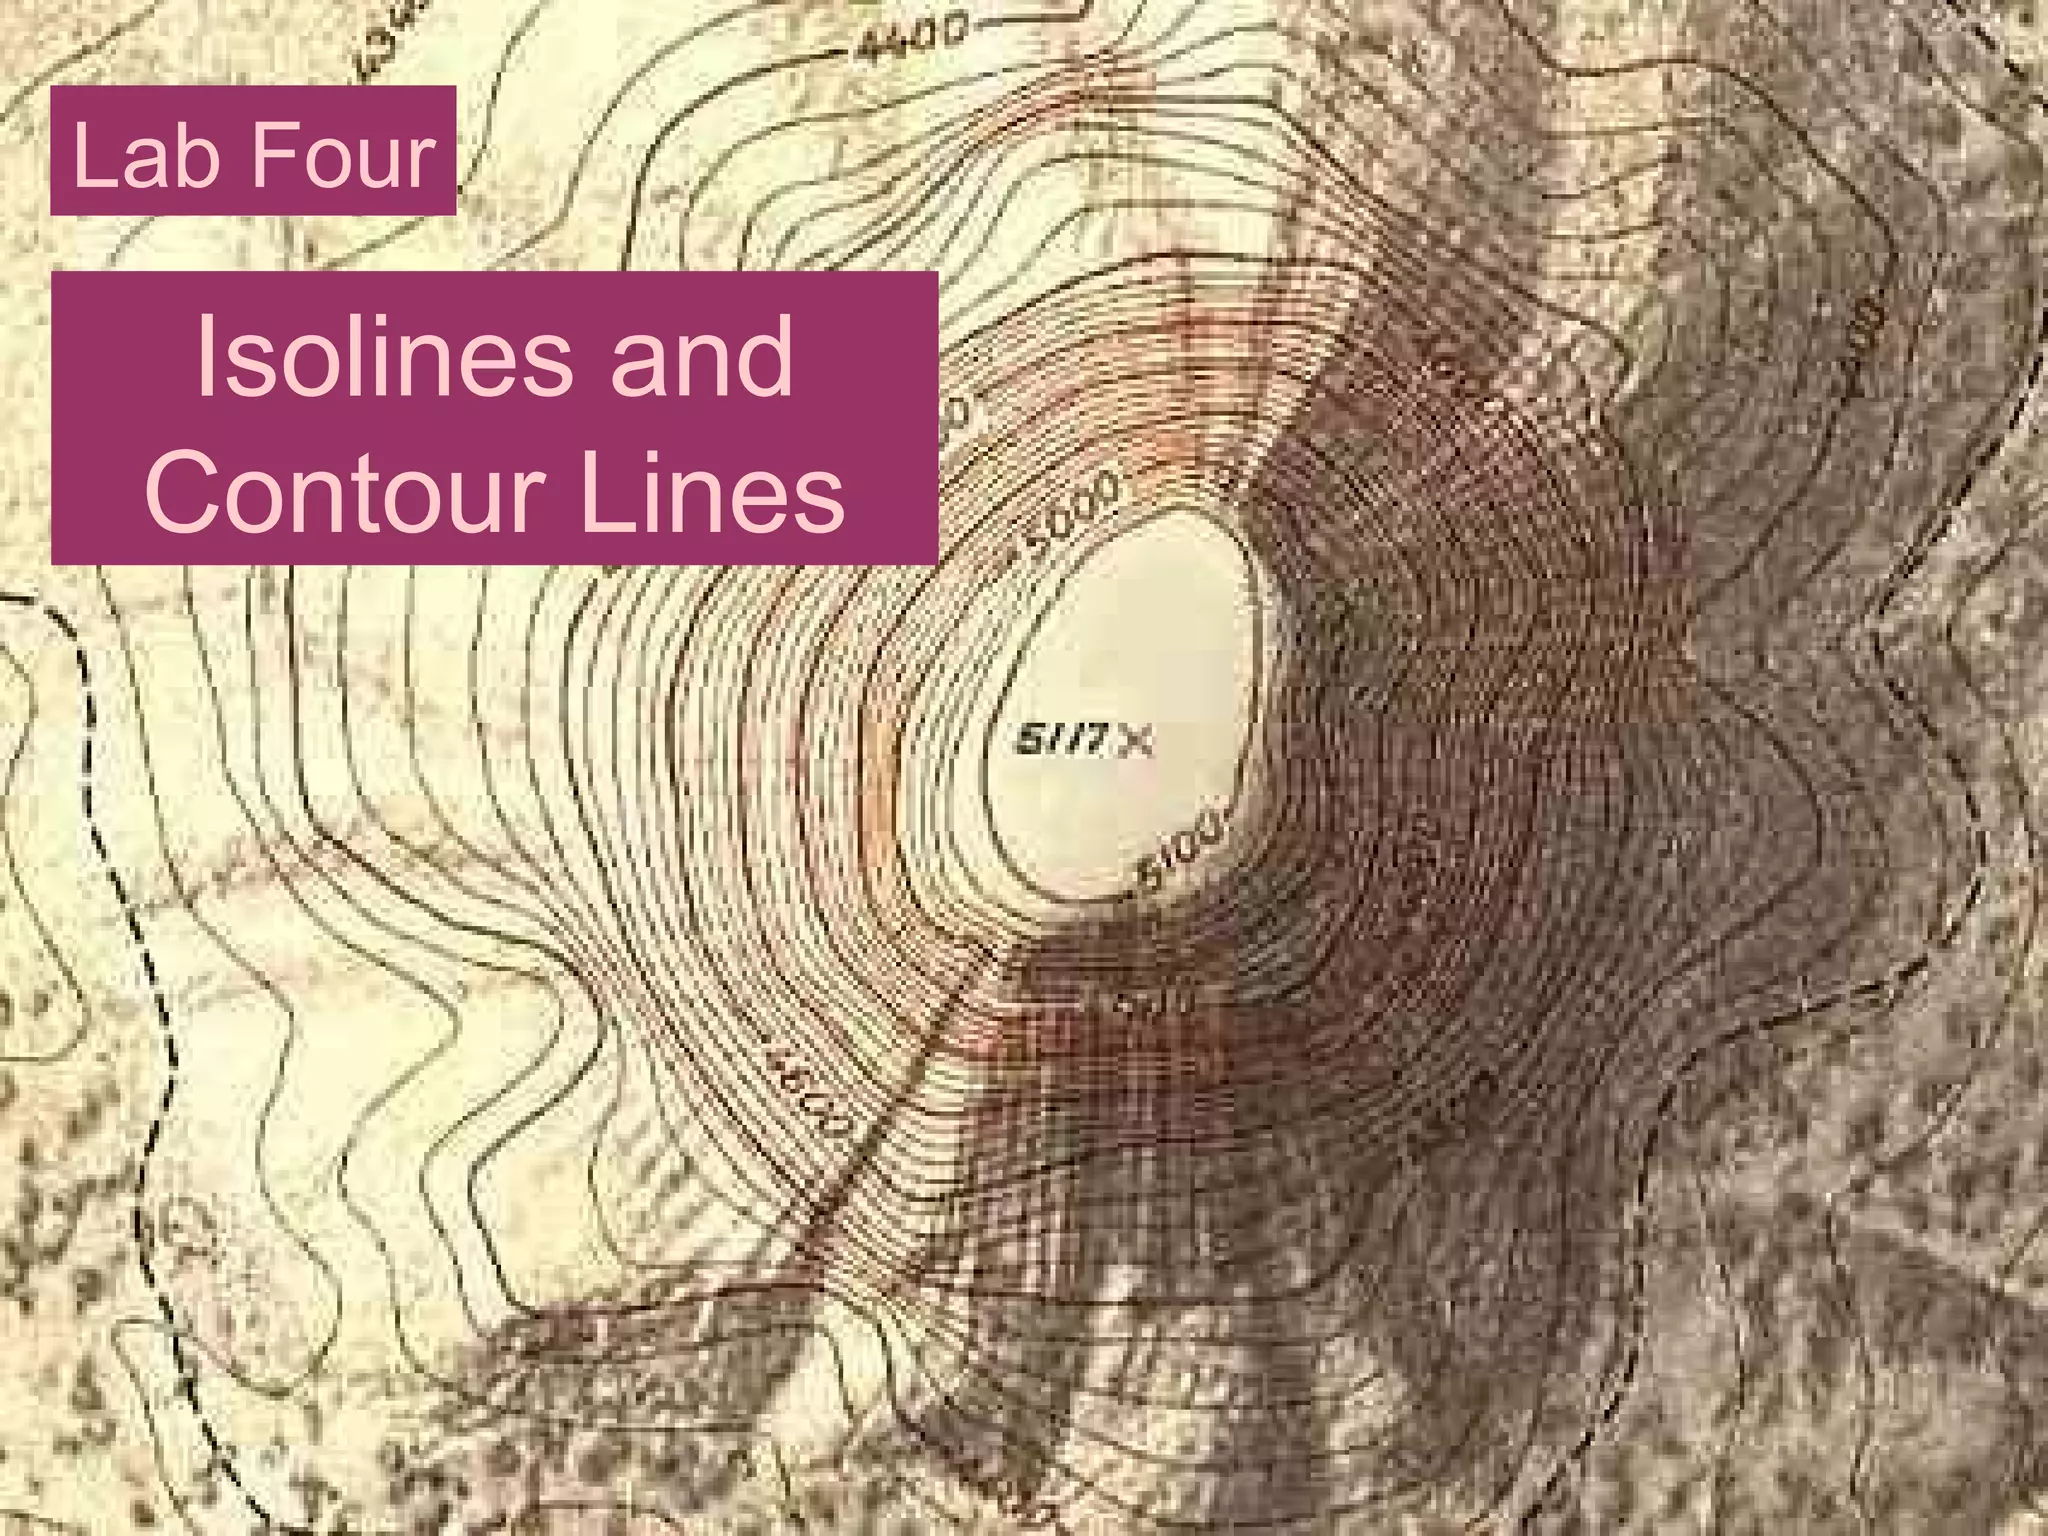
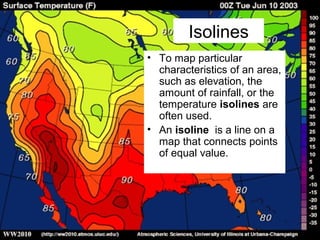
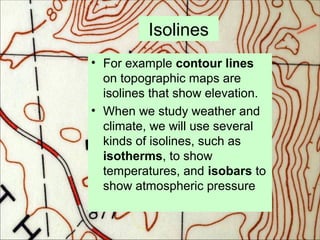
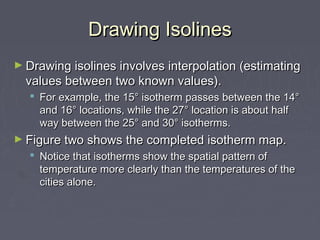
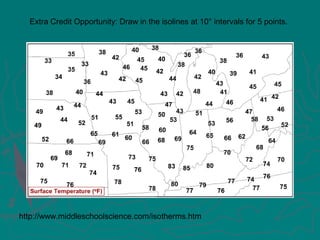
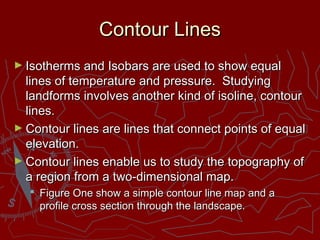
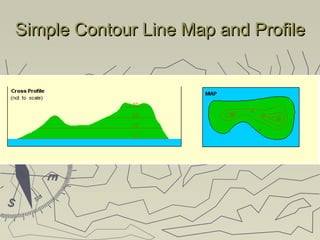
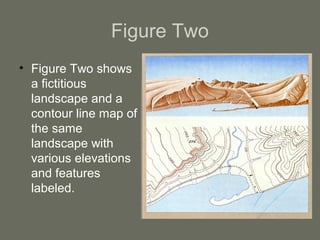
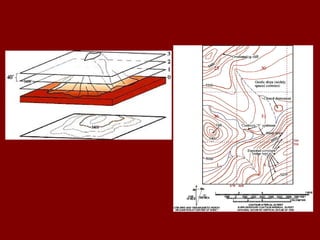
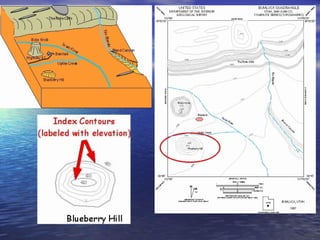
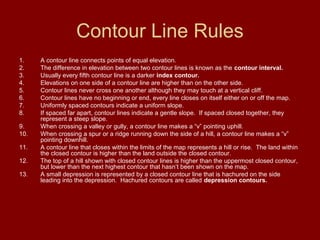
Isolines and
Contour Lines
Lab Four
Isolines
• To map particular
characteristics of an area,
such as elevation, the
amount of rainfall, or the
temperature isolines are
often used.
• An isoline is a line on a
map that connects points
of equal value.
Isolines
• For example contour lines
on topographic maps are
isolines that show elevation.
• When we study weather and
climate, we will use several
kinds of isolines, such as
isotherms, to show
temperatures, and isobars to
show atmospheric pressure
Basic Rules of isolinesBasic Rules of isolines
1.1. An isoline connects points on a map where the value ofAn isoline connects points on a map where the value of
some phenomenon is the same.some phenomenon is the same.
2.2. Isolines are drawn at regular intervals.Isolines are drawn at regular intervals.
• For example every 5° of temperature difference.For example every 5° of temperature difference.
3.3. Isolines are always closed lines, although the often closeIsolines are always closed lines, although the often close
beyond the margins of a map.beyond the margins of a map.
4.4. Isoline NEVER cross each other.Isoline NEVER cross each other.
5.5. When isolines are close together, they show a rapidWhen isolines are close together, they show a rapid
horizontal change in the phenomenon; where they are farhorizontal change in the phenomenon; where they are far
apart, the show a gradual horizontal change.apart, the show a gradual horizontal change.
6.6. Values inside a closed isoline are either higher or lowerValues inside a closed isoline are either higher or lower
than those outside the close isolinethan those outside the close isoline
• It is usually clear which is the case based on the pattern ofIt is usually clear which is the case based on the pattern of
adjacent isolines.adjacent isolines.
Figure OneFigure One
► This drawing will helpThis drawing will help
illustrate how isothermsillustrate how isotherms
are drawn.are drawn.
► Figure One shows aFigure One shows a
simple map withsimple map with
temperatures withtemperatures with
temperatures plottedtemperatures plotted
for 17 different cities.for 17 different cities.
ExerciseExercise
►We will draw isotherms at 5° intervals (15°,We will draw isotherms at 5° intervals (15°,
20°, 25°, etc.) for problems part two.20°, 25°, etc.) for problems part two.
►An isotherm will pass through any point withAn isotherm will pass through any point with
the same value as the isotherm, butthe same value as the isotherm, but
between higher and lower values.between higher and lower values.
►On one side of the line, the temperaturesOn one side of the line, the temperatures
will be higher than the value of the isotherm,will be higher than the value of the isotherm,
while on the other side, temperatures will bewhile on the other side, temperatures will be
lower.lower.
Drawing IsolinesDrawing Isolines
► Drawing isolines involves interpolation (estimatingDrawing isolines involves interpolation (estimating
values between two known values).values between two known values).
 For example, the 15° isotherm passes between the 14°For example, the 15° isotherm passes between the 14°
and 16° locations, while the 27° location is about halfand 16° locations, while the 27° location is about half
way between the 25° and 30° isotherms.way between the 25° and 30° isotherms.
► Figure two shows the completed isotherm map.Figure two shows the completed isotherm map.
 Notice that isotherms show the spatial pattern ofNotice that isotherms show the spatial pattern of
temperature more clearly than the temperatures of thetemperature more clearly than the temperatures of the
cities alone.cities alone.
http://www.middleschoolscience.com/isotherms.htm
Extra Credit Opportunity: Draw in the isolines at 10° intervals for 5 points.
Types of IsolinesTypes of Isolines
 Isoheights – lines of equal elevation or topographic contours.Isoheights – lines of equal elevation or topographic contours.
 Isoheights are lines of equal elevation.Isoheights are lines of equal elevation.
 Typically found on topographic maps like USGS topo quadrangles.Typically found on topographic maps like USGS topo quadrangles.
 Isoheights are useful for observing elevation variations and profiles.Isoheights are useful for observing elevation variations and profiles.
 Isobars – lines of equal atmospheric pressure (weather maps).Isobars – lines of equal atmospheric pressure (weather maps).
 Isotherms – lines of equal temperature.Isotherms – lines of equal temperature.
 Isobaths – lines of equal depth or bathymetry.Isobaths – lines of equal depth or bathymetry.
 Isohaline – lines of equal salinity.Isohaline – lines of equal salinity.
 Isopycnals – lines of equal rainfall.Isopycnals – lines of equal rainfall.
 Isotachs – lines of equal wind speed.Isotachs – lines of equal wind speed.
Isoline Trends
• Spatial trends may be interpreted through isolines.
• Increases/decreases in the values of interest may be
determined from isolines.
• The relative increase/decrease of the values of interest
may also be determined.
• The value difference between any two consecutive
isolines is the contour interval.
• The relative increase/decrease of a certain value may
also be determined.
• Tight spacing between isolines depict relatively sharp
increases/decreases in values.
• Wide spacing between isolines depict relatively small
increases/decreases in values.
Contour LinesContour Lines
► Isotherms and Isobars are used to show equalIsotherms and Isobars are used to show equal
lines of temperature and pressure. Studyinglines of temperature and pressure. Studying
landforms involves another kind of isoline, contourlandforms involves another kind of isoline, contour
lines.lines.
► Contour lines are lines that connect points of equalContour lines are lines that connect points of equal
elevation.elevation.
► Contour lines enable us to study the topography ofContour lines enable us to study the topography of
a region from a two-dimensional map.a region from a two-dimensional map.
 Figure One show a simple contour line map and aFigure One show a simple contour line map and a
profile cross section through the landscape.profile cross section through the landscape.
Simple Contour Line Map and ProfileSimple Contour Line Map and Profile
Figure Two
• Figure Two shows
a fictitious
landscape and a
contour line map of
the same
landscape with
various elevations
and features
labeled.
Contour Line Rules
1. A contour line connects points of equal elevation.
2. The difference in elevation between two contour lines is known as the contour interval.
3. Usually every fifth contour line is a darker index contour.
4. Elevations on one side of a contour line are higher than on the other side.
5. Contour lines never cross one another although they may touch at a vertical cliff.
6. Contour lines have no beginning or end, every line closes on itself either on or off the map.
7. Uniformly spaced contours indicate a uniform slope.
8. If spaced far apart, contour lines indicate a gentle slope. If spaced closed together, they
represent a steep slope.
9. When crossing a valley or gully, a contour line makes a “v” pointing uphill.
10. When crossing a spur or a ridge running down the side of a hill, a contour line makes a “v”
pointing downhill.
11. A contour line that closes within the limits of the map represents a hill or rise. The land within
the closed contour is higher than the land outside the closed contour.
12. The top of a hill shown with closed contour lines is higher than the uppermost closed contour,
but lower than the next highest contour that hasn’t been shown on the map.
13. A small depression is represented by a closed contour line that is hachured on the side
leading into the depression. Hachured contours are called depression contours.

Lab four isolines and contour lines

  • 1.
  • 2.
    Isolines • To mapparticular characteristics of an area, such as elevation, the amount of rainfall, or the temperature isolines are often used. • An isoline is a line on a map that connects points of equal value.
  • 3.
    Isolines • For examplecontour lines on topographic maps are isolines that show elevation. • When we study weather and climate, we will use several kinds of isolines, such as isotherms, to show temperatures, and isobars to show atmospheric pressure
  • 4.
    Basic Rules ofisolinesBasic Rules of isolines 1.1. An isoline connects points on a map where the value ofAn isoline connects points on a map where the value of some phenomenon is the same.some phenomenon is the same. 2.2. Isolines are drawn at regular intervals.Isolines are drawn at regular intervals. • For example every 5° of temperature difference.For example every 5° of temperature difference. 3.3. Isolines are always closed lines, although the often closeIsolines are always closed lines, although the often close beyond the margins of a map.beyond the margins of a map. 4.4. Isoline NEVER cross each other.Isoline NEVER cross each other. 5.5. When isolines are close together, they show a rapidWhen isolines are close together, they show a rapid horizontal change in the phenomenon; where they are farhorizontal change in the phenomenon; where they are far apart, the show a gradual horizontal change.apart, the show a gradual horizontal change. 6.6. Values inside a closed isoline are either higher or lowerValues inside a closed isoline are either higher or lower than those outside the close isolinethan those outside the close isoline • It is usually clear which is the case based on the pattern ofIt is usually clear which is the case based on the pattern of adjacent isolines.adjacent isolines.
  • 5.
    Figure OneFigure One ►This drawing will helpThis drawing will help illustrate how isothermsillustrate how isotherms are drawn.are drawn. ► Figure One shows aFigure One shows a simple map withsimple map with temperatures withtemperatures with temperatures plottedtemperatures plotted for 17 different cities.for 17 different cities.
  • 7.
    ExerciseExercise ►We will drawisotherms at 5° intervals (15°,We will draw isotherms at 5° intervals (15°, 20°, 25°, etc.) for problems part two.20°, 25°, etc.) for problems part two. ►An isotherm will pass through any point withAn isotherm will pass through any point with the same value as the isotherm, butthe same value as the isotherm, but between higher and lower values.between higher and lower values. ►On one side of the line, the temperaturesOn one side of the line, the temperatures will be higher than the value of the isotherm,will be higher than the value of the isotherm, while on the other side, temperatures will bewhile on the other side, temperatures will be lower.lower.
  • 8.
    Drawing IsolinesDrawing Isolines ►Drawing isolines involves interpolation (estimatingDrawing isolines involves interpolation (estimating values between two known values).values between two known values).  For example, the 15° isotherm passes between the 14°For example, the 15° isotherm passes between the 14° and 16° locations, while the 27° location is about halfand 16° locations, while the 27° location is about half way between the 25° and 30° isotherms.way between the 25° and 30° isotherms. ► Figure two shows the completed isotherm map.Figure two shows the completed isotherm map.  Notice that isotherms show the spatial pattern ofNotice that isotherms show the spatial pattern of temperature more clearly than the temperatures of thetemperature more clearly than the temperatures of the cities alone.cities alone.
  • 9.
    http://www.middleschoolscience.com/isotherms.htm Extra Credit Opportunity:Draw in the isolines at 10° intervals for 5 points.
  • 10.
    Types of IsolinesTypesof Isolines  Isoheights – lines of equal elevation or topographic contours.Isoheights – lines of equal elevation or topographic contours.  Isoheights are lines of equal elevation.Isoheights are lines of equal elevation.  Typically found on topographic maps like USGS topo quadrangles.Typically found on topographic maps like USGS topo quadrangles.  Isoheights are useful for observing elevation variations and profiles.Isoheights are useful for observing elevation variations and profiles.  Isobars – lines of equal atmospheric pressure (weather maps).Isobars – lines of equal atmospheric pressure (weather maps).  Isotherms – lines of equal temperature.Isotherms – lines of equal temperature.  Isobaths – lines of equal depth or bathymetry.Isobaths – lines of equal depth or bathymetry.  Isohaline – lines of equal salinity.Isohaline – lines of equal salinity.  Isopycnals – lines of equal rainfall.Isopycnals – lines of equal rainfall.  Isotachs – lines of equal wind speed.Isotachs – lines of equal wind speed.
  • 11.
    Isoline Trends • Spatialtrends may be interpreted through isolines. • Increases/decreases in the values of interest may be determined from isolines. • The relative increase/decrease of the values of interest may also be determined. • The value difference between any two consecutive isolines is the contour interval. • The relative increase/decrease of a certain value may also be determined. • Tight spacing between isolines depict relatively sharp increases/decreases in values. • Wide spacing between isolines depict relatively small increases/decreases in values.
  • 12.
    Contour LinesContour Lines ►Isotherms and Isobars are used to show equalIsotherms and Isobars are used to show equal lines of temperature and pressure. Studyinglines of temperature and pressure. Studying landforms involves another kind of isoline, contourlandforms involves another kind of isoline, contour lines.lines. ► Contour lines are lines that connect points of equalContour lines are lines that connect points of equal elevation.elevation. ► Contour lines enable us to study the topography ofContour lines enable us to study the topography of a region from a two-dimensional map.a region from a two-dimensional map.  Figure One show a simple contour line map and aFigure One show a simple contour line map and a profile cross section through the landscape.profile cross section through the landscape.
  • 13.
    Simple Contour LineMap and ProfileSimple Contour Line Map and Profile
  • 14.
    Figure Two • FigureTwo shows a fictitious landscape and a contour line map of the same landscape with various elevations and features labeled.
  • 17.
    Contour Line Rules 1.A contour line connects points of equal elevation. 2. The difference in elevation between two contour lines is known as the contour interval. 3. Usually every fifth contour line is a darker index contour. 4. Elevations on one side of a contour line are higher than on the other side. 5. Contour lines never cross one another although they may touch at a vertical cliff. 6. Contour lines have no beginning or end, every line closes on itself either on or off the map. 7. Uniformly spaced contours indicate a uniform slope. 8. If spaced far apart, contour lines indicate a gentle slope. If spaced closed together, they represent a steep slope. 9. When crossing a valley or gully, a contour line makes a “v” pointing uphill. 10. When crossing a spur or a ridge running down the side of a hill, a contour line makes a “v” pointing downhill. 11. A contour line that closes within the limits of the map represents a hill or rise. The land within the closed contour is higher than the land outside the closed contour. 12. The top of a hill shown with closed contour lines is higher than the uppermost closed contour, but lower than the next highest contour that hasn’t been shown on the map. 13. A small depression is represented by a closed contour line that is hachured on the side leading into the depression. Hachured contours are called depression contours.