
Downloaded 215 times


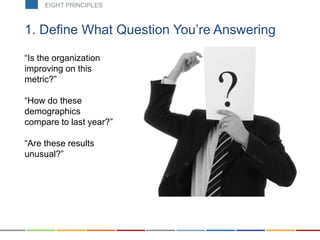
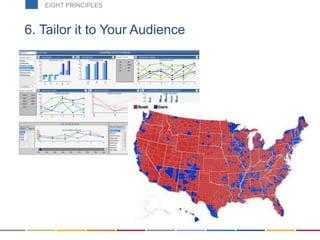
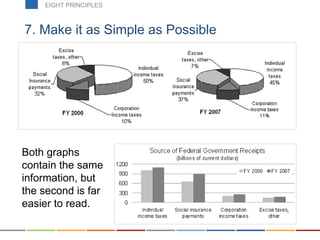
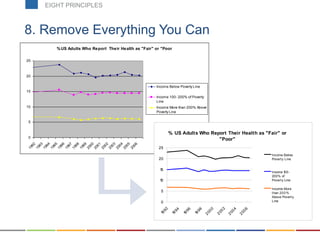

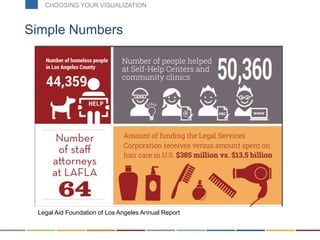
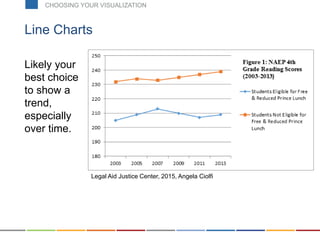
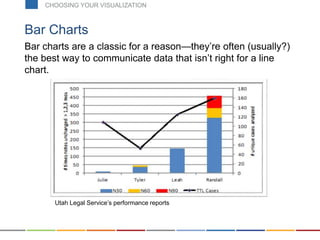

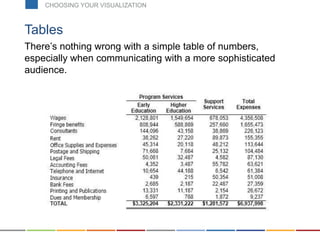
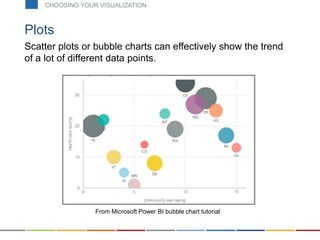

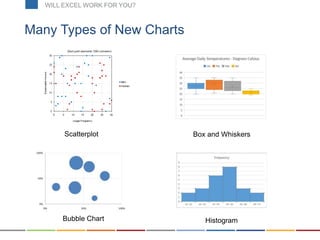
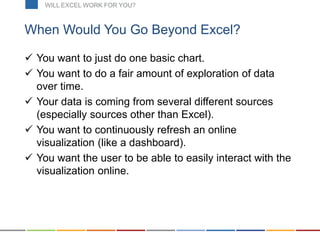

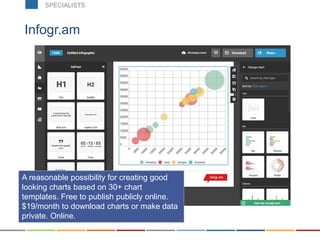
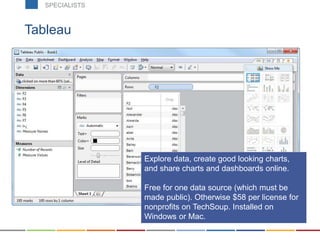
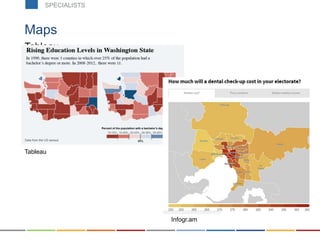
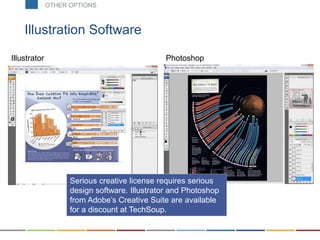
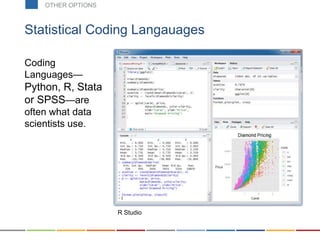

This document discusses creating data visualizations with low-cost tools. It begins by outlining the objectives of understanding the purpose of a visualization, principles of communicating through data, choosing the right visualization, and determining if Excel is suitable. It then covers the eight principles of communicating through data, such as defining the question, using accurate data, and tailoring the visualization to the audience. Next, it discusses choosing the right visualization type based on the purpose, such as line charts, bar charts or tables. The document considers when Excel may not be suitable and introduces specialist tools like Tableau, Microsoft Power BI, and coding options. It concludes with additional resources for data visualization.


