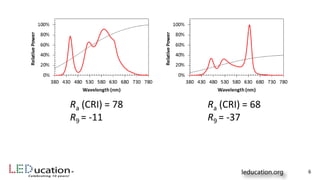
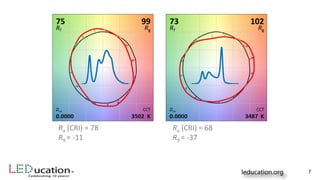
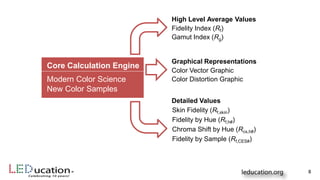
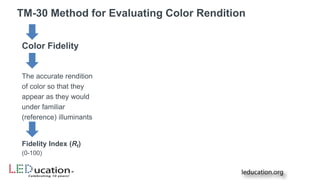
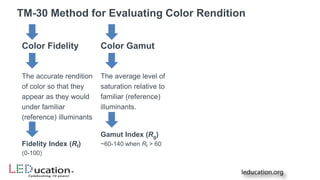
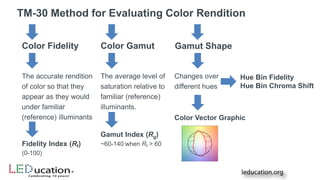
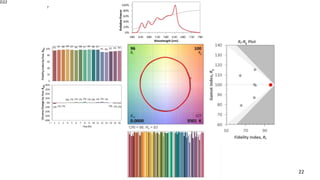
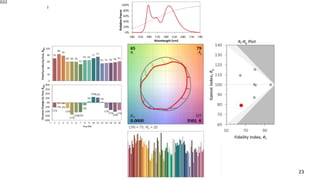
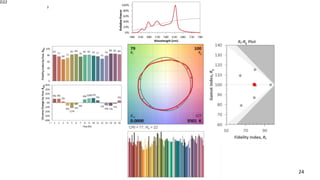
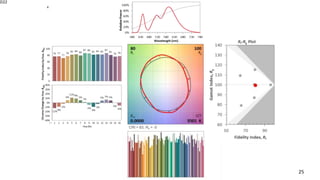
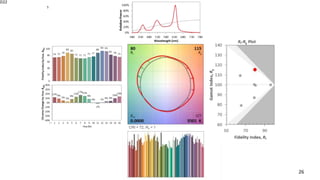
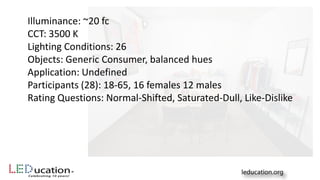
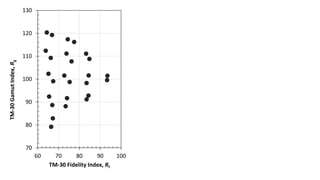
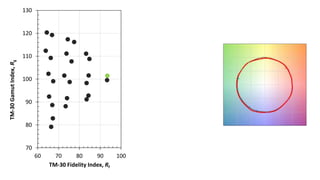
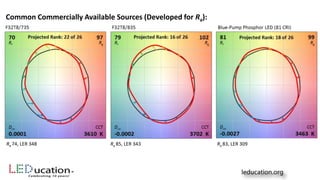
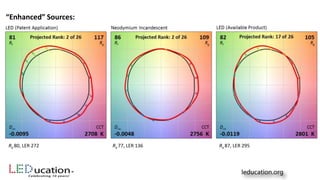
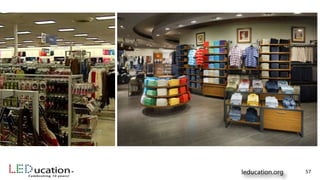
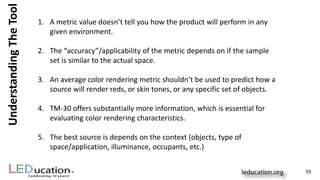
TM-30: Introduction and Latest Developments
Michael Royer, PhD | Pacific Northwest National Laboratory
Credit(s) earned on completion of this course will be
reported to AIA CES for AIA members. Certificates of
Completion for both AIA members and non-AIA
members are available upon request.
This course is registered with AIA CES for
continuing professional education. As such, it does
not include content that may be deemed or
construed to be an approval or endorsement by the
AIA of any material of construction or any method or
manner of
handling, using, distributing, or dealing in any
material or product.
___________________________________________
Questions related to specific materials, methods, and services will
be addressed at the conclusion of this presentation.
TM-30 was developed, through a consensus process, to provide a
comprehensive set of objective information—going beyond simple
average values—that can be used collectively to make informed
decisions about subjective perceptions, such as preference or
naturalness, given a context. New research has shown the value
of this robust system in capturing human judgements of lighting
quality. Nonetheless, TM-30 is a tool, not an answer. Its limitations
must be understand, and it must be combined with other color
information, such as chromaticity, luminance, and distribution of
light, when choosing a source.
Abstract:
3
 Summarize the process that led to the recommendation by the IES
Color Metrics Task Group
 Describe the components of the color rendition evaluation system
and how they can be interpreted to aid design and specification
 Comprehend the conceptual framework for the underlying
calculations
 Recognize the limitations of the this system, and more generally
recognize the limitations of all measures for color rendition
 Understand how the objective information in TM-30 can be used to
aid in subjective design decisions (i.e., matching the right source to
an application).
Learning Objectives:
4
5
6
Ra (CRI) = 78
R9 = -11
Ra (CRI) = 68
R9 = -37
7
Ra (CRI) = 78
R9 = -11
Ra (CRI) = 68
R9 = -37
Fidelity Index (Rf)
Gamut Index (Rg)
High Level Average Values
Core Calculation Engine
Modern Color Science
New Color Samples
Color Vector Graphic
Color Distortion Graphic
Graphical Representations
Skin Fidelity (Rf,skin)
Fidelity by Hue (Rf,h#)
Chroma Shift by Hue (Rcs,h#)
Fidelity by Sample (Rf,CES#)
Detailed Values
8
Color Fidelity
Fidelity Index (Rf)
TM-30 Method for Evaluating Color Rendition
The accurate rendition
of color so that they
appear as they would
under familiar
(reference) illuminants
(0-100)
Perfect Fidelity
Increase
Saturation
Decrease
Saturation
Positive Hue Shift
Negative Hue Shift
CRI = 80 CRI = 80
Constant Fidelity (CRI)
(Also possible to change
lightness, not shown)
Color Fidelity
Fidelity Index (Rf)
TM-30 Method for Evaluating Color Rendition
The accurate rendition
of color so that they
appear as they would
under familiar
(reference) illuminants
(0-100)
Color Gamut
The average level of
saturation relative to
familiar (reference)
illuminants.
Gamut Index (Rg)
~60-140 when Rf > 60
60
70
80
90
100
110
120
130
140
50 60 70 80 90 100
GamutIndex,Rg
Fidelity Index, Rf
Reduced Fidelity
IncreasedSaturationDecreasedSaturation
Reference
Illuminant
Two-AxisSystem
• Evaluate tradeoffs between
fidelity and saturation.
• Cohesive system from the
same calculation engine.
• But average values don’t tell
the whole story…
Color Fidelity
Fidelity Index (Rf)
The accurate rendition
of color so that they
appear as they would
under familiar
(reference) illuminants
Color Gamut
The average level of
saturation relative to
familiar (reference)
illuminants.
Gamut Index (Rg)
(0-100)
~60-140 when Rf > 60
Gamut Shape
Changes over
different hues
Color Vector Graphic
TM-30 Method for Evaluating Color Rendition
Hue Bin Fidelity
Hue Bin Chroma Shift
Rf = 75 | Rg = 100 | CCT = 3500 K Rf = 75 | Rg = 100 | CCT = 3500 K
Decreased
Saturation
Increased
Saturation
Hue Shift
15
76 72
64
74
85 82
75 72 75
68 72 71
83 87 84 81
0
20
40
60
80
100
FidelityIndexbyHue,Rcs,hj
12%11%
5%
-3% -6%
3%
10%
16%14%
10%
4%
-1%
-4% -5%
2%
9%
-40%
-30%
-20%
-10%
0%
10%
20%
30%
40%
1 2 3 4 5 6 7 8 9 10 11 12 13 14 15 16
ChromaChangebyHue,Rcs,hj
74 73
63
72
80 80 79
85 83
74 70 72
83
78
74 73
0
20
40
60
80
100
FidelityIndexbyHue,Rcs,hj
-14%
-11%
-3%
5%
11%11%
4%
-2%
-8%
-13%
-3%
7% 9% 11%
2%
-5%
-40%
-30%
-20%
-10%
0%
10%
20%
30%
40%
1 2 3 4 5 6 7 8 9 10 11 12 13 14 15 16
ChromaChangebyHue,Rcs,hj
SummaryofUpgrades CRI Calculation Engine (1974) TM-30 Calculation Engine (2015)
CIE 1964 U*V*W* CAM02-UCS (CIECAM02)
Von Kries CAT CIE CAT02
8 color samples 99 color samples
Medium chroma/lightness
Spectral sensitivity varies
Uniform color space coverage
Spectral sensitivity neutral
Variety of real objectsMunsell samples only
Technical
Improvement
Ref Illuminant Step Function Ref Illuminant Continuous
(Uses same reference sources, but
blended between 4500 K and 5500 K)
No lower limit for scores 0 to 100 scale (fidelity)
Nice to Have
Fidelity Only Fidelity, Gamut, Graphical, Hues Philosophical
Change
16
70
75
80
85
90
95
100
70 75 80 85 90 95 100
TM-30Rf
CIE Ra (CRI)
R² = 0.9548
70
75
80
85
90
95
100
70 75 80 85 90 95 100
TM-30Rf
CIE Ra (CRI)
~16 point spread in
Rf scores at Ra = ~80
70
75
80
85
90
95
100
70 75 80 85 90 95 100
TM-30Rf
CIE Ra (CRI)
Filament
Daylight Models
Narrowband Fluorescent
Broadband Fluorescent
HID
Hybrid LED
Color Mixed LED
Phosphor LED
49 point spread
(error) in fidelity
score at CRI of 80.
40
50
60
70
80
90
100
50 60 70 80 90 100
TM-30Rf
CIE Ra
5,000 Real and Modelled* SPDs
*All modelled SPDs composed of combinations of Gaussian
primaries; chromaticity on Planckian locus between 2700 K
and 7000 K
20
For more information:
Smet KAG, David A, Whitehead L. 2015. Why color space
uniformity and sample set spectral uniformity are essential
for color rendering measures. Leukos 12(1–2):39–50.
60
70
80
90
100
110
120
130
140
0 20 40 60 80 100
TM-30Rg
CIE Ra
60
70
80
90
100
110
120
130
140
0 20 40 60 80 100
TM-30Rg
TM-30 Rf
21
Is the error systematic?
D22
7
22
D22
2
23
D22
3
24
D22
4
25
D22
5
26
Illuminance: ~20 fc
CCT: 3500 K
Lighting Conditions: 26
Objects: Generic Consumer, balanced hues
Application: Undefined
Participants (28): 18-65, 16 females 12 males
Rating Questions: Normal-Shifted, Saturated-Dull, Like-Dislike
70
80
90
100
110
120
130
60 70 80 90 100
TM-30GamutIndex,Rg
TM-30 Fidelity Index, Rf
70
80
90
100
110
120
130
60 70 80 90 100
TM-30GamutIndex,Rg
TM-30 Fidelity Index, Rf
70
80
90
100
110
120
130
60 70 80 90 100
TM-30GamutIndex,Rg
TM-30 Fidelity Index, Rf
70
80
90
100
110
120
130
60 70 80 90 100
TM-30GamutIndex,Rg
TM-30 Fidelity Index, Rf
70
80
90
100
110
120
130
60 70 80 90 100
TM-30GamutIndex,Rg
TM-30 Fidelity Index, Rf
70
80
90
100
110
120
130
60 70 80 90 100
TM-30GamutIndex,Rg
TM-30 Fidelity Index, Rf
70
80
90
100
110
120
130
60 70 80 90 100
TM-30GamutIndex,Rg
TM-30 Fidelity Index, Rf
36
0
10
20
30
40
50
60
70
80
90
100
17 22 26 15 16 23 6 24 18 9 8 7 25 14 10 12 5 20 4 21 13 11 3 19 1 2
FidelityIndexRf
Setting ID in Rank OrderMost Liked Least Liked
Fidelity and Preference?
R2 = 0.06
37
1 2 3
(These aren’t necessarily the most preferred sources possible, just the most preferred sources from this experiment).
70
80
90
100
110
120
130
60 70 80 90 100
IESTM-30Rg
IES TM-30 Rf
Model r2 = 0.68
p=0.000
p = 0.042
Dislike
Like
5.5
5.0
4.5
4.0
3.5
Fidelity + Gamut
and Preference?
Same Fidelity, Same Gamut, Significantly Different Rating.
R² = 0.81
1
2
3
4
5
6
7
8
-30% -20% -10% 0% 10% 20% 30%
MeanPreferenceRating
Hue Bin 16 Chroma Shift (Rg,h16)
Dislike
Like
Red Chroma Shift and Preference?
Best Fit Model for Preference: Like-Dislike = 7.396 - 0.0408(Rf) + 103.4(Rcs,h16
3) - 9.949(Rcs,h16)
R² = 0.9355
2.0
2.5
3.0
3.5
4.0
4.5
5.0
5.5
6.0
6.5
7.0
2 3 4 5 6 7
ParticipantRating(Preference)
TM-30 Model Predicted Rating
42
Normalness = Fidelity + Red Fidelity/Saturation
Saturation = Red Saturation
Preference = Fidelity + Red Saturation
Rf > 80 Rf,h1 > 80 0% < Rcs,h1 < 8%
Maximize Rcs,h16, Rcs,h1
Rf > 74 0% < Rcs,h16 < 15%
0% < Rcs,h1 < 15%
(Rg > 100)
Context =
60
70
80
90
100
110
120
130
140
50 60 70 80 90 100
GamutIndex,Rg
Fidelity Index, Rf
Phosphor LED
Color Mixed LED
Hybrid LED
Standard Halogen
Filtered Halogen
Triphosphor Fluorescent, 7XX
Triphosphor Fluorescent, 8XX
Triphosphor Fluorescent, 9XX
Metal Halide
Experimental
Preferred
Zone*
-50%
-40%
-30%
-20%
-10%
0%
10%
20%
30%
40%
50%
Rcs,h16
Experimental Preferred Zone*
Same Fidelity, Same Gamut, Significantly Different Rating.
LER = 343 LER = 311
Why so few red-enhancing sources?
CIERaIESTM-30Rf
Why so few red-enhancing sources?
Modelr2=0.06
Common Commercially Available Sources (Developed for Ra):
Ra 74, LER 348 Ra 85, LER 343 Ra 83, LER 309
Ra 80, LER 272
“Enhanced” Sources:
Ra 77, LER 136 Ra 87, LER 295
49
Context…
50
51
52
53
54
55
56
57
58
UnderstandingTheTool
1. A metric value doesn’t tell you how the product will perform in any
given environment.
2. The “accuracy”/applicability of the metric depends on if the sample
set is similar to the actual space.
3. An average color rendering metric shouldn’t be used to predict how a
source will render reds, or skin tones, or any specific set of objects.
4. TM-30 offers substantially more information, which is essential for
evaluating color rendering characteristics.
5. The best source is depends on the context (objects, type of
space/application, illuminance, occupants, etc.)
59
Resources
60
IES Technical Memorandum (TM) 30-15 (Includes Excel Calculators):
IES Method for Evaluating Light Source Color Rendition
http://bit.ly/1IWZxVu
Optics Express journal article that provides overview of the IES method:
Development of the IES method for evaluating the color rendition of light sources
http://bit.ly/1J32ftZ
Application webinar co-sponsored by US Department of Energy and Illuminating Engineering Society:
Understanding and Applying TM-30-15: IES Method for Evaluating Light Source Color Rendition
http://1.usa.gov/1YEkbBZ
Technical webinar co-sponsored by US Department of Energy and Illuminating Engineering Society:
A Technical Discussion of TM-30-15: Why and How it Advances Color Rendition Metrics
http://1.usa.gov/1Mn15LG
LEUKOS journal article supporting TM-30’s technical foundations:
Smet KAG, David A, Whitehead L. 2015. Why Color Space and Spectral Uniformity Are Essential for Color
Rendering Measures. LEUKOS. 12(1,2):39-50.
http://dx.doi.org/10.1080/15502724.2015.1091356
Resources
61
LEUKOS editorial discussing next steps:
Royer MP. 2015. IES TM-30-15 Is Approved—Now What? Moving Forward with New Color Rendition
Measures. LEUKOS. 12(1,2):3-5.
http://dx.doi.org/10.1080/15502724.2015.1092752
Lighting Research and Technology, Open Letter:
Correspondence: In support of the IES method of evaluating light source colour rendition
(More than 30 authors)
http://dx.doi.org/10.1177/1477153515617392
DOE Fact Sheet on TM-30
http://energy.gov/eere/ssl/downloads/evaluating-color-rendition-using-ies-tm-30-15
DOE TM-30 FAQs Page:
http://energy.gov/eere/ssl/tm-30-frequently-asked-questions
This concludes The American Institute of Architects
Continuing Education Systems Course

IES TM30-15 Introduction and Latest Updates

  • 1.
    TM-30: Introduction andLatest Developments Michael Royer, PhD | Pacific Northwest National Laboratory
  • 2.
    Credit(s) earned oncompletion of this course will be reported to AIA CES for AIA members. Certificates of Completion for both AIA members and non-AIA members are available upon request. This course is registered with AIA CES for continuing professional education. As such, it does not include content that may be deemed or construed to be an approval or endorsement by the AIA of any material of construction or any method or manner of handling, using, distributing, or dealing in any material or product. ___________________________________________ Questions related to specific materials, methods, and services will be addressed at the conclusion of this presentation.
  • 3.
    TM-30 was developed,through a consensus process, to provide a comprehensive set of objective information—going beyond simple average values—that can be used collectively to make informed decisions about subjective perceptions, such as preference or naturalness, given a context. New research has shown the value of this robust system in capturing human judgements of lighting quality. Nonetheless, TM-30 is a tool, not an answer. Its limitations must be understand, and it must be combined with other color information, such as chromaticity, luminance, and distribution of light, when choosing a source. Abstract: 3
  • 4.
     Summarize theprocess that led to the recommendation by the IES Color Metrics Task Group  Describe the components of the color rendition evaluation system and how they can be interpreted to aid design and specification  Comprehend the conceptual framework for the underlying calculations  Recognize the limitations of the this system, and more generally recognize the limitations of all measures for color rendition  Understand how the objective information in TM-30 can be used to aid in subjective design decisions (i.e., matching the right source to an application). Learning Objectives: 4
  • 5.
  • 6.
    6 Ra (CRI) =78 R9 = -11 Ra (CRI) = 68 R9 = -37
  • 7.
    7 Ra (CRI) =78 R9 = -11 Ra (CRI) = 68 R9 = -37
  • 8.
    Fidelity Index (Rf) GamutIndex (Rg) High Level Average Values Core Calculation Engine Modern Color Science New Color Samples Color Vector Graphic Color Distortion Graphic Graphical Representations Skin Fidelity (Rf,skin) Fidelity by Hue (Rf,h#) Chroma Shift by Hue (Rcs,h#) Fidelity by Sample (Rf,CES#) Detailed Values 8
  • 9.
    Color Fidelity Fidelity Index(Rf) TM-30 Method for Evaluating Color Rendition The accurate rendition of color so that they appear as they would under familiar (reference) illuminants (0-100)
  • 10.
    Perfect Fidelity Increase Saturation Decrease Saturation Positive HueShift Negative Hue Shift CRI = 80 CRI = 80 Constant Fidelity (CRI) (Also possible to change lightness, not shown)
  • 11.
    Color Fidelity Fidelity Index(Rf) TM-30 Method for Evaluating Color Rendition The accurate rendition of color so that they appear as they would under familiar (reference) illuminants (0-100) Color Gamut The average level of saturation relative to familiar (reference) illuminants. Gamut Index (Rg) ~60-140 when Rf > 60
  • 12.
    60 70 80 90 100 110 120 130 140 50 60 7080 90 100 GamutIndex,Rg Fidelity Index, Rf Reduced Fidelity IncreasedSaturationDecreasedSaturation Reference Illuminant Two-AxisSystem • Evaluate tradeoffs between fidelity and saturation. • Cohesive system from the same calculation engine. • But average values don’t tell the whole story…
  • 13.
    Color Fidelity Fidelity Index(Rf) The accurate rendition of color so that they appear as they would under familiar (reference) illuminants Color Gamut The average level of saturation relative to familiar (reference) illuminants. Gamut Index (Rg) (0-100) ~60-140 when Rf > 60 Gamut Shape Changes over different hues Color Vector Graphic TM-30 Method for Evaluating Color Rendition Hue Bin Fidelity Hue Bin Chroma Shift
  • 14.
    Rf = 75| Rg = 100 | CCT = 3500 K Rf = 75 | Rg = 100 | CCT = 3500 K Decreased Saturation Increased Saturation Hue Shift
  • 15.
    15 76 72 64 74 85 82 7572 75 68 72 71 83 87 84 81 0 20 40 60 80 100 FidelityIndexbyHue,Rcs,hj 12%11% 5% -3% -6% 3% 10% 16%14% 10% 4% -1% -4% -5% 2% 9% -40% -30% -20% -10% 0% 10% 20% 30% 40% 1 2 3 4 5 6 7 8 9 10 11 12 13 14 15 16 ChromaChangebyHue,Rcs,hj 74 73 63 72 80 80 79 85 83 74 70 72 83 78 74 73 0 20 40 60 80 100 FidelityIndexbyHue,Rcs,hj -14% -11% -3% 5% 11%11% 4% -2% -8% -13% -3% 7% 9% 11% 2% -5% -40% -30% -20% -10% 0% 10% 20% 30% 40% 1 2 3 4 5 6 7 8 9 10 11 12 13 14 15 16 ChromaChangebyHue,Rcs,hj
  • 16.
    SummaryofUpgrades CRI CalculationEngine (1974) TM-30 Calculation Engine (2015) CIE 1964 U*V*W* CAM02-UCS (CIECAM02) Von Kries CAT CIE CAT02 8 color samples 99 color samples Medium chroma/lightness Spectral sensitivity varies Uniform color space coverage Spectral sensitivity neutral Variety of real objectsMunsell samples only Technical Improvement Ref Illuminant Step Function Ref Illuminant Continuous (Uses same reference sources, but blended between 4500 K and 5500 K) No lower limit for scores 0 to 100 scale (fidelity) Nice to Have Fidelity Only Fidelity, Gamut, Graphical, Hues Philosophical Change 16
  • 17.
    70 75 80 85 90 95 100 70 75 8085 90 95 100 TM-30Rf CIE Ra (CRI)
  • 18.
    R² = 0.9548 70 75 80 85 90 95 100 7075 80 85 90 95 100 TM-30Rf CIE Ra (CRI)
  • 19.
    ~16 point spreadin Rf scores at Ra = ~80 70 75 80 85 90 95 100 70 75 80 85 90 95 100 TM-30Rf CIE Ra (CRI) Filament Daylight Models Narrowband Fluorescent Broadband Fluorescent HID Hybrid LED Color Mixed LED Phosphor LED
  • 20.
    49 point spread (error)in fidelity score at CRI of 80. 40 50 60 70 80 90 100 50 60 70 80 90 100 TM-30Rf CIE Ra 5,000 Real and Modelled* SPDs *All modelled SPDs composed of combinations of Gaussian primaries; chromaticity on Planckian locus between 2700 K and 7000 K 20 For more information: Smet KAG, David A, Whitehead L. 2015. Why color space uniformity and sample set spectral uniformity are essential for color rendering measures. Leukos 12(1–2):39–50.
  • 21.
    60 70 80 90 100 110 120 130 140 0 20 4060 80 100 TM-30Rg CIE Ra 60 70 80 90 100 110 120 130 140 0 20 40 60 80 100 TM-30Rg TM-30 Rf 21 Is the error systematic?
  • 22.
  • 23.
  • 24.
  • 25.
  • 26.
  • 28.
    Illuminance: ~20 fc CCT:3500 K Lighting Conditions: 26 Objects: Generic Consumer, balanced hues Application: Undefined Participants (28): 18-65, 16 females 12 males Rating Questions: Normal-Shifted, Saturated-Dull, Like-Dislike
  • 29.
    70 80 90 100 110 120 130 60 70 8090 100 TM-30GamutIndex,Rg TM-30 Fidelity Index, Rf
  • 30.
    70 80 90 100 110 120 130 60 70 8090 100 TM-30GamutIndex,Rg TM-30 Fidelity Index, Rf
  • 31.
    70 80 90 100 110 120 130 60 70 8090 100 TM-30GamutIndex,Rg TM-30 Fidelity Index, Rf
  • 32.
    70 80 90 100 110 120 130 60 70 8090 100 TM-30GamutIndex,Rg TM-30 Fidelity Index, Rf
  • 33.
    70 80 90 100 110 120 130 60 70 8090 100 TM-30GamutIndex,Rg TM-30 Fidelity Index, Rf
  • 34.
    70 80 90 100 110 120 130 60 70 8090 100 TM-30GamutIndex,Rg TM-30 Fidelity Index, Rf
  • 35.
    70 80 90 100 110 120 130 60 70 8090 100 TM-30GamutIndex,Rg TM-30 Fidelity Index, Rf
  • 36.
    36 0 10 20 30 40 50 60 70 80 90 100 17 22 2615 16 23 6 24 18 9 8 7 25 14 10 12 5 20 4 21 13 11 3 19 1 2 FidelityIndexRf Setting ID in Rank OrderMost Liked Least Liked Fidelity and Preference? R2 = 0.06
  • 37.
    37 1 2 3 (Thesearen’t necessarily the most preferred sources possible, just the most preferred sources from this experiment).
  • 38.
    70 80 90 100 110 120 130 60 70 8090 100 IESTM-30Rg IES TM-30 Rf Model r2 = 0.68 p=0.000 p = 0.042 Dislike Like 5.5 5.0 4.5 4.0 3.5 Fidelity + Gamut and Preference?
  • 39.
    Same Fidelity, SameGamut, Significantly Different Rating.
  • 40.
    R² = 0.81 1 2 3 4 5 6 7 8 -30%-20% -10% 0% 10% 20% 30% MeanPreferenceRating Hue Bin 16 Chroma Shift (Rg,h16) Dislike Like Red Chroma Shift and Preference?
  • 41.
    Best Fit Modelfor Preference: Like-Dislike = 7.396 - 0.0408(Rf) + 103.4(Rcs,h16 3) - 9.949(Rcs,h16) R² = 0.9355 2.0 2.5 3.0 3.5 4.0 4.5 5.0 5.5 6.0 6.5 7.0 2 3 4 5 6 7 ParticipantRating(Preference) TM-30 Model Predicted Rating
  • 42.
    42 Normalness = Fidelity+ Red Fidelity/Saturation Saturation = Red Saturation Preference = Fidelity + Red Saturation Rf > 80 Rf,h1 > 80 0% < Rcs,h1 < 8% Maximize Rcs,h16, Rcs,h1 Rf > 74 0% < Rcs,h16 < 15% 0% < Rcs,h1 < 15% (Rg > 100) Context =
  • 43.
    60 70 80 90 100 110 120 130 140 50 60 7080 90 100 GamutIndex,Rg Fidelity Index, Rf Phosphor LED Color Mixed LED Hybrid LED Standard Halogen Filtered Halogen Triphosphor Fluorescent, 7XX Triphosphor Fluorescent, 8XX Triphosphor Fluorescent, 9XX Metal Halide Experimental Preferred Zone*
  • 44.
  • 45.
    Same Fidelity, SameGamut, Significantly Different Rating. LER = 343 LER = 311 Why so few red-enhancing sources?
  • 46.
    CIERaIESTM-30Rf Why so fewred-enhancing sources? Modelr2=0.06
  • 47.
    Common Commercially AvailableSources (Developed for Ra): Ra 74, LER 348 Ra 85, LER 343 Ra 83, LER 309
  • 48.
    Ra 80, LER272 “Enhanced” Sources: Ra 77, LER 136 Ra 87, LER 295
  • 49.
  • 50.
  • 51.
  • 52.
  • 53.
  • 54.
  • 55.
  • 56.
  • 57.
  • 58.
  • 59.
    UnderstandingTheTool 1. A metricvalue doesn’t tell you how the product will perform in any given environment. 2. The “accuracy”/applicability of the metric depends on if the sample set is similar to the actual space. 3. An average color rendering metric shouldn’t be used to predict how a source will render reds, or skin tones, or any specific set of objects. 4. TM-30 offers substantially more information, which is essential for evaluating color rendering characteristics. 5. The best source is depends on the context (objects, type of space/application, illuminance, occupants, etc.) 59
  • 60.
    Resources 60 IES Technical Memorandum(TM) 30-15 (Includes Excel Calculators): IES Method for Evaluating Light Source Color Rendition http://bit.ly/1IWZxVu Optics Express journal article that provides overview of the IES method: Development of the IES method for evaluating the color rendition of light sources http://bit.ly/1J32ftZ Application webinar co-sponsored by US Department of Energy and Illuminating Engineering Society: Understanding and Applying TM-30-15: IES Method for Evaluating Light Source Color Rendition http://1.usa.gov/1YEkbBZ Technical webinar co-sponsored by US Department of Energy and Illuminating Engineering Society: A Technical Discussion of TM-30-15: Why and How it Advances Color Rendition Metrics http://1.usa.gov/1Mn15LG LEUKOS journal article supporting TM-30’s technical foundations: Smet KAG, David A, Whitehead L. 2015. Why Color Space and Spectral Uniformity Are Essential for Color Rendering Measures. LEUKOS. 12(1,2):39-50. http://dx.doi.org/10.1080/15502724.2015.1091356
  • 61.
    Resources 61 LEUKOS editorial discussingnext steps: Royer MP. 2015. IES TM-30-15 Is Approved—Now What? Moving Forward with New Color Rendition Measures. LEUKOS. 12(1,2):3-5. http://dx.doi.org/10.1080/15502724.2015.1092752 Lighting Research and Technology, Open Letter: Correspondence: In support of the IES method of evaluating light source colour rendition (More than 30 authors) http://dx.doi.org/10.1177/1477153515617392 DOE Fact Sheet on TM-30 http://energy.gov/eere/ssl/downloads/evaluating-color-rendition-using-ies-tm-30-15 DOE TM-30 FAQs Page: http://energy.gov/eere/ssl/tm-30-frequently-asked-questions
  • 62.
    This concludes TheAmerican Institute of Architects Continuing Education Systems Course

Editor's Notes

  • #6 (DEMO 13/14)
  • #23 D22 Demo
  • #24 D22 Demo
  • #25 D22 Demo
  • #26 D22 Demo
  • #27 D22 Demo
  • #28 Experiment
  • #29 Experiment
  • #40 Things to watch out for in color preference experiments:
  • #46 Things to watch out for in color preference experiments:
  • #60 Average height example. Average favorite food.
  • #61 Average height example. Average favorite food.
  • #62 Average height example. Average favorite food.