Lundin Gold April 2024 Corporate Presentation v4.pdf
Keynote technicals daily report for 170212
1. Daily Technical Outlook
17th February 2012
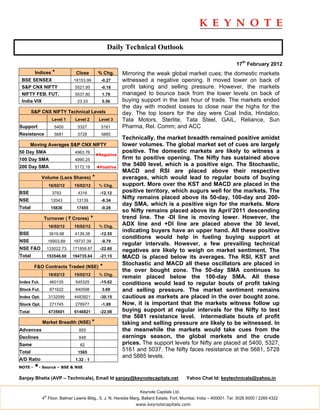
Indices * Close % Chg. Mirroring the weak global market cues; the domestic markets
BSE SENSEX 18153.99 -0.27 witnessed a negative opening. It moved lower on back of
S&P CNX NIFTY 5521.95 -0.18 profit taking and selling pressure. However, the markets
NIFTY FEB. FUT. 5537.80 1.79 managed to bounce back from the lower levels on back of
India VIX 23.33 5.56 buying support in the last hour of trade. The markets ended
the day with modest losses to close near the highs for the
S&P CNX NIFTY Technical Levels day. The top losers for the day were Coal India, Hindalco,
Level 1 Level 2 Level 3 Tata Motors, Sterlite, Tata Steel, GAIL, Reliance, Sun
Support 5400 5327 5161 Pharma, Rel. Comm; and ACC
Resistance 5681 5728 5885
Technically, the market breadth remained positive amidst
Moving Averages S&P CNX NIFTY lower volumes. The global market set of cues are largely
50 Day SMA 4963.76 positive. The domestic markets are likely to witness a
◄Negative
100 Day SMA 4990.25 firm to positive opening. The Nifty has sustained above
200 Day SMA 5172.19 ◄Positive
the 5400 level, which is a positive sign. The Stochastic,
MACD and RSI are placed above their respective
Volume (Lacs Shares) * averages, which would lead to regular bouts of buying
16/02/12 15/02/12 % Chg. support. More over the KST and MACD are placed in the
BSE 3793 4316 -12.12 positive territory, which augurs well for the markets. The
NSE 12043 13139 -8.34
Nifty remains placed above its 50-day, 100-day and 200-
day SMA, which is a positive sign for the markets. More
Total 15836 17455 -9.28
so Nifty remains placed above its April’2011 descending
Turnover ( ` Crores) * trend line. The -DI line is moving lower. However, the
16/02/12 15/02/12 % Chg.
ADX line and +DI line are placed above the 30 level,
indicating buyers have an upper hand. All these positive
BSE 3619.98 4139.38 -12.55
conditions would help in fueling buying support at
NSE 16903.89 18737.39 -9.79
regular intervals. However, a few prevailing technical
NSE F&O 133022.73 171858.87 -22.60 negatives are likely to weigh on market sentiment. The
Total 153546.60 194735.64 -21.15 MACD is placed below its averages. The RSI, KST and
Stochastic and MACD all these oscillators are placed in
F&O Contracts Traded (NSE) *
the over bought zone. The 50-day SMA continues to
16/02/12 15/02/12 % Chg.
remain placed below the 100-day SMA. All these
Index Fut. 460135 545325 -15.62 conditions would lead to regular bouts of profit taking
Stock Fut. 871622 840598 3.69 and selling pressure. The market sentiment remains
Index Opt. 3132099 4483921 -30.15 cautious as markets are placed in the over bought zone.
Stock Opt. 271745 276977 -1.89 Now, it is important that the markets witness follow up
Total 4735601 6146821 -22.08 buying support at regular intervals for the Nifty to test
the 5681 resistance level. Intermediate bouts of profit
Market Breadth (NSE) * taking and selling pressure are likely to be witnessed. In
Advances 855 the meanwhile the markets would take cues from the
Declines 648 earnings season, the global markets and the crude
Same 62 prices. The support levels for Nifty are placed at 5400, 5327,
Total 1565
5161 and 5037. The Nifty faces resistance at the 5681, 5728
and 5885 levels.
A/D Ratio 1.32 : 1
NOTE - *- Source – BSE & NSE
Sanjay Bhatia (AVP – Technicals), Email Id sanjay@keynotecapitals.net Yahoo Chat Id: keytechnicals@yahoo.in
Keynote Capitals Ltd.
th
4 Floor, Balmer Lawrie Bldg., 5, J. N. Heredia Marg, Ballard Estate, Fort, Mumbai, India – 400001. Tel: 3026 6000 / 2269 4322
www.keynotecapitals.com
2. Short Term Trading Ideas Based On Technical Analysis (5 - 7 Days)
Stop
Initiation Stop Loss Target
Stock Close Action Price Loss * (%) Target (%) Remarks
Ashok Leyland 30.00 Buy Above 30.50 28.50 6.56 35 13.11
TGT of 1780
Achieved
given Buy @
1709 on
Bajaj Auto 1811.60 Buy Above 1815.00 1777.00 2.09 1900 4.68 10/02/12
BGR Energy 312.40 Buy Above 315.00 302.00 4.13 344 9.21
* Stop Losses are to be considered strictly on Closing basis.
Intra-day Resistance Intra-day Support
Indices Close Pivot Point R1 R2 R3 S1 S2 S3
BSE SENSEX 18154 18127 18210 18266 18406 18071 17987 17848
S&P CNX NIFTY 5522 5512 5541 5560 5608 5493 5465 5417
NIFTY FEB. FUT. 5538 5529 5556 5574 5619 5511 5483 5438
Keynote Capitals Ltd.
th
4 Floor, Balmer Lawrie Bldg., 5, J. N. Heredia Marg, Ballard Estate, Fort, Mumbai, India – 400001. Tel: 3026 6000 / 2269 4322
www.keynotecapitals.com
3. Disclaimer
This document is not for public distribution and has been furnished to you solely for your information and must not be
reproduced or redistributed to any other person. Persons into whose possession this document may come are
required to observe these restrictions.
This material is for the personal information of the authorized recipient, and we are not soliciting any action based
upon it. This report is not to be construed as an offer to sell or the solicitation of an offer to buy any security in any
jurisdiction where such an offer or solicitation would be illegal. It is for the general information of clients of Keynote
Capitals Ltd. It does not constitute a personal recommendation or take into account the particular investment
objectives, financial situations, or needs of individual clients.
We have reviewed the report, and in so far as it includes current or historical information, it is believed to be reliable
though its accuracy or completeness cannot be guaranteed. Neither Keynote Capitals Ltd., nor any person connected
with it, accepts any liability arising from the use of this document. The recipients of this material should rely on their
own investigations and take their own professional advice. Price and value of the investments referred to in this
material may go up or down. Past performance is not a guide for future performance. Certain transactions -including
those involving futures, options and other derivatives as well as non-investment grade securities - involve substantial
risk and are not suitable for all investors. Reports based on technical analysis centers on studying charts of a stock’s
price movement and trading volume, as opposed to focusing on a company’s fundamentals and as such, may not
match with a report on a company’s fundamentals.
Opinions expressed are our current opinions as of the date appearing on this material only. While we endeavor to
update on a reasonable basis the information discussed in this material, there may be regulatory, compliance, or
other reasons that prevent us from doing so. Prospective investors and others are cautioned that any forward-looking
statements are not predictions and may be subject to change without notice. Our proprietary trading and investment
businesses may make investment decisions that are inconsistent with the recommendations expressed herein.
We and our affiliates, officers, directors, and employees world wide may: (a) from time to time, have long or short
positions in, and buy or sell the securities thereof, of company (ies) mentioned herein or (b) be engaged in any other
transaction involving such securities and earn brokerage or other compensation or act as a market maker in the
financial instruments of the company (ies) discussed herein or act as advisor or lender / borrower to such company
(ies) or have other potential conflict of interest with respect to any recommendation and related information and
opinions.
The analyst for this report certifies that all of the views expressed in this report accurately reflect his or her personal
views about the subject company or companies and its or their securities, and no part of his or her compensation
was, is or will be, directly or indirectly related to specific recommendations or views expressed in this report.
No part of this material may be duplicated in any form and/or redistributed without Keynote Capitals Ltd’s., prior
written consent.
Keynote Capitals Ltd.
th
4 Floor, Balmer Lawrie Bldg., 5, J. N. Heredia Marg, Ballard Estate, Fort, Mumbai, India – 400001. Tel: 3026 6000 / 2269 4322
www.keynotecapitals.com