1. Daily Technical Outlook
18th January 2012
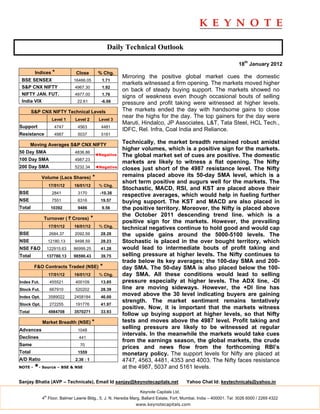
Indices * Close % Chg.
Mirroring the positive global market cues the domestic
BSE SENSEX 16466.05 1.71
markets witnessed a firm opening. The markets moved higher
S&P CNX NIFTY 4967.30 1.92
on back of steady buying support. The markets showed no
NIFTY JAN. FUT. 4977.00 1.76
signs of weakness even though occasional bouts of selling
India VIX 22.61 -6.06 pressure and profit taking were witnessed at higher levels.
S&P CNX NIFTY Technical Levels The markets ended the day with handsome gains to close
near the highs for the day. The top gainers for the day were
Level 1 Level 2 Level 3
Maruti, Hindalco, JP Associates, L&T, Tata Steel, HCL Tech.,
Support 4747 4563 4481
IDFC, Rel. Infra, Coal India and Reliance.
Resistance 4987 5037 5161
Moving Averages S&P CNX NIFTY
Technically, the market breadth remained robust amidst
higher volumes, which is a positive sign for the markets.
50 Day SMA 4836.86
◄Negative The global market set of cues are positive. The domestic
100 Day SMA 4987.23
markets are likely to witness a flat opening. The Nifty
200 Day SMA 5232.34 ◄Negative closes just short of the 4987 resistance level. The Nifty
Volume (Lacs Shares) * remains placed above its 50-day SMA level, which is a
short term positive and augurs well for the markets. The
17/01/12 16/01/12 % Chg.
Stochastic, MACD, RSI, and KST are placed above their
BSE 2841 3170 -10.38
respective averages, which would help in fueling further
NSE 7551 6316 19.57 buying support. The KST and MACD are also placed in
Total 10392 9486 9.56 the positive territory. Moreover, the Nifty is placed above
the October 2011 descending trend line. which is a
Turnover ( ` Crores) *
positive sign for the markets. However, the prevailing
17/01/12 16/01/12 % Chg. technical negatives continue to hold good and would cap
BSE 2684.37 2092.59 28.28 the upside gains around the 5000-5100 levels. The
NSE 12180.13 9498.59 28.23 Stochastic is placed in the over bought territory, which
NSE F&O 122915.63 86999.25 41.28 would lead to intermediate bouts of profit taking and
Total 137780.13 98590.43 39.75 selling pressure at higher levels. The Nifty continues to
trade below its key averages; the 100-day SMA and 200-
F&O Contracts Traded (NSE) * day SMA. The 50-day SMA is also placed below the 100-
17/01/12 16/01/12 % Chg. day SMA. All these conditions would lead to selling
Index Fut. 455521 400109 13.85 pressure especially at higher levels. The ADX line, -DI
Stock Fut. 667910 520202 28.39 line are moving sideways. However, the +DI line has
Index Opt. 3589022 2458184 46.00
moved above the 30 level indicating buyers are gaining
strength. The market sentiment remains tentatively
Stock Opt. 272255 191776 41.97
positive. Now, it is important that the markets witness
Total 4984708 3570271 33.93
follow up buying support at higher levels, so that Nifty
Market Breadth (NSE) * tests and moves above the 4987 level. Profit taking and
Advances 1048
selling pressure are likely to be witnessed at regular
intervals. In the meanwhile the markets would take cues
Declines 441
from the earnings season, the global markets, the crude
Same 70
prices and news flow from the forthcoming RBI’s
Total 1559 monetary policy. The support levels for Nifty are placed at
A/D Ratio 2.38 : 1 4747, 4563, 4481, 4353 and 4003. The Nifty faces resistance
NOTE - *- Source – BSE & NSE at the 4987, 5037 and 5161 levels.
Sanjay Bhatia (AVP – Technicals), Email Id sanjay@keynotecapitals.net Yahoo Chat Id: keytechnicals@yahoo.in
Keynote Capitals Ltd.
th
4 Floor, Balmer Lawrie Bldg., 5, J. N. Heredia Marg, Ballard Estate, Fort, Mumbai, India – 400001. Tel: 3026 6000 / 2269 4322
www.keynotecapitals.com
2. Short Term Trading Ideas Based On Technical Analysis (5 - 7 Days)
Stop
Initiation Stop Loss Target
Stock Close Action Price Loss * (%) Target (%) Remarks
Aban 422.15 Buy Above 425.00 407.00 4.24 465 9.41
TGT of 720
Achieved
given Buy @
686 on
ABB 738.70 Buy Above 743.00 730.50 1.68 770 3.63 13/01/11
Cairn 345.45 Buy Above 348.00 337.00 3.16 372 6.90
* Stop Losses are to be considered strictly on Closing basis.
Intra-day Resistance Intra-day Support
Indices Close Pivot Point R1 R2 R3 S1 S2 S3
BSE SENSEX 16466 16413 16555 16643 16874 16324 16182 15952
S&P CNX NIFTY 4967 4949 4994 5021 5092 4922 4877 4806
NIFTY JAN. FUT. 4977 4959 5006 5035 5111 4930 4883 4808
Keynote Capitals Ltd.
th
4 Floor, Balmer Lawrie Bldg., 5, J. N. Heredia Marg, Ballard Estate, Fort, Mumbai, India – 400001. Tel: 3026 6000 / 2269 4322
www.keynotecapitals.com
3. Disclaimer
This document is not for public distribution and has been furnished to you solely for your information and must not be
reproduced or redistributed to any other person. Persons into whose possession this document may come are
required to observe these restrictions.
This material is for the personal information of the authorized recipient, and we are not soliciting any action based
upon it. This report is not to be construed as an offer to sell or the solicitation of an offer to buy any security in any
jurisdiction where such an offer or solicitation would be illegal. It is for the general information of clients of Keynote
Capitals Ltd. It does not constitute a personal recommendation or take into account the particular investment
objectives, financial situations, or needs of individual clients.
We have reviewed the report, and in so far as it includes current or historical information, it is believed to be reliable
though its accuracy or completeness cannot be guaranteed. Neither Keynote Capitals Ltd., nor any person connected
with it, accepts any liability arising from the use of this document. The recipients of this material should rely on their
own investigations and take their own professional advice. Price and value of the investments referred to in this
material may go up or down. Past performance is not a guide for future performance. Certain transactions -including
those involving futures, options and other derivatives as well as non-investment grade securities - involve substantial
risk and are not suitable for all investors. Reports based on technical analysis centers on studying charts of a stock’s
price movement and trading volume, as opposed to focusing on a company’s fundamentals and as such, may not
match with a report on a company’s fundamentals.
Opinions expressed are our current opinions as of the date appearing on this material only. While we endeavor to
update on a reasonable basis the information discussed in this material, there may be regulatory, compliance, or
other reasons that prevent us from doing so. Prospective investors and others are cautioned that any forward-looking
statements are not predictions and may be subject to change without notice. Our proprietary trading and investment
businesses may make investment decisions that are inconsistent with the recommendations expressed herein.
We and our affiliates, officers, directors, and employees world wide may: (a) from time to time, have long or short
positions in, and buy or sell the securities thereof, of company (ies) mentioned herein or (b) be engaged in any other
transaction involving such securities and earn brokerage or other compensation or act as a market maker in the
financial instruments of the company (ies) discussed herein or act as advisor or lender / borrower to such company
(ies) or have other potential conflict of interest with respect to any recommendation and related information and
opinions.
The analyst for this report certifies that all of the views expressed in this report accurately reflect his or her personal
views about the subject company or companies and its or their securities, and no part of his or her compensation
was, is or will be, directly or indirectly related to specific recommendations or views expressed in this report.
No part of this material may be duplicated in any form and/or redistributed without Keynote Capitals Ltd’s., prior
written consent.
Keynote Capitals Ltd.
th
4 Floor, Balmer Lawrie Bldg., 5, J. N. Heredia Marg, Ballard Estate, Fort, Mumbai, India – 400001. Tel: 3026 6000 / 2269 4322
www.keynotecapitals.com