Getting Real with AI - Columbus DAW - May 2024 - Nick Woo from AlignAI
Keynote technicals daily report for 070212
1. Daily Technical Outlook
7th February 2012
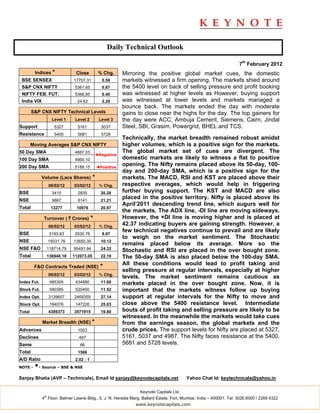
Indices * Close % Chg. Mirroring the positive global market cues, the domestic
BSE SENSEX 17707.31 0.58 markets witnessed a firm opening. The markets shied around
S&P CNX NIFTY 5361.65 0.67 the 5400 level on back of selling pressure and profit booking
NIFTY FEB. FUT. 5366.85 0.40 was witnessed at higher levels as However, buying support
India VIX 24.62 2.20 was witnessed at lower levels and markets managed a
bounce back. The markets ended the day with moderate
S&P CNX NIFTY Technical Levels gains to close near the highs for the day. The top gainers for
Level 1 Level 2 Level 3 the day were ACC, Ambuja Cement, Siemens, Cairn, Jindal
Support 5327 5161 5037 Steel, SBI, Grasim, Powergrid, BHEL and TCS.
Resistance 5400 5681 5728
Technically, the market breadth remained robust amidst
Moving Averages S&P CNX NIFTY higher volumes, which is a positive sign for the markets.
50 Day SMA 4887.03 The global market set of cues are divergent. The
◄Negative
100 Day SMA 4960.10 domestic markets are likely to witness a flat to positive
200 Day SMA 5188.15 ◄Positive
opening. The Nifty remains placed above its 50-day, 100-
day and 200-day SMA, which is a positive sign for the
Volume (Lacs Shares) * markets. The MACD, RSI and KST are placed above their
06/02/12 03/02/12 % Chg. respective averages, which would help in triggering
BSE 3410 2835 20.28 further buying support. The KST and MACD are also
NSE 9867 8141 21.21
placed in the positive territory. Nifty is placed above its
April’2011 descending trend line, which augurs well for
Total 13277 10976 20.97
the markets. The ADX line, -DI line are moving sideways.
Turnover ( ` Crores) * However, the +DI line is moving higher and is placed at
06/02/12 03/02/12 % Chg.
42.37 indicating buyers are gaining strength. However, a
few technical negatives continue to prevail and are likely
BSE 3193.63 2930.76 8.97
to weigh on the market sentiment. The Stochastic
NSE 15031.76 13650.35 10.12
remains placed below its average. More so the
NSE F&O 118714.79 95491.94 24.32 Stochastic and RSI are placed in the over bought zone.
Total 136940.18 112073.05 22.19 The 50-day SMA is also placed below the 100-day SMA.
All these conditions would lead to profit taking and
F&O Contracts Traded (NSE) *
selling pressure at regular intervals, especially at higher
06/02/12 03/02/12 % Chg.
levels. The market sentiment remains cautious as
Index Fut. 485305 434880 11.60 markets placed in the over bought zone. Now, it is
Stock Fut. 580385 520450 11.52 important that the markets witness follow up buying
Index Opt. 3139607 2469359 27.14 support at regular intervals for the Nifty to move and
Stock Opt. 184076 147226 25.03 close above the 5400 resistance level. Intermediate
Total 4389373 3571915 19.80 bouts of profit taking and selling pressure are likely to be
witnessed. In the meanwhile the markets would take cues
Market Breadth (NSE) * from the earnings season, the global markets and the
Advances 1003 crude prices. The support levels for Nifty are placed at 5327,
Declines 497 5161, 5037 and 4987. The Nifty faces resistance at the 5400,
Same 66 5681 and 5728 levels.
Total 1566
A/D Ratio 2.02 : 1
NOTE - *- Source – BSE & NSE
Sanjay Bhatia (AVP – Technicals), Email Id sanjay@keynotecapitals.net Yahoo Chat Id: keytechnicals@yahoo.in
Keynote Capitals Ltd.
th
4 Floor, Balmer Lawrie Bldg., 5, J. N. Heredia Marg, Ballard Estate, Fort, Mumbai, India – 400001. Tel: 3026 6000 / 2269 4322
www.keynotecapitals.com
2. Short Term Trading Ideas Based On Technical Analysis (5 - 7 Days)
Stop
Initiation Stop Loss Target
Stock Close Action Price Loss * (%) Target (%) Remarks
TGT of 915
Achieved
given Buy @
865 on
ABB 881.00 Buy Above 890.00 908.00 -2.02 930 4.49 03/02/12
TGT of 1300
Achieved
given Buy @
1255 on
ACC 1340.00 Buy Above 1345.00 1320.00 1.86 1400 4.09 03/02/12
Cairn 356.30 Buy Above 360.00 351.00 2.50 380 5.56
* Stop Losses are to be considered strictly on Closing basis.
Intra-day Resistance Intra-day Support
Indices Close Pivot Point R1 R2 R3 S1 S2 S3
BSE SENSEX 17707 17711 17826 17945 18180 17592 17476 17241
S&P CNX NIFTY 5362 5360 5392 5422 5485 5329 5297 5234
NIFTY FEB. FUT. 5367 5366 5399 5431 5497 5334 5300 5235
Keynote Capitals Ltd.
th
4 Floor, Balmer Lawrie Bldg., 5, J. N. Heredia Marg, Ballard Estate, Fort, Mumbai, India – 400001. Tel: 3026 6000 / 2269 4322
www.keynotecapitals.com
3. Disclaimer
This document is not for public distribution and has been furnished to you solely for your information and must not be
reproduced or redistributed to any other person. Persons into whose possession this document may come are
required to observe these restrictions.
This material is for the personal information of the authorized recipient, and we are not soliciting any action based
upon it. This report is not to be construed as an offer to sell or the solicitation of an offer to buy any security in any
jurisdiction where such an offer or solicitation would be illegal. It is for the general information of clients of Keynote
Capitals Ltd. It does not constitute a personal recommendation or take into account the particular investment
objectives, financial situations, or needs of individual clients.
We have reviewed the report, and in so far as it includes current or historical information, it is believed to be reliable
though its accuracy or completeness cannot be guaranteed. Neither Keynote Capitals Ltd., nor any person connected
with it, accepts any liability arising from the use of this document. The recipients of this material should rely on their
own investigations and take their own professional advice. Price and value of the investments referred to in this
material may go up or down. Past performance is not a guide for future performance. Certain transactions -including
those involving futures, options and other derivatives as well as non-investment grade securities - involve substantial
risk and are not suitable for all investors. Reports based on technical analysis centers on studying charts of a stock’s
price movement and trading volume, as opposed to focusing on a company’s fundamentals and as such, may not
match with a report on a company’s fundamentals.
Opinions expressed are our current opinions as of the date appearing on this material only. While we endeavor to
update on a reasonable basis the information discussed in this material, there may be regulatory, compliance, or
other reasons that prevent us from doing so. Prospective investors and others are cautioned that any forward-looking
statements are not predictions and may be subject to change without notice. Our proprietary trading and investment
businesses may make investment decisions that are inconsistent with the recommendations expressed herein.
We and our affiliates, officers, directors, and employees world wide may: (a) from time to time, have long or short
positions in, and buy or sell the securities thereof, of company (ies) mentioned herein or (b) be engaged in any other
transaction involving such securities and earn brokerage or other compensation or act as a market maker in the
financial instruments of the company (ies) discussed herein or act as advisor or lender / borrower to such company
(ies) or have other potential conflict of interest with respect to any recommendation and related information and
opinions.
The analyst for this report certifies that all of the views expressed in this report accurately reflect his or her personal
views about the subject company or companies and its or their securities, and no part of his or her compensation
was, is or will be, directly or indirectly related to specific recommendations or views expressed in this report.
No part of this material may be duplicated in any form and/or redistributed without Keynote Capitals Ltd’s., prior
written consent.
Keynote Capitals Ltd.
th
4 Floor, Balmer Lawrie Bldg., 5, J. N. Heredia Marg, Ballard Estate, Fort, Mumbai, India – 400001. Tel: 3026 6000 / 2269 4322
www.keynotecapitals.com