1. Daily Technical Outlook
19th March 2012
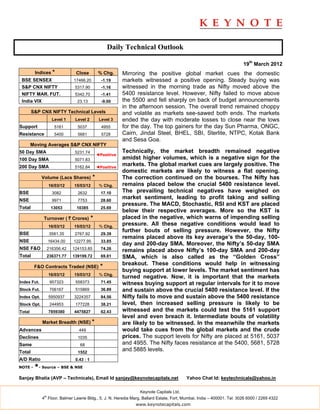
Indices * Close % Chg. Mirroring the positive global market cues the domestic
BSE SENSEX 17466.20 -1.19 markets witnessed a positive opening. Steady buying was
S&P CNX NIFTY 5317.90 -1.16 witnessed in the morning trade as Nifty moved above the
NIFTY MAR. FUT. 5342.70 -1.41 5400 resistance level. However, Nifty failed to move above
India VIX 23.13 -9.00 the 5500 and fell sharply on back of budget announcements
in the afternoon session. The overall trend remained choppy
S&P CNX NIFTY Technical Levels and volatile as markets see-sawed both ends. The markets
Level 1 Level 2 Level 3 ended the day with moderate losses to close near the lows
Support 5161 5037 4955 for the day. The top gainers for the day Sun Pharma, ONGC,
Resistance 5400 5681 5728 Cairn, Jindal Steel, BHEL, SBI, Sterlite, NTPC, Kotak Bank
and Sesa Goa.
Moving Averages S&P CNX NIFTY
50 Day SMA 5231.74 Technically, the market breadth remained negative
◄Positive
100 Day SMA 5071.83 amidst higher volumes, which is a negative sign for the
200 Day SMA 5162.84 ◄Positive
markets. The global market cues are largely positive. The
domestic markets are likely to witness a flat opening.
Volume (Lacs Shares) * The correction continued on the bourses. The Nifty has
16/03/12 15/03/12 % Chg. remains placed below the crucial 5400 resistance level.
BSE 3082 2632 17.10 The prevailing technical negatives have weighed on
NSE 9971 7753 28.60
market sentiment, leading to profit taking and selling
pressure. The MACD, Stochastic, RSI and KST are placed
Total 13053 10385 25.69
below their respective averages. More so the KST is
Turnover ( ` Crores) * placed in the negative, which warns of impending selling
16/03/12 15/03/12 % Chg.
pressure. All these negative conditions would lead to
further bouts of selling pressure. However, the Nifty
BSE 3581.35 2767.92 29.39
remains placed above its key average’s the 50-day, 100-
NSE 16434.00 12277.95 33.85
day and 200-day SMA. Moreover, the Nifty’s 50-day SMA
NSE F&O 216356.42 124153.85 74.26 remains placed above Nifty’s 100-day SMA and 200-day
Total 236371.77 139199.72 69.81 SMA, which is also called as the “Golden Cross”
breakout. These conditions would help in witnessing
F&O Contracts Traded (NSE) *
buying support at lower levels. The market sentiment has
16/03/12 15/03/12 % Chg.
turned negative. Now, it is important that the markets
Index Fut. 957323 558373 71.45 witness buying support at regular intervals for it to move
Stock Fut. 706167 515869 36.89 and sustain above the crucial 5400 resistance level. If the
Index Opt. 5950937 3224357 84.56 Nifty fails to move and sustain above the 5400 resistance
Stock Opt. 244953 177228 38.21 level, then increased selling pressure is likely to be
Total 7859380 4475827 62.43 witnessed and the markets could test the 5161 support
level and even breach it. Intermediate bouts of volatility
Market Breadth (NSE) * are likely to be witnessed. In the meanwhile the markets
Advances 449 would take cues from the global markets and the crude
Declines 1035 prices. The support levels for Nifty are placed at 5161, 5037
Same 68 and 4955. The Nifty faces resistance at the 5400, 5681, 5728
Total 1552
and 5885 levels.
A/D Ratio 0.43 : 1
NOTE - *- Source – BSE & NSE
Sanjay Bhatia (AVP – Technicals), Email Id sanjay@keynotecapitals.net Yahoo Chat Id: keytechnicals@yahoo.in
Keynote Capitals Ltd.
th
4 Floor, Balmer Lawrie Bldg., 5, J. N. Heredia Marg, Ballard Estate, Fort, Mumbai, India – 400001. Tel: 3026 6000 / 2269 4322
www.keynotecapitals.com
2. Short Term Trading Ideas Based On Technical Analysis (5 - 7 Days)
Stop
Initiation Stop Loss Target
Stock Close Action Price Loss * (%) Target (%) Remarks
Allahabad Bank 189.70 Sell Below 187.00 190.15 1.68 180.00 3.74
Bharti Airtel 327.55 Sell Below 327.00 332.00 1.53 316.00 3.36
BHEL 273.60 Sell Below 271.00 280.00 3.32 251.00 7.38
HCC 26.45 Sell Below 26.00 27.35 5.19 23.00 11.54
HDIL 99.00 Sell Below 98.00 100.25 2.30 93.00 5.10
* Stop Losses are to be considered strictly on Closing basis.
Intra-day Resistance Intra-day Support
Indices Close Pivot Point R1 R2 R3 S1 S2 S3
BSE SENSEX 17466 17588 17749 18032 18477 17305 17144 16699
S&P CNX NIFTY 5318 5356 5407 5497 5637 5267 5216 5075
NIFTY MAR. FUT. 5343 5385 5440 5536 5688 5288 5234 5082
Keynote Capitals Ltd.
th
4 Floor, Balmer Lawrie Bldg., 5, J. N. Heredia Marg, Ballard Estate, Fort, Mumbai, India – 400001. Tel: 3026 6000 / 2269 4322
www.keynotecapitals.com
3. Disclaimer
This document is not for public distribution and has been furnished to you solely for your information and must not be
reproduced or redistributed to any other person. Persons into whose possession this document may come are
required to observe these restrictions.
This material is for the personal information of the authorized recipient, and we are not soliciting any action based
upon it. This report is not to be construed as an offer to sell or the solicitation of an offer to buy any security in any
jurisdiction where such an offer or solicitation would be illegal. It is for the general information of clients of Keynote
Capitals Ltd. It does not constitute a personal recommendation or take into account the particular investment
objectives, financial situations, or needs of individual clients.
We have reviewed the report, and in so far as it includes current or historical information, it is believed to be reliable
though its accuracy or completeness cannot be guaranteed. Neither Keynote Capitals Ltd., nor any person connected
with it, accepts any liability arising from the use of this document. The recipients of this material should rely on their
own investigations and take their own professional advice. Price and value of the investments referred to in this
material may go up or down. Past performance is not a guide for future performance. Certain transactions -including
those involving futures, options and other derivatives as well as non-investment grade securities - involve substantial
risk and are not suitable for all investors. Reports based on technical analysis centers on studying charts of a stock’s
price movement and trading volume, as opposed to focusing on a company’s fundamentals and as such, may not
match with a report on a company’s fundamentals.
Opinions expressed are our current opinions as of the date appearing on this material only. While we endeavor to
update on a reasonable basis the information discussed in this material, there may be regulatory, compliance, or
other reasons that prevent us from doing so. Prospective investors and others are cautioned that any forward-looking
statements are not predictions and may be subject to change without notice. Our proprietary trading and investment
businesses may make investment decisions that are inconsistent with the recommendations expressed herein.
We and our affiliates, officers, directors, and employees world wide may: (a) from time to time, have long or short
positions in, and buy or sell the securities thereof, of company (ies) mentioned herein or (b) be engaged in any other
transaction involving such securities and earn brokerage or other compensation or act as a market maker in the
financial instruments of the company (ies) discussed herein or act as advisor or lender / borrower to such company
(ies) or have other potential conflict of interest with respect to any recommendation and related information and
opinions.
The analyst for this report certifies that all of the views expressed in this report accurately reflect his or her personal
views about the subject company or companies and its or their securities, and no part of his or her compensation
was, is or will be, directly or indirectly related to specific recommendations or views expressed in this report.
No part of this material may be duplicated in any form and/or redistributed without Keynote Capitals Ltd’s., prior
written consent.
Keynote Capitals Ltd.
th
4 Floor, Balmer Lawrie Bldg., 5, J. N. Heredia Marg, Ballard Estate, Fort, Mumbai, India – 400001. Tel: 3026 6000 / 2269 4322
www.keynotecapitals.com