BPPG response - Options for Defined Benefit schemes - 19Apr24.pdf
Keynote technicals daily report for 310112
1. Daily Technical Outlook
31st January 2012
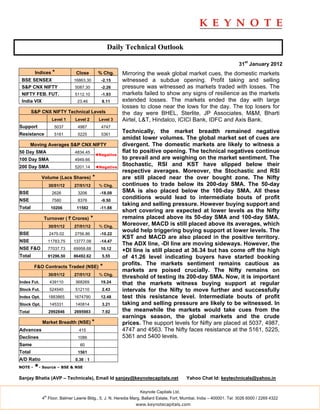
Indices * Close % Chg. Mirroring the weak global market cues, the domestic markets
BSE SENSEX 16863.30 -2.15 witnessed a subdue opening. Profit taking and selling
S&P CNX NIFTY 5087.30 -2.26 pressure was witnessed as markets traded with losses. The
NIFTY FEB. FUT. 5112.10 -1.93 markets failed to show any signs of resilience as the markets
India VIX 23.46 8.11 extended losses. The markets ended the day with large
losses to close near the lows for the day. The top losers for
S&P CNX NIFTY Technical Levels the day were BHEL, Sterlite, JP Associates, M&M, Bharti
Level 1 Level 2 Level 3 Airtel, L&T, Hindalco, ICICI Bank, IDFC and Axis Bank.
Support 5037 4987 4747
Resistance 5161 5225 5361
Technically, the market breadth remained negative
amidst lower volumes. The global market set of cues are
Moving Averages S&P CNX NIFTY divergent. The domestic markets are likely to witness a
50 Day SMA 4834.45 flat to positive opening. The technical negatives continue
◄Negative
100 Day SMA 4949.66 to prevail and are weighing on the market sentiment. The
200 Day SMA 5201.14 ◄Negative
Stochastic, RSI and KST have slipped below their
respective averages. Moreover, the Stochastic and RSI
Volume (Lacs Shares) * are still placed near the over bought zone. The Nifty
30/01/12 27/01/12 % Chg. continues to trade below its 200-day SMA. The 50-day
BSE 2626 3206 -18.09 SMA is also placed below the 100-day SMA. All these
NSE 7580 8376 -9.50
conditions would lead to intermediate bouts of profit
taking and selling pressure. However buying support and
Total 10206 11582 -11.88
short covering are expected at lower levels as the Nifty
Turnover ( ` Crores) * remains placed above its 50-day SMA and 100-day SMA.
30/01/12 27/01/12 % Chg.
Moreover, MACD is still placed above its averages, which
would help triggering buying support at lower levels. The
BSE 2475.02 2756.86 -10.22
KST and MACD are also placed in the positive territory.
NSE 11783.75 13777.08 -14.47
The ADX line, -DI line are moving sideways. However, the
NSE F&O 77037.73 69958.68 10.12 +DI line is still placed at 36.34 but has come off the high
Total 91296.50 86492.62 5.55 of 41.26 level indicating buyers have started booking
profits. The markets sentiment remains cautious as
F&O Contracts Traded (NSE) *
markets are poised crucially. The Nifty remains on
30/01/12 27/01/12 % Chg.
threshold of testing its 200-day SMA. Now, it is important
Index Fut. 439110 368269 19.24 that the markets witness buying support at regular
Stock Fut. 524540 512110 2.43 intervals for the Nifty to move further and successfully
Index Opt. 1883865 1674790 12.48 test this resistance level. Intermediate bouts of profit
Stock Opt. 145331 140814 3.21 taking and selling pressure are likely to be witnessed. In
Total 2992846 2695983 7.92 the meanwhile the markets would take cues from the
earnings season, the global markets and the crude
Market Breadth (NSE) * prices. The support levels for Nifty are placed at 5037, 4987,
Advances 415 4747 and 4563. The Nifty faces resistance at the 5161, 5225,
Declines 1086 5361 and 5400 levels.
Same 60
Total 1561
A/D Ratio 0.38 : 1
NOTE - *- Source – BSE & NSE
Sanjay Bhatia (AVP – Technicals), Email Id sanjay@keynotecapitals.net Yahoo Chat Id: keytechnicals@yahoo.in
Keynote Capitals Ltd.
th
4 Floor, Balmer Lawrie Bldg., 5, J. N. Heredia Marg, Ballard Estate, Fort, Mumbai, India – 400001. Tel: 3026 6000 / 2269 4322
www.keynotecapitals.com
2. Short Term Trading Ideas Based On Technical Analysis (5 - 7 Days)
Stop
Initiation Stop Loss Target
Stock Close Action Price Loss * (%) Target (%) Remarks
TGT of 80
Achieved
given SELL
@ 83.50 on
Adani Power 78.85 Sell Below 78.00 81.60 4.62 70 10.26 30/01/12
Andhra Bank 99.80 Sell Below 99.00 102.60 3.64 91.00 8.08
APIL 333.00 Sell Below 330.00 350.25 6.14 285.00 13.64
Dabur 92.50 Sell Below 90.00 91.80 2.00 86.00 4.44
* Stop Losses are to be considered strictly on Closing basis.
Intra-day Resistance Intra-day Support
Indices Close Pivot Point R1 R2 R3 S1 S2 S3
BSE SENSEX 16863 16943 17058 17253 17563 16748 16634 16324
S&P CNX NIFTY 5087 5110 5143 5200 5289 5054 5021 4931
NIFTY FEB. FUT. 5112 5134 5168 5223 5312 5079 5046 4957
Keynote Capitals Ltd.
th
4 Floor, Balmer Lawrie Bldg., 5, J. N. Heredia Marg, Ballard Estate, Fort, Mumbai, India – 400001. Tel: 3026 6000 / 2269 4322
www.keynotecapitals.com
3. Disclaimer
This document is not for public distribution and has been furnished to you solely for your information and must not be
reproduced or redistributed to any other person. Persons into whose possession this document may come are
required to observe these restrictions.
This material is for the personal information of the authorized recipient, and we are not soliciting any action based
upon it. This report is not to be construed as an offer to sell or the solicitation of an offer to buy any security in any
jurisdiction where such an offer or solicitation would be illegal. It is for the general information of clients of Keynote
Capitals Ltd. It does not constitute a personal recommendation or take into account the particular investment
objectives, financial situations, or needs of individual clients.
We have reviewed the report, and in so far as it includes current or historical information, it is believed to be reliable
though its accuracy or completeness cannot be guaranteed. Neither Keynote Capitals Ltd., nor any person connected
with it, accepts any liability arising from the use of this document. The recipients of this material should rely on their
own investigations and take their own professional advice. Price and value of the investments referred to in this
material may go up or down. Past performance is not a guide for future performance. Certain transactions -including
those involving futures, options and other derivatives as well as non-investment grade securities - involve substantial
risk and are not suitable for all investors. Reports based on technical analysis centers on studying charts of a stock’s
price movement and trading volume, as opposed to focusing on a company’s fundamentals and as such, may not
match with a report on a company’s fundamentals.
Opinions expressed are our current opinions as of the date appearing on this material only. While we endeavor to
update on a reasonable basis the information discussed in this material, there may be regulatory, compliance, or
other reasons that prevent us from doing so. Prospective investors and others are cautioned that any forward-looking
statements are not predictions and may be subject to change without notice. Our proprietary trading and investment
businesses may make investment decisions that are inconsistent with the recommendations expressed herein.
We and our affiliates, officers, directors, and employees world wide may: (a) from time to time, have long or short
positions in, and buy or sell the securities thereof, of company (ies) mentioned herein or (b) be engaged in any other
transaction involving such securities and earn brokerage or other compensation or act as a market maker in the
financial instruments of the company (ies) discussed herein or act as advisor or lender / borrower to such company
(ies) or have other potential conflict of interest with respect to any recommendation and related information and
opinions.
The analyst for this report certifies that all of the views expressed in this report accurately reflect his or her personal
views about the subject company or companies and its or their securities, and no part of his or her compensation
was, is or will be, directly or indirectly related to specific recommendations or views expressed in this report.
No part of this material may be duplicated in any form and/or redistributed without Keynote Capitals Ltd’s., prior
written consent.
Keynote Capitals Ltd.
th
4 Floor, Balmer Lawrie Bldg., 5, J. N. Heredia Marg, Ballard Estate, Fort, Mumbai, India – 400001. Tel: 3026 6000 / 2269 4322
www.keynotecapitals.com