Call Girls In Sikandarpur Gurgaon ❤️8860477959_Russian 100% Genuine Escorts I...
Keynote technicals daily report for 200112
1. Daily Technical Outlook
20th January 2012
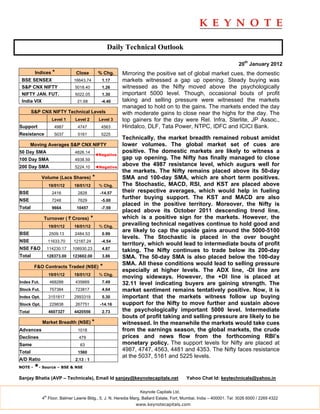
Indices * Close % Chg. Mirroring the positive set of global market cues, the domestic
BSE SENSEX 16643.74 1.17 markets witnessed a gap up opening. Steady buying was
S&P CNX NIFTY 5018.40 1.26 witnessed as the Nifty moved above the psychologically
NIFTY JAN. FUT. 5022.05 1.30 important 5000 level. Though, occasional bouts of profit
India VIX 21.68 -4.40 taking and selling pressure were witnessed the markets
managed to hold on to the gains. The markets ended the day
S&P CNX NIFTY Technical Levels with moderate gains to close near the highs for the day. The
Level 1 Level 2 Level 3 top gainers for the day were Rel. Infra, Sterlite, JP Assoc.,
Support 4987 4747 4563 Hindalco, DLF, Tata Power, NTPC, IDFC and ICICI Bank.
Resistance 5037 5161 5225
Technically, the market breadth remained robust amidst
Moving Averages S&P CNX NIFTY lower volumes. The global market set of cues are
50 Day SMA 4826.14 positive. The domestic markets are likely to witness a
◄Negative
100 Day SMA 4938.59 gap up opening. The Nifty has finally managed to close
200 Day SMA 5224.10 ◄Negative
above the 4987 resistance level, which augurs well for
the markets. The Nifty remains placed above its 50-day
Volume (Lacs Shares) * SMA and 100-day SMA, which are short term positives.
19/01/12 18/01/12 % Chg. The Stochastic, MACD, RSI, and KST are placed above
BSE 2416 2828 -14.57 their respective averages, which would help in fueling
NSE 7248 7629 -5.00
further buying support. The KST and MACD are also
placed in the positive territory. Moreover, the Nifty is
Total 9664 10457 -7.59
placed above its October 2011 descending trend line,
Turnover ( ` Crores) * which is a positive sign for the markets. However, the
19/01/12 18/01/12 % Chg.
prevailing technical negatives continue to hold good and
are likely to cap the upside gains around the 5000-5100
BSE 2509.13 2484.53 0.99
levels. The Stochastic is placed in the over bought
NSE 11633.70 12187.24 -4.54
territory, which would lead to intermediate bouts of profit
NSE F&O 114230.17 108930.23 4.87 taking. The Nifty continues to trade below its 200-day
Total 128373.00 123602.00 3.86 SMA. The 50-day SMA is also placed below the 100-day
SMA. All these conditions would lead to selling pressure
F&O Contracts Traded (NSE) *
especially at higher levels. The ADX line, -DI line are
19/01/12 18/01/12 % Chg.
moving sideways. However, the +DI line is placed at
Index Fut. 468288 435669 7.49 32.11 level indicating buyers are gaining strength. The
Stock Fut. 757384 723817 4.64 market sentiment remains tentatively positive. Now, it is
Index Opt. 3151817 2993319 5.30 important that the markets witness follow up buying
Stock Opt. 229838 267751 -14.16 support for the Nifty to move further and sustain above
Total 4607327 4420556 2.73 the psychologically important 5000 level. Intermediate
bouts of profit taking and selling pressure are likely to be
Market Breadth (NSE) * witnessed. In the meanwhile the markets would take cues
Advances 1018 from the earnings season, the global markets, the crude
Declines 479 prices and news flow from the forthcoming RBI’s
Same 63 monetary policy. The support levels for Nifty are placed at
Total 1560
4987, 4747, 4563, 4481 and 4353. The Nifty faces resistance
at the 5037, 5161 and 5225 levels.
A/D Ratio 2.13 : 1
NOTE - *- Source – BSE & NSE
Sanjay Bhatia (AVP – Technicals), Email Id sanjay@keynotecapitals.net Yahoo Chat Id: keytechnicals@yahoo.in
Keynote Capitals Ltd.
th
4 Floor, Balmer Lawrie Bldg., 5, J. N. Heredia Marg, Ballard Estate, Fort, Mumbai, India – 400001. Tel: 3026 6000 / 2269 4322
www.keynotecapitals.com
2. Short Term Trading Ideas Based On Technical Analysis (5 - 7 Days)
Stop
Initiation Stop Loss Target
Stock Close Action Price Loss * (%) Target (%) Remarks
HDFC Bank 486.80 Buy Above 490.00 477.40 2.57 518 5.71
Hindalco 145.80 Buy Above 147.25 142.40 3.29 158 7.30
Lupin 443.15 Buy Above 435.00 421.50 3.10 465 6.90
* Stop Losses are to be considered strictly on Closing basis.
Intra-day Resistance Intra-day Support
Indices Close Pivot Point R1 R2 R3 S1 S2 S3
BSE SENSEX 16644 16626 16680 16716 16806 16590 16536 16446
S&P CNX NIFTY 5018 5011 5031 5044 5076 4999 4979 4946
NIFTY JAN. FUT. 5022 5013 5036 5050 5086 5000 4977 4941
Keynote Capitals Ltd.
th
4 Floor, Balmer Lawrie Bldg., 5, J. N. Heredia Marg, Ballard Estate, Fort, Mumbai, India – 400001. Tel: 3026 6000 / 2269 4322
www.keynotecapitals.com
3. Disclaimer
This document is not for public distribution and has been furnished to you solely for your information and must not be
reproduced or redistributed to any other person. Persons into whose possession this document may come are
required to observe these restrictions.
This material is for the personal information of the authorized recipient, and we are not soliciting any action based
upon it. This report is not to be construed as an offer to sell or the solicitation of an offer to buy any security in any
jurisdiction where such an offer or solicitation would be illegal. It is for the general information of clients of Keynote
Capitals Ltd. It does not constitute a personal recommendation or take into account the particular investment
objectives, financial situations, or needs of individual clients.
We have reviewed the report, and in so far as it includes current or historical information, it is believed to be reliable
though its accuracy or completeness cannot be guaranteed. Neither Keynote Capitals Ltd., nor any person connected
with it, accepts any liability arising from the use of this document. The recipients of this material should rely on their
own investigations and take their own professional advice. Price and value of the investments referred to in this
material may go up or down. Past performance is not a guide for future performance. Certain transactions -including
those involving futures, options and other derivatives as well as non-investment grade securities - involve substantial
risk and are not suitable for all investors. Reports based on technical analysis centers on studying charts of a stock’s
price movement and trading volume, as opposed to focusing on a company’s fundamentals and as such, may not
match with a report on a company’s fundamentals.
Opinions expressed are our current opinions as of the date appearing on this material only. While we endeavor to
update on a reasonable basis the information discussed in this material, there may be regulatory, compliance, or
other reasons that prevent us from doing so. Prospective investors and others are cautioned that any forward-looking
statements are not predictions and may be subject to change without notice. Our proprietary trading and investment
businesses may make investment decisions that are inconsistent with the recommendations expressed herein.
We and our affiliates, officers, directors, and employees world wide may: (a) from time to time, have long or short
positions in, and buy or sell the securities thereof, of company (ies) mentioned herein or (b) be engaged in any other
transaction involving such securities and earn brokerage or other compensation or act as a market maker in the
financial instruments of the company (ies) discussed herein or act as advisor or lender / borrower to such company
(ies) or have other potential conflict of interest with respect to any recommendation and related information and
opinions.
The analyst for this report certifies that all of the views expressed in this report accurately reflect his or her personal
views about the subject company or companies and its or their securities, and no part of his or her compensation
was, is or will be, directly or indirectly related to specific recommendations or views expressed in this report.
No part of this material may be duplicated in any form and/or redistributed without Keynote Capitals Ltd’s., prior
written consent.
Keynote Capitals Ltd.
th
4 Floor, Balmer Lawrie Bldg., 5, J. N. Heredia Marg, Ballard Estate, Fort, Mumbai, India – 400001. Tel: 3026 6000 / 2269 4322
www.keynotecapitals.com