Global Scenario On Sustainable and Resilient Coconut Industry by Dr. Jelfina...
Keynote technicals daily report for 160312
1. Daily Technical Outlook
16th March 2012
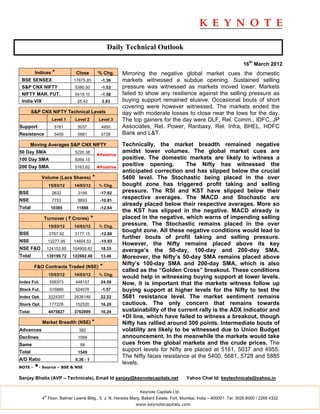
Indices * Close % Chg. Mirroring the negative global market cues the domestic
BSE SENSEX 17675.85 -1.36 markets witnessed a subdue opening. Sustained selling
S&P CNX NIFTY 5380.50 -1.53 pressure was witnessed as markets moved lower. Markets
NIFTY MAR. FUT. 5419.10 -1.58 failed to show any resilience against the selling pressure as
India VIX 25.42 2.83 buying support remained elusive. Occasional bouts of short
covering were however witnessed. The markets ended the
S&P CNX NIFTY Technical Levels day with moderate losses to close near the lows for the day.
Level 1 Level 2 Level 3 The top gainers for the day were DLF, Rel. Comm., IDFC, JP
Support 5161 5037 4955 Associates, Rel. Power, Ranbaxy, Rel. Infra, BHEL, HDFC
Resistance 5400 5681 5728 Bank and L&T.
Moving Averages S&P CNX NIFTY Technically, the market breadth remained negative
50 Day SMA 5220.38 amidst lower volumes. The global market cues are
◄Positive
100 Day SMA 5069.15 positive. The domestic markets are likely to witness a
200 Day SMA 5163.62 ◄Positive
positive opening. The Nifty has witnessed the
anticipated correction and has slipped below the crucial
Volume (Lacs Shares) * 5400 level. The Stochastic being placed in the over
15/03/12 14/03/12 % Chg. bought zone has triggered profit taking and selling
BSE 2632 3195 -17.62 pressure. The RSI and KST have slipped below their
NSE 7753 8693 -10.81
respective averages. The MACD and Stochastic are
already placed below their respective averages. More so
Total 10385 11888 -12.64
the KST has slipped in the negative. MACD already is
Turnover ( ` Crores) * placed in the negative, which warns of impending selling
15/03/12 14/03/12 % Chg.
pressure. The Stochastic remains placed in the over
bought zone. All these negative conditions would lead to
BSE 2767.92 3177.15 -12.88
further bouts of profit taking and selling pressure.
NSE 12277.95 14604.52 -15.93
However, the Nifty remains placed above its key
NSE F&O 124153.85 104900.82 18.35 average’s the 50-day, 100-day and 200-day SMA.
Total 139199.72 122682.49 13.46 Moreover, the Nifty’s 50-day SMA remains placed above
Nifty’s 100-day SMA and 200-day SMA, which is also
F&O Contracts Traded (NSE) *
called as the “Golden Cross” breakout. These conditions
15/03/12 14/03/12 % Chg.
would help in witnessing buying support at lower levels.
Index Fut. 558373 448157 24.59 Now, it is important that the markets witness follow up
Stock Fut. 515869 524076 -1.57 buying support at higher levels for the Nifty to test the
Index Opt. 3224357 2638146 22.22 5681 resistance level. The market sentiment remains
Stock Opt. 177228 152520 16.20 cautious. The only concern that remains towards
Total 4475827 3762899 16.24 sustainability of the current rally is the ADX indicator and
+DI line, which have failed to witness a breakout, though
Market Breadth (NSE) * Nifty has rallied around 300 points. Intermediate bouts of
Advances 392 volatility are likely to be witnessed due to Union Budget
Declines 1099 announcement. In the meanwhile the markets would take
Same 58 cues from the global markets and the crude prices. The
Total 1549
support levels for Nifty are placed at 5161, 5037 and 4955.
The Nifty faces resistance at the 5400, 5681, 5728 and 5885
A/D Ratio 0.36 : 1
levels.
NOTE - *- Source – BSE & NSE
Sanjay Bhatia (AVP – Technicals), Email Id sanjay@keynotecapitals.net Yahoo Chat Id: keytechnicals@yahoo.in
Keynote Capitals Ltd.
th
4 Floor, Balmer Lawrie Bldg., 5, J. N. Heredia Marg, Ballard Estate, Fort, Mumbai, India – 400001. Tel: 3026 6000 / 2269 4322
www.keynotecapitals.com
2. Short Term Trading Ideas Based On Technical Analysis (5 - 7 Days)
Stop
Initiation Stop Loss Target
Stock Close Action Price Loss * (%) Target (%) Remarks
Allahabad Bank 193.80 Sell Below 193.00 197.50 2.33 183.00 5.18
Bharti Airtel 331.65 Sell Below 330.00 336.30 1.91 316.00 4.24
HDIL 104.70 Sell Below 103.50 107.00 3.38 96.00 7.25
* Stop Losses are to be considered strictly on Closing basis.
Intra-day Resistance Intra-day Support
Indices Close Pivot Point R1 R2 R3 S1 S2 S3
BSE SENSEX 17676 17739 17855 18035 18331 17559 17443 17147
S&P CNX NIFTY 5381 5402 5441 5502 5602 5341 5302 5201
NIFTY MAR. FUT. 5419 5442 5486 5553 5664 5375 5331 5220
Keynote Capitals Ltd.
th
4 Floor, Balmer Lawrie Bldg., 5, J. N. Heredia Marg, Ballard Estate, Fort, Mumbai, India – 400001. Tel: 3026 6000 / 2269 4322
www.keynotecapitals.com
3. Disclaimer
This document is not for public distribution and has been furnished to you solely for your information and must not be
reproduced or redistributed to any other person. Persons into whose possession this document may come are
required to observe these restrictions.
This material is for the personal information of the authorized recipient, and we are not soliciting any action based
upon it. This report is not to be construed as an offer to sell or the solicitation of an offer to buy any security in any
jurisdiction where such an offer or solicitation would be illegal. It is for the general information of clients of Keynote
Capitals Ltd. It does not constitute a personal recommendation or take into account the particular investment
objectives, financial situations, or needs of individual clients.
We have reviewed the report, and in so far as it includes current or historical information, it is believed to be reliable
though its accuracy or completeness cannot be guaranteed. Neither Keynote Capitals Ltd., nor any person connected
with it, accepts any liability arising from the use of this document. The recipients of this material should rely on their
own investigations and take their own professional advice. Price and value of the investments referred to in this
material may go up or down. Past performance is not a guide for future performance. Certain transactions -including
those involving futures, options and other derivatives as well as non-investment grade securities - involve substantial
risk and are not suitable for all investors. Reports based on technical analysis centers on studying charts of a stock’s
price movement and trading volume, as opposed to focusing on a company’s fundamentals and as such, may not
match with a report on a company’s fundamentals.
Opinions expressed are our current opinions as of the date appearing on this material only. While we endeavor to
update on a reasonable basis the information discussed in this material, there may be regulatory, compliance, or
other reasons that prevent us from doing so. Prospective investors and others are cautioned that any forward-looking
statements are not predictions and may be subject to change without notice. Our proprietary trading and investment
businesses may make investment decisions that are inconsistent with the recommendations expressed herein.
We and our affiliates, officers, directors, and employees world wide may: (a) from time to time, have long or short
positions in, and buy or sell the securities thereof, of company (ies) mentioned herein or (b) be engaged in any other
transaction involving such securities and earn brokerage or other compensation or act as a market maker in the
financial instruments of the company (ies) discussed herein or act as advisor or lender / borrower to such company
(ies) or have other potential conflict of interest with respect to any recommendation and related information and
opinions.
The analyst for this report certifies that all of the views expressed in this report accurately reflect his or her personal
views about the subject company or companies and its or their securities, and no part of his or her compensation
was, is or will be, directly or indirectly related to specific recommendations or views expressed in this report.
No part of this material may be duplicated in any form and/or redistributed without Keynote Capitals Ltd’s., prior
written consent.
Keynote Capitals Ltd.
th
4 Floor, Balmer Lawrie Bldg., 5, J. N. Heredia Marg, Ballard Estate, Fort, Mumbai, India – 400001. Tel: 3026 6000 / 2269 4322
www.keynotecapitals.com