1. Daily Technical Outlook
12th December 2012
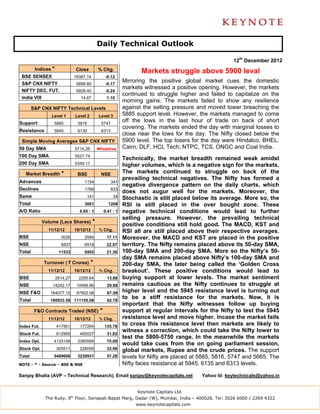
Indices * Close % Chg. Markets struggle above 5900 leval
BSE SENSEX 19387.14 -0.12
S&P CNX NIFTY 5898.80 -0.17
Mirroring the positive global market cues the domestic
markets witnessed a positive opening. However, the markets
NIFTY DEC. FUT. 5928.40 -0.24
continued to struggle higher and failed to capitalize on the
India VIX 14.67 1.10
morning gains. The markets failed to show any resilience
S&P CNX NIFTY Technical Levels against the selling pressure and moved lower breaching the
Level 1 Level 2 Level 3 5885 support level. However, the markets managed to come
Support 5885 5816 5747
off the lows in the last hour of trade on back of short
covering. The markets ended the day with marginal losses to
Resistance 5945 6135 6313
close near the lows for the day. The Nifty closed below the
Simple Moving Averages S&P CNX NIFTY 5900 level. The top losers for the day were Hindalco, BHEL,
50 Day SMA 5714.26 ◄Positive Cairn, DLF, HCL Tech; NTPC, TCS, ONGC and Coal India.
100 Day SMA 5527.74
Technically, the market breadth remained weak amidst
200 Day SMA 5349.11 higher volumes, which is a negative sign for the markets.
Market Breadth * BSE NSE
The markets continued to struggle on back of the
prevailing technical negatives. The Nifty has formed a
Advances 1154 341
negative divergence pattern on the daily charts, which
Declines 1766 833
does not augur well for the markets. Moreover, the
Same 141 34 Stochastic is still placed below its average. More so, the
Total 3061 1208 RSI is still placed in the over bought zone. These
A/D Ratio 0.65 : 1 0.41 : 1 negative technical conditions would lead to further
selling pressure. However, the prevailing technical
Volume (Lacs Shares) * positive conditions still hold good. The MACD, KST and
11/12/12 10/12/12 % Chg. RSI all are still placed above their respective averages.
BSE 3026 2584 17.11 Moreover, the MACD and KST are placed in the positive
NSE 8507 6918 22.97 territory. The Nifty remains placed above its 50-day SMA,
Total 11533 9502 21.38 100-day SMA and 200-day SMA. More so the Nifty’s 50-
day SMA remains placed above Nifty’s 100-day SMA and
Turnover ( ` Crores) * 200-day SMA, the later being called the ‘Golden Cross
11/12/12 10/12/12 % Chg. breakout’. These positive conditions would lead to
BSE 2614.27 2295.64 13.88 buying support at lower levels. The market sentiment
NSE 14242.17 10956.86 29.98 remains cautious as the Nifty continues to struggle at
NSE F&O 164077.15 97902.58 67.59 higher level and the 5945 resistance level is turning out
Total 180933.59 111155.08 62.78
to be a stiff resistance for the markets. Now, it is
important that the Nifty witnesses follow up buying
F&O Contracts Traded (NSE) * support at regular intervals for the Nifty to test the 5945
11/12/12 10/12/12 % Chg. resistance level and move higher. Incase the market fails
Index Fut. 417951 177264 135.78
to cross this resistance level then markets are likely to
witness a correction, which could take the Nifty lower to
Stock Fut. 612995 465027 31.82
test the 5800-5750 range. In the meanwhile the markets
Index Opt. 4133149 2360584 75.09
would take cues from the on going parliament session,
Stock Opt. 305511 228056 33.96 global markets, Rupee and the crude prices. The support
Total 5469606 3230931 57.26 levels for Nifty are placed at 5885, 5816, 5747 and 5665. The
NOTE - * - Source – BSE & NSE Nifty faces resistance at 5945, 6135 and 6313 levels.
Sanjay Bhatia (AVP – Technical Research), Email sanjay@keynotecapitals.net Yahoo Id: keytechnicals@yahoo.in
Keynote Capitals Ltd.
The Ruby, 9th Floor, Senapati Bapat Marg, Dadar (W), Mumbai, India – 400028. Tel: 3026 6000 / 2269 4322
www.keynotecapitals.com
2. Jaldi 5 (Short Term Technical Ideas for 5 Trading Days)
Stop
Initiation Stop Loss Target
Stock Close Action Price Loss * (%) Target (%) Remarks
Cairn Fut 321.00 Sell Below 320.50 325.25 1.48 310.00 3.28
TGT of 166
Achieved given
Buy @ 160 on
Allahabad Bank 161.75 Buy Above 163.00 160.75 1.38 168.00 3.07 10/12/12
Bajaj Auto 2005.00 Buy Above 2010.00 1980.00 1.49 2075.00 3.23
* Stop Losses are to be considered strictly on closing basis.
Intra-day Resistance Intra-day Support
Indices Close Pivot Point R1 R2 R3 S1 S2 S3
BSE SENSEX 19387 19428 19571 19755 20082 19244 19101 18774
S&P CNX NIFTY 5899 5910 5954 6010 6109 5854 5810 5710
NIFTY DEC. FUT. 5928 5943 5988 6048 6154 5883 5838 5732
Keynote Capitals Ltd.
The Ruby, 9th Floor, Senapati Bapat Marg, Dadar (W), Mumbai, India – 400028. Tel: 3026 6000 / 2269 4322
www.keynotecapitals.com
3. Stocks To Watch Out Today
Adani Enterprises, Adani Power, Allahabad Bank, Ambuja Cement, Bajaj Auto, HDFC, Hero Motocorp, HUL, ITC, Jet Airways,
Piramal Healthcare, Powergrid, Punj Lloyd, Sun Pharma, TTK Prestige, United Spirits, Ultratech Cemco
Apollo Tyre, Ashok Leyland, Bajaj Hind; Balrampur Chini, Bata, BGR Energy, Bharat Forge, Bharti Airtel, Bhel, Bombay Dying
Cairn India, Coal India, Delta Corp, FT, GMDC< Godrej Inds; GSPL, GVK, HCC, HDFC Bank, HDIL, Hexaware, Hindalco,
HOECL, HPCL, Hotel Leela, IDBI, Idea, IFCI, Indian Hotels, IVRCL Jindal Saw, Jain Irrigation, JSW Steel, NHPC, NTPC, Oil
India, ONGC, PFC, Ranbaxy, REC, Reliance, Renuka Sugar, RPower, SCI, Siemens, SIB, Sun TV, Suzlon, Syndicate Bank,
Tata Chemicals, Tata Comm; Tata Global, Tata Motors, Tata Power, Tata Steel, TCS, Titan, TVS Motors, UCO Bank, Vijaya
Bank, VIP, Voltas, Wipro, ZEEL
NOTE:
TECHNICAL ANALYSIS ABBREVATIONS
SMA – Simple Moving Average
EMA – Exponential Moving Average
WMA – Weighted Moving Average
Disclaimer
This document is not for public distribution and has been furnished to you solely for your information and must not be
reproduced or redistributed to any other person. Persons into whose possession this document may come are
required to observe these restrictions.
This material is for the personal information of the authorized recipient, and we are not soliciting any action based
upon it. This report is not to be construed as an offer to sell or the solicitation of an offer to buy any security in any
jurisdiction where such an offer or solicitation would be illegal. It is for the general information of clients of Keynote
Capitals Ltd. It does not constitute a personal recommendation or take into account the particular investment
objectives, financial situations, or needs of individual clients.
We have reviewed the report, and in so far as it includes current or historical information, it is believed to be reliable
though its accuracy or completeness cannot be guaranteed. Neither Keynote Capitals Ltd., nor any person connected
with it, accepts any liability arising from the use of this document. The recipients of this material should rely on their
own investigations and take their own professional advice. Price and value of the investments referred to in this
material may go up or down. Past performance is not a guide for future performance. Certain transactions -including
those involving futures, options and other derivatives as well as non-investment grade securities - involve substantial
risk and are not suitable for all investors. Reports based on technical analysis centers on studying charts of a stock’s
price movement and trading volume, as opposed to focusing on a company’s fundamentals and as such, may not
match with a report on a company’s fundamentals.
Opinions expressed are our current opinions as of the date appearing on this material only. While we endeavor to
update on a reasonable basis the information discussed in this material, there may be regulatory, compliance, or
other reasons that prevent us from doing so. Prospective investors and others are cautioned that any forward-looking
statements are not predictions and may be subject to change without notice. Our proprietary trading and investment
businesses may make investment decisions that are inconsistent with the recommendations expressed herein.
We and our affiliates, officers, directors, and employees world wide may: (a) from time to time, have long or short
positions in, and buy or sell the securities thereof, of company (ies) mentioned herein or (b) be engaged in any other
transaction involving such securities and earn brokerage or other compensation or act as a market maker in the
financial instruments of the company (ies) discussed herein or act as advisor or lender / borrower to such company
(ies) or have other potential conflict of interest with respect to any recommendation and related information and
opinions.
The analyst for this report certifies that all of the views expressed in this report accurately reflect his or her personal
views about the subject company or companies and its or their securities, and no part of his or her compensation
was, is or will be, directly or indirectly related to specific recommendations or views expressed in this report.
No part of this material may be duplicated in any form and/or redistributed without Keynote Capitals Ltd’s., prior
written consent.
Keynote Capitals Ltd.
The Ruby, 9th Floor, Senapati Bapat Marg, Dadar (W), Mumbai, India – 400028. Tel: 3026 6000 / 2269 4322
www.keynotecapitals.com