samsung electronics 005930 Algorithm Investment Report
•
0 likes•9 views

samsung electronics 005930 Algorithm Investment Report
![[Price for scheduled purchasing]
Arbitrarily made
Algorithm stocks Trading Strategies (consolidated) 005930 Date
Period
Gap
(Indication /
stock)
Color
low price 50,746 W 50,746 W ~ 0 W -27 % 524,124 W 10
Low mid 62,530 W 62,530 W ~ 50,746 W -10 % 198,258 W 3
Mid 74,315 W 74,315 W ~ 62,530 W 7 % -127,608 W -2
High mid 86,099 W 86,099 W ~ 74,315 W 24 % -453,474 W -5
Suggested Purchase
Amount 1,927,367 W
Number of stocks
purchased 28
Indication price Range Buying / Selling Buying / Selling [Stocks]
High price 97,884 W 97,884 W~ ~ 86,099 W 40 % -779,340 W -8
2023-11-10
3 months
Current stock price Evaluation
Stock price rise
probability score
Investment opinion Prospective purchase amount
69,700 W Mid 44.2 Normal 4,500,000 W
42.7 44.2 34.4 20.4 45.5 37.8
2023.06.14 2023.07.12 2023.08.09 2023.09.07 2023.10.12 2023.11.09
Stock price rise
probability score
A Sector 46.2 50.5 42.5 51.1 47.6 47.3
44.2
B Sector 39.2 37.9 26.3 51.1 43.3 28.3
Total average
2023.08.09 2023.09.07 2023.10.12 2023.11.09
Total of
increase rate
Total score
A Sector 9 % -19 % 17 % -7 % -1 %
-12 % 40.0
B Sector -3 % -44 % 49 % -18 % -53 %
Total average 3 % -29 % -68 % 55 % -20 %
2023.07.12
46
51
42
51
48 47
39 38
26
51
43
28
43 44
34
20
45
38
0
10
20
30
40
50
60
2023.06.14 2023.07.12 2023.08.09 2023.09.07 2023.10.12 2023.11.09
Stock price rise probability score
A sector
B sector
Total average
9%
-19%
17%
-7%
-1%
-3%
-44%
49%
-18%
-53%
3%
-29%
-68%
55%
-20%
-80%
-60%
-40%
-20%
0%
20%
40%
60%
80%
2023.07.12 2023.08.09 2023.09.07 2023.10.12 2023.11.09
Increase rate of stock price rise
A sector
B sector
Total average
samsung electronics](data:image/gif;base64,R0lGODlhAQABAIAAAAAAAP///yH5BAEAAAAALAAAAAABAAEAAAIBRAA7)
Recommended
Recommended
More Related Content
Similar to samsung electronics 005930 Algorithm Investment Report
Similar to samsung electronics 005930 Algorithm Investment Report (20)
More from 알고리즘 기업분석 컨설팅-알기컨,algikeon
More from 알고리즘 기업분석 컨설팅-알기컨,algikeon (20)
Recently uploaded
Recently uploaded (20)
samsung electronics 005930 Algorithm Investment Report
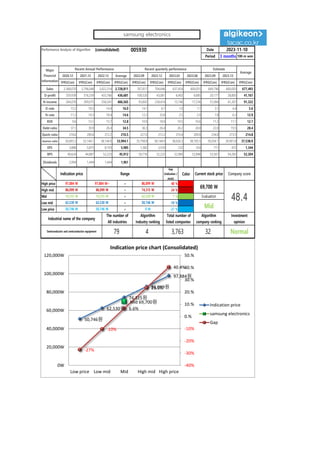
- 1. Performance Analysis of Algorithm (consolidated) 005930 Date Period 3 months 100-m won 2020.12 2021.12 2022.12 Average 2022.09 2022.12 2023.03 2023.06 2023.09 2023.12 IFRS(Con) IFRS(Con) IFRS(Con) IFRS(Con) IFRS(Con) IFRS(Con) IFRS(Con) IFRS(Con) IFRS(Con) IFRS(Con) IFRS(Con) Sales 2,368,070 2,796,048 3,022,314 2,728,811 767,817 704,646 637,454 600,055 649,796 660,003 677,493 O-profit 359,939 516,339 433,766 436,681 108,520 43,061 6,402 6,685 20,177 28,805 41,167 N-income 264,078 399,075 556,541 406,565 93,892 238,414 15,746 17,236 51,004 41,267 91,322 O-rate 15.2 18.5 14.4 16.0 14.1 6.1 1.0 1.1 3.1 4.4 5.6 N-rate 11.2 14.3 18.4 14.6 12.2 33.8 2.5 2.9 7.8 6.3 12.9 ROE 9.6 13.1 15.7 12.8 10.9 18.9 10.5 10.6 11.3 11.1 12.7 Debt-ratio 37.1 39.9 26.4 34.5 36.3 26.4 26.2 24.8 22.0 19.5 28.4 Quick-ratio 218.6 200.6 212.2 210.5 227.0 212.2 210.4 209.8 234.8 273.5 214.8 reserve-ratio 30,693.3 33,144.1 38,144.9 33,994.1 35,798.8 38,144.9 38,026.3 38,185.5 39,034.1 39,901.8 37,538.9 EPS 3,888 5,875 8,193 5,985 1,382 3,510 232 254 711 472 1,344 BPS 40,624 44,887 52,225 45,912 50,776 52,225 52,969 52,848 53,561 54,283 52,204 Dividends 2,994 1,444 1,444 1,961 Major Financial Information Recent Annual Performance Recent quarterly performance Estimate Average 2023-11-10 Gap (Indication / stock) Color High price ~ 40 % High mid ~ 24 % Mid ~ 7 % Low mid ~ -10 % Low price ~ -27 % Normal 50,746 W 50,746 W 0 W Industrial name of the company The number of All industries Algorithm Industry ranking Total number of listed companies Algorithm company ranking Investment opinion Semiconductor and semiconductor equipment 79 4 3,763 32 86,099 W 86,099 W 74,315 W 74,315 W 74,315 W 62,530 W Evaluation 97,884 W 97,884 W~ 86,099 W 69,700 W 48.4 62,530 W 62,530 W 50,746 W Mid Indication price Range Current stock price Company score 50,746원 62,530원 74,315원 86,099원 97,884원 Mid 69,700원 -27% -10% 6.6% 23.5% 40.4% -40% -30% -20% -10% 0.% 10.% 20.% 30.% 40.% 50.% 0W 20,000W 40,000W 60,000W 80,000W 100,000W 120,000W Low price Low mid Mid High mid High price Indication price chart (Consolidated) Indication price samsung electronics Gap samsung electronics
- 2. [Price for scheduled purchasing] Arbitrarily made Algorithm stocks Trading Strategies (consolidated) 005930 Date Period Gap (Indication / stock) Color low price 50,746 W 50,746 W ~ 0 W -27 % 524,124 W 10 Low mid 62,530 W 62,530 W ~ 50,746 W -10 % 198,258 W 3 Mid 74,315 W 74,315 W ~ 62,530 W 7 % -127,608 W -2 High mid 86,099 W 86,099 W ~ 74,315 W 24 % -453,474 W -5 Suggested Purchase Amount 1,927,367 W Number of stocks purchased 28 Indication price Range Buying / Selling Buying / Selling [Stocks] High price 97,884 W 97,884 W~ ~ 86,099 W 40 % -779,340 W -8 2023-11-10 3 months Current stock price Evaluation Stock price rise probability score Investment opinion Prospective purchase amount 69,700 W Mid 44.2 Normal 4,500,000 W 42.7 44.2 34.4 20.4 45.5 37.8 2023.06.14 2023.07.12 2023.08.09 2023.09.07 2023.10.12 2023.11.09 Stock price rise probability score A Sector 46.2 50.5 42.5 51.1 47.6 47.3 44.2 B Sector 39.2 37.9 26.3 51.1 43.3 28.3 Total average 2023.08.09 2023.09.07 2023.10.12 2023.11.09 Total of increase rate Total score A Sector 9 % -19 % 17 % -7 % -1 % -12 % 40.0 B Sector -3 % -44 % 49 % -18 % -53 % Total average 3 % -29 % -68 % 55 % -20 % 2023.07.12 46 51 42 51 48 47 39 38 26 51 43 28 43 44 34 20 45 38 0 10 20 30 40 50 60 2023.06.14 2023.07.12 2023.08.09 2023.09.07 2023.10.12 2023.11.09 Stock price rise probability score A sector B sector Total average 9% -19% 17% -7% -1% -3% -44% 49% -18% -53% 3% -29% -68% 55% -20% -80% -60% -40% -20% 0% 20% 40% 60% 80% 2023.07.12 2023.08.09 2023.09.07 2023.10.12 2023.11.09 Increase rate of stock price rise A sector B sector Total average samsung electronics
- 3. 정보와 완전 정보 결 투자판단 있습니 위배 무단으 숙지하 Compliance notice ① The information provided by The Algorithm Company Analysis Consulting is obtained through reliable data and information and The Algorithm Company Analysis Program (TACAP), but its accuracy or completeness are not guaranteed. Furthermore, it may change over time.Therefore, we are not legally responsible for the results of the data provided by The Algorithm Company Analysis Consulting because of information errors or omissions. ② The Algorithm Company Analysis Consulting and all the information provided on it site are reference materials for investment decisions and the final responsibility of investment is up to users utilizing this information. ③ The Algorithm Company Analysis Consulting and its site do not do anything that violates the related laws such as discretionary transaction. ④ Users can not reallocate and recycle the information provided by The Algorithm Company Analysis Consulting firm let alone the information provided by its Site. ⑤ Be sure to know about application period of this algorithm analysis report in order to improve its accuracy. Tel : 070 - 4667 - 5009 Email : tacac@tacac.co.kr Homepage : tacac.co.kr blog.naver.com/tacac SERVICES M&A, IPO, RECOVER, CORPORATE RESTRUCTURING, MANAGEMENT OF TECHNOLOGY, BUSINESS STRATEGY, FAMILY BUSINESS Request : http://tacac.co.kr/?page_id=1374 ① Consulting is o The Algorithm accuracy or com change over tim results of the d Consulting bec ② information pr investment dec up ③ do anything th transaction. ④ The Algorithm information pr ⑤ analysis report