samsung engineering 028050 Algorithm Investment Report
•
1 like•195 views

This document contains performance data for a company over several periods from 2018-2021, including sales, operating profit, net income, operating rate, net rate, return on equity, debt ratio, quick ratio, and reserve ratio. It also includes stock price and indication price data from 2021-2023. The document analyzes the company's stock using an algorithm model and provides a suggested purchase amount and number of stocks based on the analysis. It concludes with compliance notices regarding the use of the information and analysis.
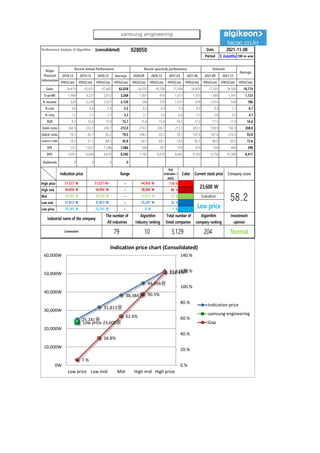
![[Price for scheduled purchasing]
Arbitrarily made
Algorithm stocks Trading Strategies (consolidated) 028050 Date
Period
Gap
(Indication /
stock)
Color
low price 25,241 W 25,241 W ~ 0 W 7 % -338,638 W -13
Low mid 31,813 W 31,813 W ~ 25,241 W 35 % -1,694,602 W -53
Mid 38,384 W 38,384 W ~ 31,813 W 63 % -3,050,566 W -79
High mid 44,956 W 44,956 W ~ 38,384 W 90 % -4,406,530 W -98
Suggested Purchase
Amount 4,869,627 W
Number of stocks
purchased 206
Indication price Range Buying / Selling Buying / Selling [Stocks]
High price 51,527 W 51,527 W~ ~ 44,956 W 118 % -5,762,494 W All selling
2021-11-08
3 months
Current stock price Evaluation
Stock price rise
probability score
Investment opinion Prospective purchase amount
23,600 W Low price 46.5 Normal 10,000,000 W
45.9 36.9 41.9 22.1 44.7 36.2
2021.06.10 2021.07.08 2021.08.05 2021.09.03 2021.10.07 2021.11.05
Stock price rise
probability score
A Sector 50.2 45.1 47.1 46.3 46.4 44.9
46.5
B Sector 41.7 28.8 36.7 46.3 42.9 27.5
Total average
2021.08.05 2021.09.03 2021.10.07 2021.11.05
Total of
increase rate
Total score
A Sector -11 % 4 % -2 % 0 % -3 %
-15 % 41.7
B Sector -45 % 22 % 21 % -8 % -56 %
Total average -24 % 12 % -90 % 51 % -23 %
2021.07.08
50
45 47 46 46 45
42
29
37
46
43
28
46
37
42
22
45
36
0
10
20
30
40
50
60
2021.06.10 2021.07.08 2021.08.05 2021.09.03 2021.10.07 2021.11.05
Stock price rise probability score
A sector
B sector
Total average
-11%
4% -2% 0% -3%
-45%
22% 21%
-8%
-56%
-24%
12%
-90%
51%
-23%
-100%
-80%
-60%
-40%
-20%
0%
20%
40%
60%
2021.07.08 2021.08.05 2021.09.03 2021.10.07 2021.11.05
Increase rate of stock price rise
A sector
B sector
Total average
samsung engineering](data:image/gif;base64,R0lGODlhAQABAIAAAAAAAP///yH5BAEAAAAALAAAAAABAAEAAAIBRAA7)
Recommended
Recommended
More Related Content
What's hot
What's hot (20)
Similar to samsung engineering 028050 Algorithm Investment Report
Similar to samsung engineering 028050 Algorithm Investment Report (20)
More from 알고리즘 기업분석 컨설팅-알기컨,algikeon
More from 알고리즘 기업분석 컨설팅-알기컨,algikeon (20)
Recently uploaded
Recently uploaded (20)
samsung engineering 028050 Algorithm Investment Report
- 1. Performance Analysis of Algorithm (consolidated) 028050 Date Period 3 months 100-m won 2018.12 2019.12 2020.12 Average 2020.09 2020.12 2021.03 2021.06 2021.09 2021.12 IFRS(Con) IFRS(Con) IFRS(Con) IFRS(Con) IFRS(Con) IFRS(Con) IFRS(Con) IFRS(Con) IFRS(Con) IFRS(Con) IFRS(Con) Sales 54,670 63,921 67,492 62,028 16,032 18,798 15,308 16,958 17,505 18,580 16,774 O-profit 1,964 4,227 3,612 3,268 1,001 916 1,073 1,503 1,464 1,341 1,123 N-income 629 3,238 2,521 2,129 596 570 1,015 938 1,014 930 780 O-rate 3.6 6.6 5.4 5.2 6.2 4.9 7.0 8.9 8.4 7.2 6.7 N-rate 1.2 5.1 3.7 3.3 3.7 3.0 6.6 5.5 5.8 5.0 4.7 ROE 6.3 25.0 15.9 15.7 15.6 15.0 18.2 17.4 17.5 17.0 16.6 Debt-ratio 362.9 252.5 200.7 272.0 214.2 200.7 215.5 205.1 198.9 192.9 208.9 Quick-ratio 70.1 85.1 83.2 79.5 106.1 83.2 78.1 107.6 147.6 210.5 93.8 reserve-ratio 18.2 51.1 68.1 45.8 64.7 68.1 74.0 83.5 90.9 99.0 72.6 EPS 321 1,652 1,286 1,086 304 291 518 479 559 464 398 BPS 5,091 6,608 8,070 6,590 7,782 8,070 8,665 9,150 9,750 10,389 8,417 Dividends 0 0 0 0 Major Financial Information Recent Annual Performance Recent quarterly performance Estimate Average 2021-11-08 Gap (Indication / stock) Color High price ~ 118 % High mid ~ 90 % Mid ~ 63 % Low mid ~ 35 % Low price ~ 7 % Normal 25,241 W 25,241 W 0 W Industrial name of the company The number of All industries Algorithm Industry ranking Total number of listed companies Algorithm company ranking Investment opinion Construction 79 10 3,129 204 44,956 W 44,956 W 38,384 W 38,384 W 38,384 W 31,813 W Evaluation 51,527 W 51,527 W~ 44,956 W 23,600 W 58.2 31,813 W 31,813 W 25,241 W Low price Indication price Range Current stock price Company score 25,241원 31,813원 38,384원 44,956원 51,527원 Low price 23,600원 7.% 34.8% 62.6% 90.5% 118.3% 0.% 20.% 40.% 60.% 80.% 100.% 120.% 140.% 0W 10,000W 20,000W 30,000W 40,000W 50,000W 60,000W Low price Low mid Mid High mid High price Indication price chart (Consolidated) Indication price samsung engineering Gap samsung engineering
- 2. [Price for scheduled purchasing] Arbitrarily made Algorithm stocks Trading Strategies (consolidated) 028050 Date Period Gap (Indication / stock) Color low price 25,241 W 25,241 W ~ 0 W 7 % -338,638 W -13 Low mid 31,813 W 31,813 W ~ 25,241 W 35 % -1,694,602 W -53 Mid 38,384 W 38,384 W ~ 31,813 W 63 % -3,050,566 W -79 High mid 44,956 W 44,956 W ~ 38,384 W 90 % -4,406,530 W -98 Suggested Purchase Amount 4,869,627 W Number of stocks purchased 206 Indication price Range Buying / Selling Buying / Selling [Stocks] High price 51,527 W 51,527 W~ ~ 44,956 W 118 % -5,762,494 W All selling 2021-11-08 3 months Current stock price Evaluation Stock price rise probability score Investment opinion Prospective purchase amount 23,600 W Low price 46.5 Normal 10,000,000 W 45.9 36.9 41.9 22.1 44.7 36.2 2021.06.10 2021.07.08 2021.08.05 2021.09.03 2021.10.07 2021.11.05 Stock price rise probability score A Sector 50.2 45.1 47.1 46.3 46.4 44.9 46.5 B Sector 41.7 28.8 36.7 46.3 42.9 27.5 Total average 2021.08.05 2021.09.03 2021.10.07 2021.11.05 Total of increase rate Total score A Sector -11 % 4 % -2 % 0 % -3 % -15 % 41.7 B Sector -45 % 22 % 21 % -8 % -56 % Total average -24 % 12 % -90 % 51 % -23 % 2021.07.08 50 45 47 46 46 45 42 29 37 46 43 28 46 37 42 22 45 36 0 10 20 30 40 50 60 2021.06.10 2021.07.08 2021.08.05 2021.09.03 2021.10.07 2021.11.05 Stock price rise probability score A sector B sector Total average -11% 4% -2% 0% -3% -45% 22% 21% -8% -56% -24% 12% -90% 51% -23% -100% -80% -60% -40% -20% 0% 20% 40% 60% 2021.07.08 2021.08.05 2021.09.03 2021.10.07 2021.11.05 Increase rate of stock price rise A sector B sector Total average samsung engineering
- 3. 정보와 완전 정보 결 투자판단 있습니 위배 무단으 숙지하 Compliance notice ① The information provided by The Algorithm Company Analysis Consulting is obtained through reliable data and information and The Algorithm Company Analysis Program (TACAP), but its accuracy or completeness are not guaranteed. Furthermore, it may change over time.Therefore, we are not legally responsible for the results of the data provided by The Algorithm Company Analysis Consulting because of information errors or omissions. ② The Algorithm Company Analysis Consulting and all the information provided on it site are reference materials for investment decisions and the final responsibility of investment is up to users utilizing this information. ③ The Algorithm Company Analysis Consulting and its site do not do anything that violates the related laws such as discretionary transaction. ④ Users can not reallocate and recycle the information provided by The Algorithm Company Analysis Consulting firm let alone the information provided by its Site. ⑤ Be sure to know about application period of this algorithm analysis report in order to improve its accuracy. Tel : 070 - 4667 - 5009 Email : tacac@tacac.co.kr Homepage : tacac.co.kr Blog : tacac.blog.me SERVICES M&A, IPO, RECOVER, CORPORATE RESTRUCTURING, MANAGEMENT OF TECHNOLOGY, BUSINESS STRATEGY, FAMILY BUSINESS Request : http://tacac.co.kr/?page_id=1374 ① Consulting is o The Algorithm accuracy or com change over tim results of the d Consulting bec ② information pr investment dec up ③ do anything th transaction. ④ The Algorithm information pr ⑤ analysis report