eubiologics 206650 Algorithm Investment Report
•
0 likes•181 views

This document provides financial and performance data for a company called Algorithm from 2017-2020. It includes quarterly sales, operating profit, net income, rates of return, debt ratios, and stock prices. It also analyzes the company's current stock price compared to its indication price range and scores the probability of the stock price rising. Finally, it provides strategies for purchasing the company's stocks over the next 3 months based on the analysis.
![[Price for scheduled purchasing]
Arbitrarily made
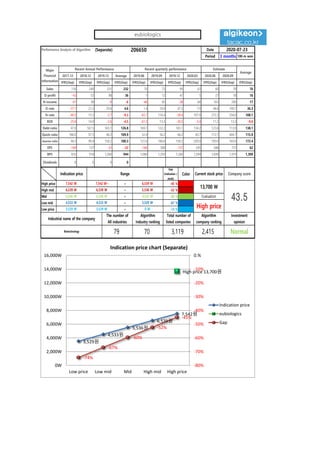
Algorithm stocks Trading Strategies (Separate) 206650 Date
Period
Gap
(Indication /
stock)
Color
2020-07-23
3 months
Current stock price Evaluation
Stock price rise
probability score
Investment opinion Prospective purchase amount
13,700 W High price 35.4 Normal 3,000,000 W
Suggested Purchase
Amount 603,448 W
Number of stocks
purchased 44
Indication price Range Buying / Selling Buying / Selling [Stocks]
High price 7,542 W 7,542 W~ ~ 6,539 W -45 % 271,237 W 36
High mid 6,539 W 6,539 W ~ 5,536 W -52 % 315,425 W 48
Mid 5,536 W 5,536 W ~ 4,533 W -60 % 359,614 W 65
Low mid 4,533 W 4,533 W ~ 3,529 W -67 % 403,802 W 89
low price 3,529 W 3,529 W ~ 0 W -74 % 447,990 W 127
2020.02.27 2020.03.26 2020.04.24 2020.05.27 2020.06.24 2020.07.22
38.9 45.4 37.9
Stock price rise
probability score
A Sector 50.7 48.1 52.1 40.5 51.3 52.1
35.4B Sector 59.6 27.5 40.5 40.5 39.6 23.8
Total average 55.1 37.8 49.4
14 % -20 %
2020.03.26 2020.04.24 2020.05.27 2020.06.24 2020.07.22
Total of
increase rate
Total score
A Sector -5 % 8 % -29 % 21 % 2 %
-11 % 39.3B Sector -117 % 41 % -15 % -2 % -67 %
Total average -46 % 23 % -27 %
-5%
8%
-29%
21%
2%
-117%
41%
-15%
-2%
-67%
-46%
23%
-27%
14%
-20%
-150%
-100%
-50%
0%
50%
2020.03.26 2020.04.24 2020.05.27 2020.06.24 2020.07.22
Increase rate of stock price rise
A sector
B sector
Total average
eubiologics
51 48
52
40
51 52
60
28
47
40 40
24
55
38
49
39
45
38
0
10
20
30
40
50
60
70
2020.02.27 2020.03.26 2020.04.24 2020.05.27 2020.06.24 2020.07.22
Stock price rise probability score
A sector
B sector
Total average](data:image/gif;base64,R0lGODlhAQABAIAAAAAAAP///yH5BAEAAAAALAAAAAABAAEAAAIBRAA7)
Recommended
Recommended
More Related Content
What's hot
What's hot (20)
Similar to eubiologics 206650 Algorithm Investment Report
Similar to eubiologics 206650 Algorithm Investment Report (20)
More from 알고리즘 기업분석 컨설팅-알기컨,algikeon
More from 알고리즘 기업분석 컨설팅-알기컨,algikeon (20)
Recently uploaded
Recently uploaded (20)
eubiologics 206650 Algorithm Investment Report
- 1. Performance Analysis of Algorithm (Separate) 206650 Date Period 3 months 100-m won 2017.12 2018.12 2019.12 Average 2019.06 2019.09 2019.12 2020.03 2020.06 2020.09 IFRS(Sep) IFRS(Sep) IFRS(Sep) IFRS(Sep) IFRS(Sep) IFRS(Sep) IFRS(Sep) IFRS(Sep) IFRS(Sep) IFRS(Sep) IFRS(Sep) Sales 116 249 331 232 70 73 99 63 60 78 76 O-profit -43 53 98 36 1 12 47 5 27 78 16 N-income -47 38 -9 -6 -46 85 -38 68 163 200 17 O-rate -37.1 21.3 29.6 4.6 1.4 16.4 47.5 7.9 44.6 100.1 36.3 N-rate -40.5 15.3 -2.7 -9.3 -65.7 116.4 -38.4 107.9 272.2 256.0 108.1 ROE -25.8 14.9 -2.6 -4.5 -61.3 13.3 -30.5 -3.4 11.2 13.3 -9.6 Debt-ratio 47.8 167.5 165.1 126.8 169.7 122.2 165.1 134.2 123.6 113.9 138.1 Quick-ratio 186.0 97.5 46.2 109.9 32.4 56.2 46.2 43.7 112.1 404.7 115.9 reserve-ratio 44.3 98.4 158.2 100.3 121.6 186.6 158.2 209.0 190.0 169.0 172.4 EPS -169 137 -32 -22 -166 306 -137 245 586 721 62 BPS 655 918 1,260 944 1,080 1,393 1,260 1,504 1,699 1,919 1,309 Dividends 0 0 0 0 2020-07-23 Major Financial Information Recent Annual Performance Recent quarterly performance Estimate Average Gap (Indication / stock) Color High price ~ -45 % High mid ~ -52 % Mid ~ -60 % Low mid ~ -67 % Low price ~ -74 % Indication price Range Current stock price Company score 6,539 W 6,539 W 5,536 W 5,536 W 5,536 W 4,533 W Evaluation 7,542 W 7,542 W~ 6,539 W 13,700 W 43.54,533 W 4,533 W 3,529 W High price Normal 3,529 W 3,529 W 0 W Industrial name of the company The number of All industries Algorithm Industry ranking Total number of listed companies Algorithm company ranking Investment opinion Biotechnology 79 70 3,119 2,415 3,529원 4,533원 5,536원 6,539원 7,542원 High price 13,700원 -74% -67% -60% -52% -45% -80% -70% -60% -50% -40% -30% -20% -10% 0.% 0W 2,000W 4,000W 6,000W 8,000W 10,000W 12,000W 14,000W 16,000W Low price Low mid Mid High mid High price Indication price chart (Separate) Indication price eubiologics Gap eubiologics
- 2. [Price for scheduled purchasing] Arbitrarily made Algorithm stocks Trading Strategies (Separate) 206650 Date Period Gap (Indication / stock) Color 2020-07-23 3 months Current stock price Evaluation Stock price rise probability score Investment opinion Prospective purchase amount 13,700 W High price 35.4 Normal 3,000,000 W Suggested Purchase Amount 603,448 W Number of stocks purchased 44 Indication price Range Buying / Selling Buying / Selling [Stocks] High price 7,542 W 7,542 W~ ~ 6,539 W -45 % 271,237 W 36 High mid 6,539 W 6,539 W ~ 5,536 W -52 % 315,425 W 48 Mid 5,536 W 5,536 W ~ 4,533 W -60 % 359,614 W 65 Low mid 4,533 W 4,533 W ~ 3,529 W -67 % 403,802 W 89 low price 3,529 W 3,529 W ~ 0 W -74 % 447,990 W 127 2020.02.27 2020.03.26 2020.04.24 2020.05.27 2020.06.24 2020.07.22 38.9 45.4 37.9 Stock price rise probability score A Sector 50.7 48.1 52.1 40.5 51.3 52.1 35.4B Sector 59.6 27.5 40.5 40.5 39.6 23.8 Total average 55.1 37.8 49.4 14 % -20 % 2020.03.26 2020.04.24 2020.05.27 2020.06.24 2020.07.22 Total of increase rate Total score A Sector -5 % 8 % -29 % 21 % 2 % -11 % 39.3B Sector -117 % 41 % -15 % -2 % -67 % Total average -46 % 23 % -27 % -5% 8% -29% 21% 2% -117% 41% -15% -2% -67% -46% 23% -27% 14% -20% -150% -100% -50% 0% 50% 2020.03.26 2020.04.24 2020.05.27 2020.06.24 2020.07.22 Increase rate of stock price rise A sector B sector Total average eubiologics 51 48 52 40 51 52 60 28 47 40 40 24 55 38 49 39 45 38 0 10 20 30 40 50 60 70 2020.02.27 2020.03.26 2020.04.24 2020.05.27 2020.06.24 2020.07.22 Stock price rise probability score A sector B sector Total average
- 3. may ded by Compliance notice ① The information provided by The Algorithm Company Analysis Consulting is obtained through reliable data and information and The Algorithm Company Analysis Program (TACAP), but its accuracy or completeness are not guaranteed. Furthermore, it may change over time.Therefore, we are not legally responsible for the results of the data provided by The Algorithm Company Analysis Consulting because of information errors or omissions. ② The Algorithm Company Analysis Consulting and all the information provided on it site are reference materials for investment decisions and the final responsibility of investment is up to users utilizing this information. ③ The Algorithm Company Analysis Consulting and its site do not do anything that violates the related laws such as discretionary transaction. ④ Users can not reallocate and recycle the information provided by The Algorithm Company Analysis Consulting firm let alone the information provided by its Site. ⑤ Be sure to know about application period of this algorithm analysis report in order to improve its accuracy. Tel : 070 - 4667 - 5009 Email : tacac@tacac.co.kr Homepage : tacac.co.kr Blog : tacac.blog.me SERVICES M&A, IPO, RECOVER, CORPORATE RESTRUCTURING, MANAGEMENT OF TECHNOLOGY, BUSINESS STRATEGY, FAMILY BUSINESS Request : http://tacac.co.kr/?page_id=1374