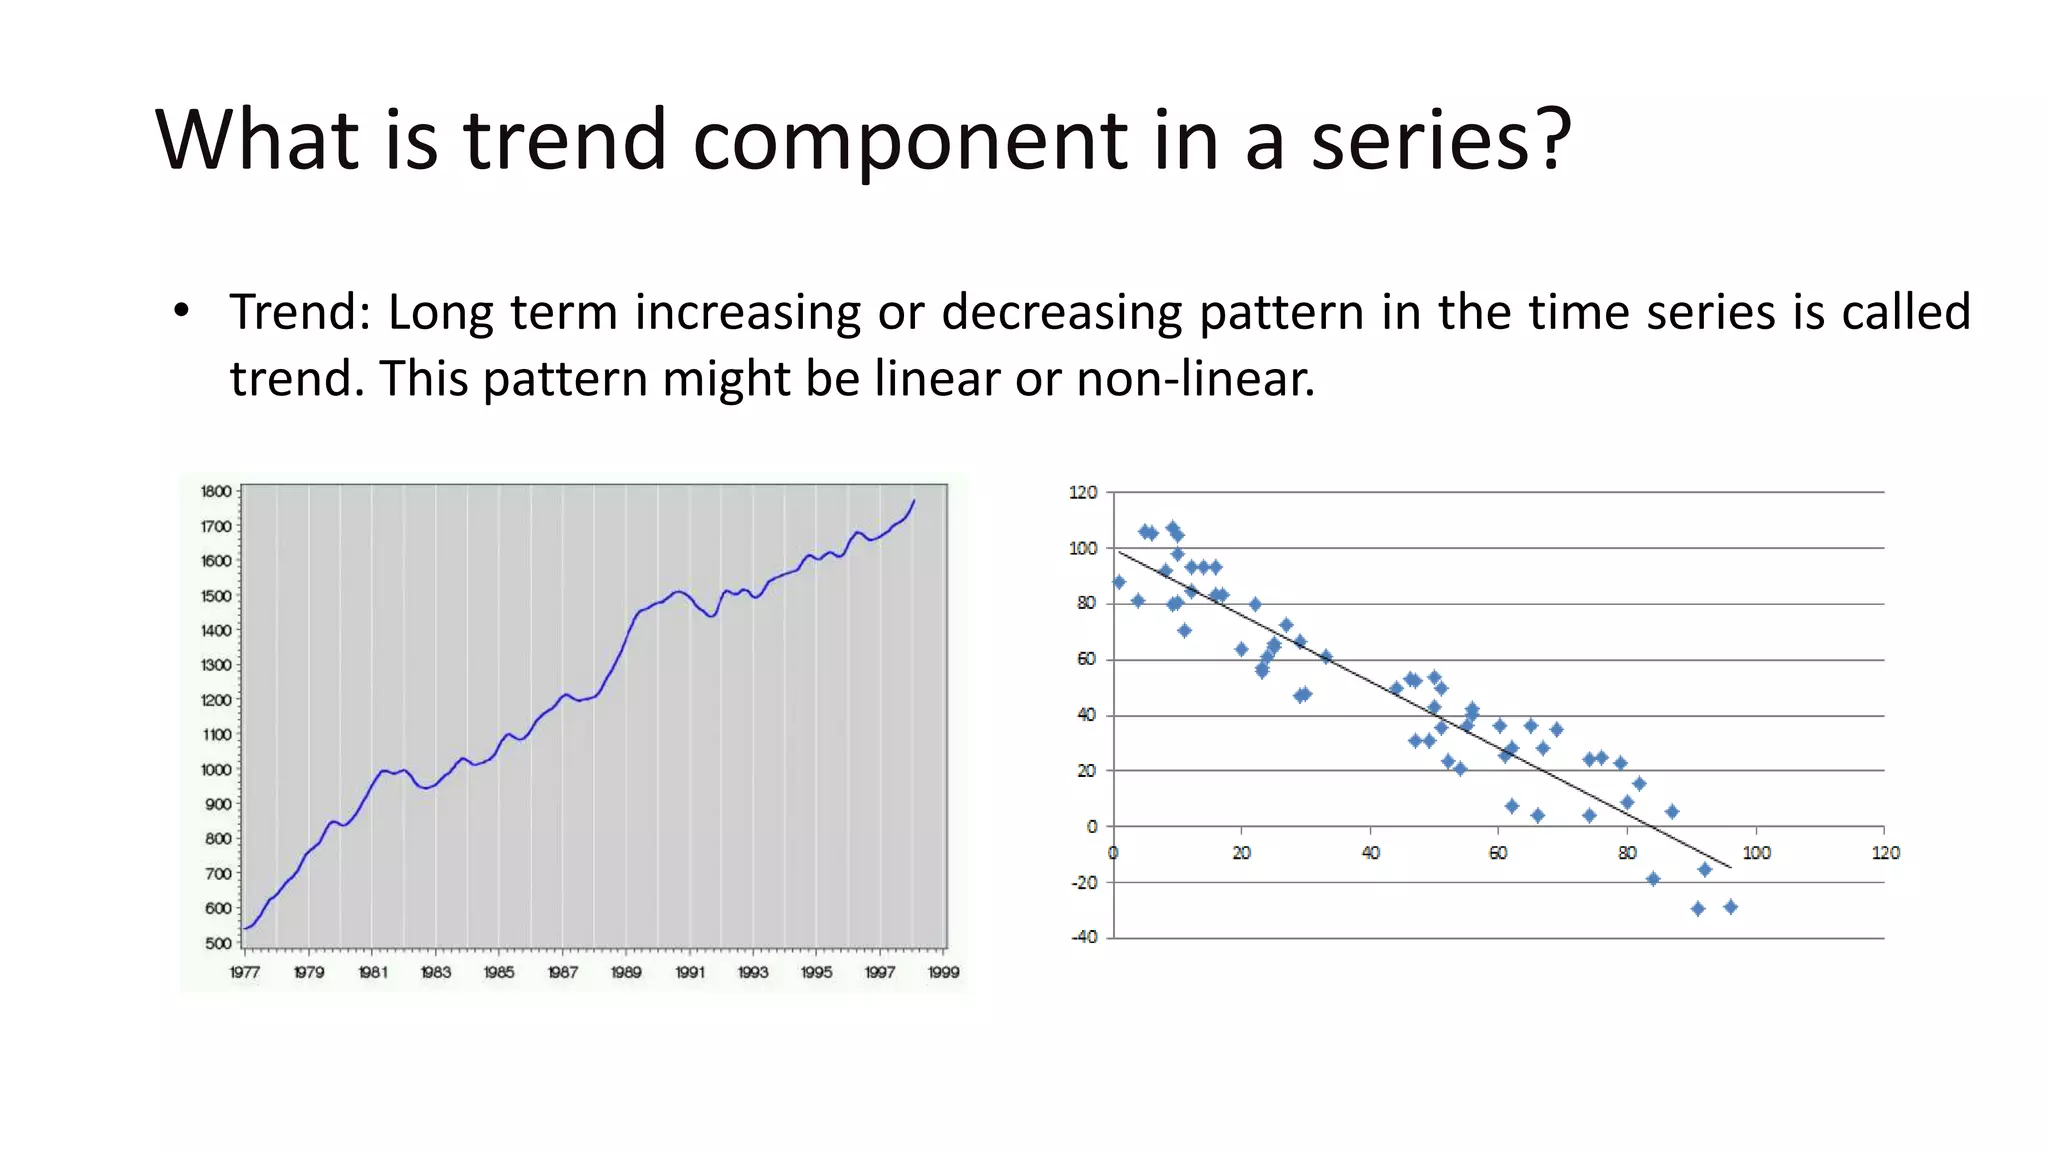
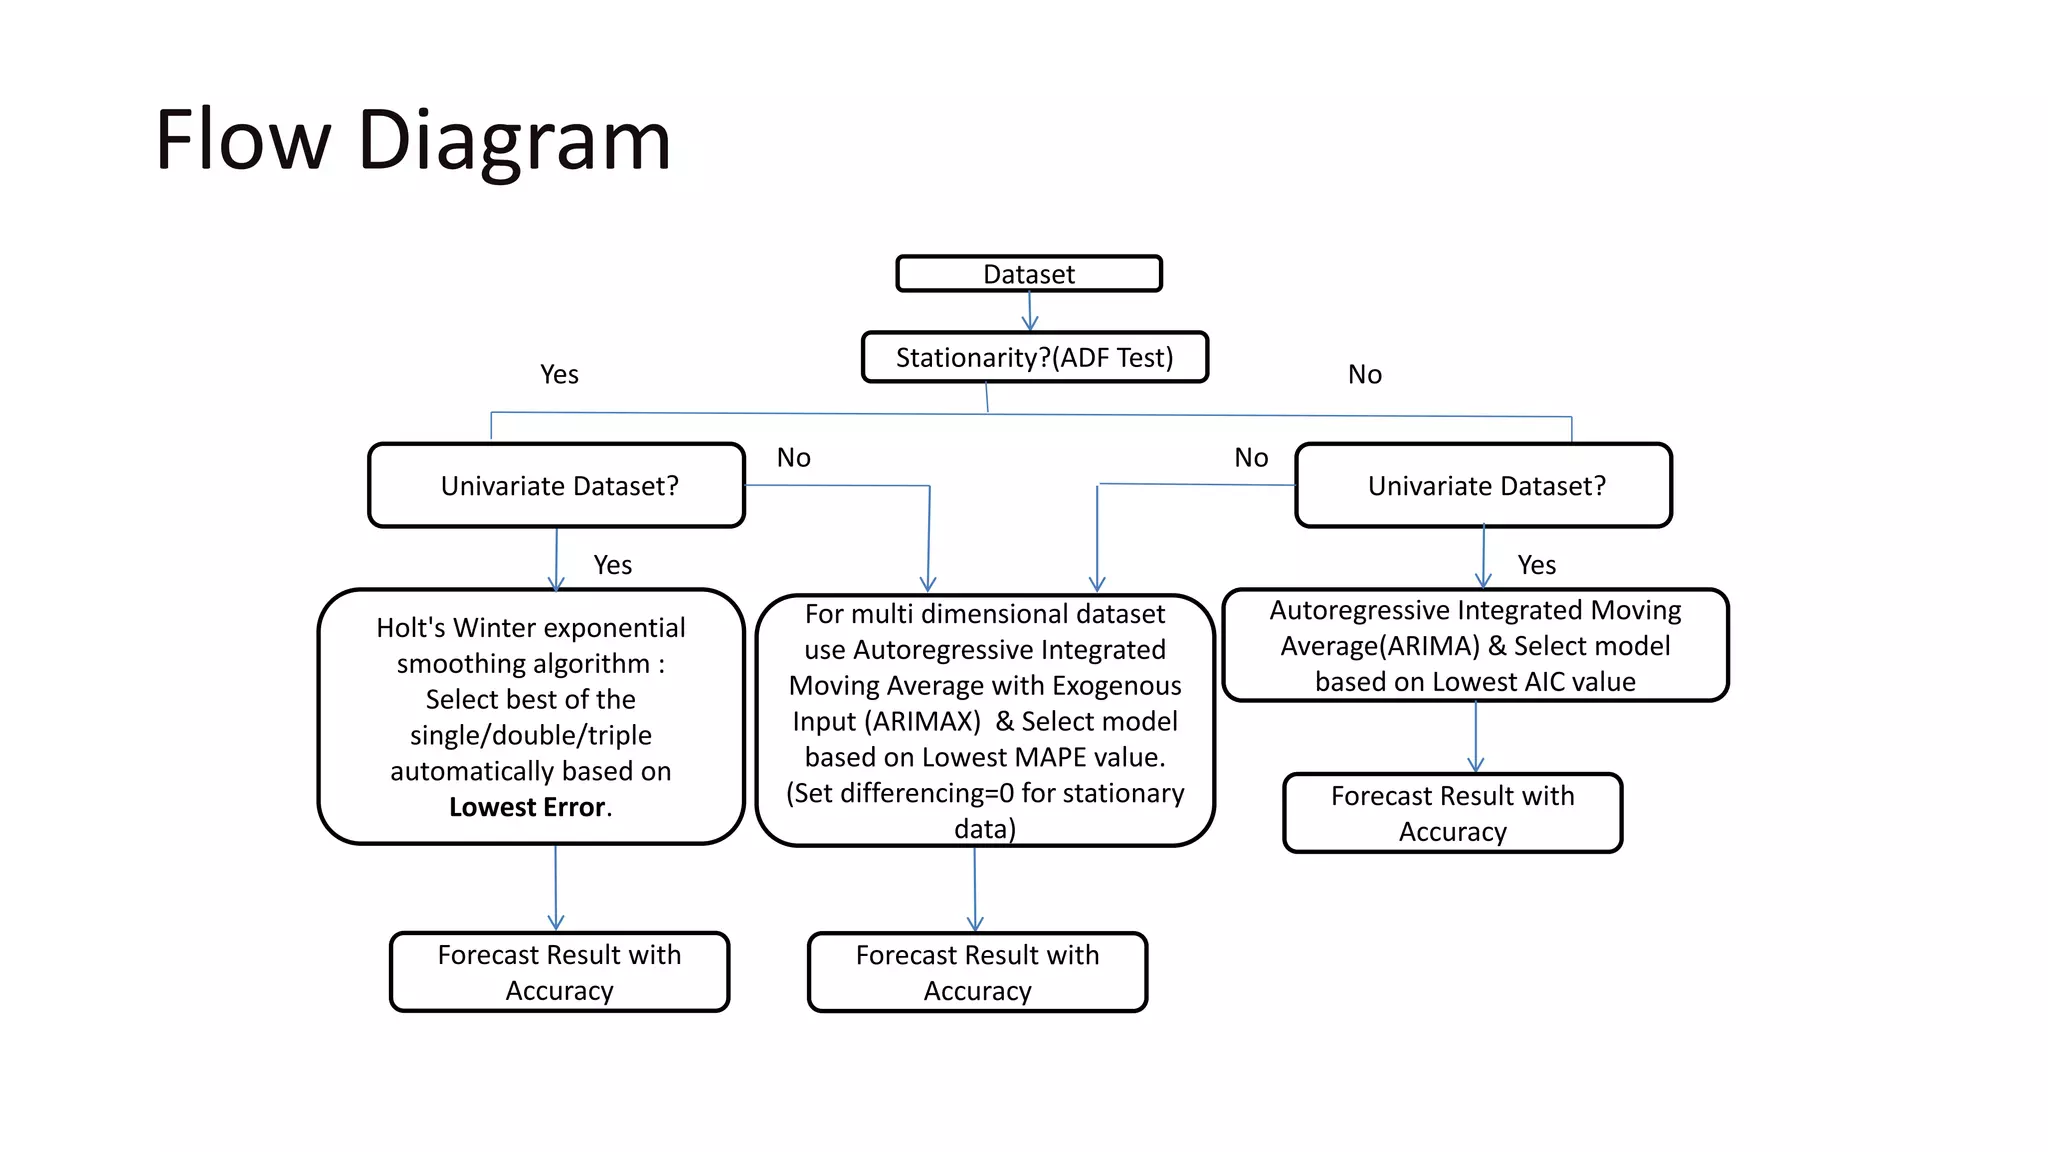
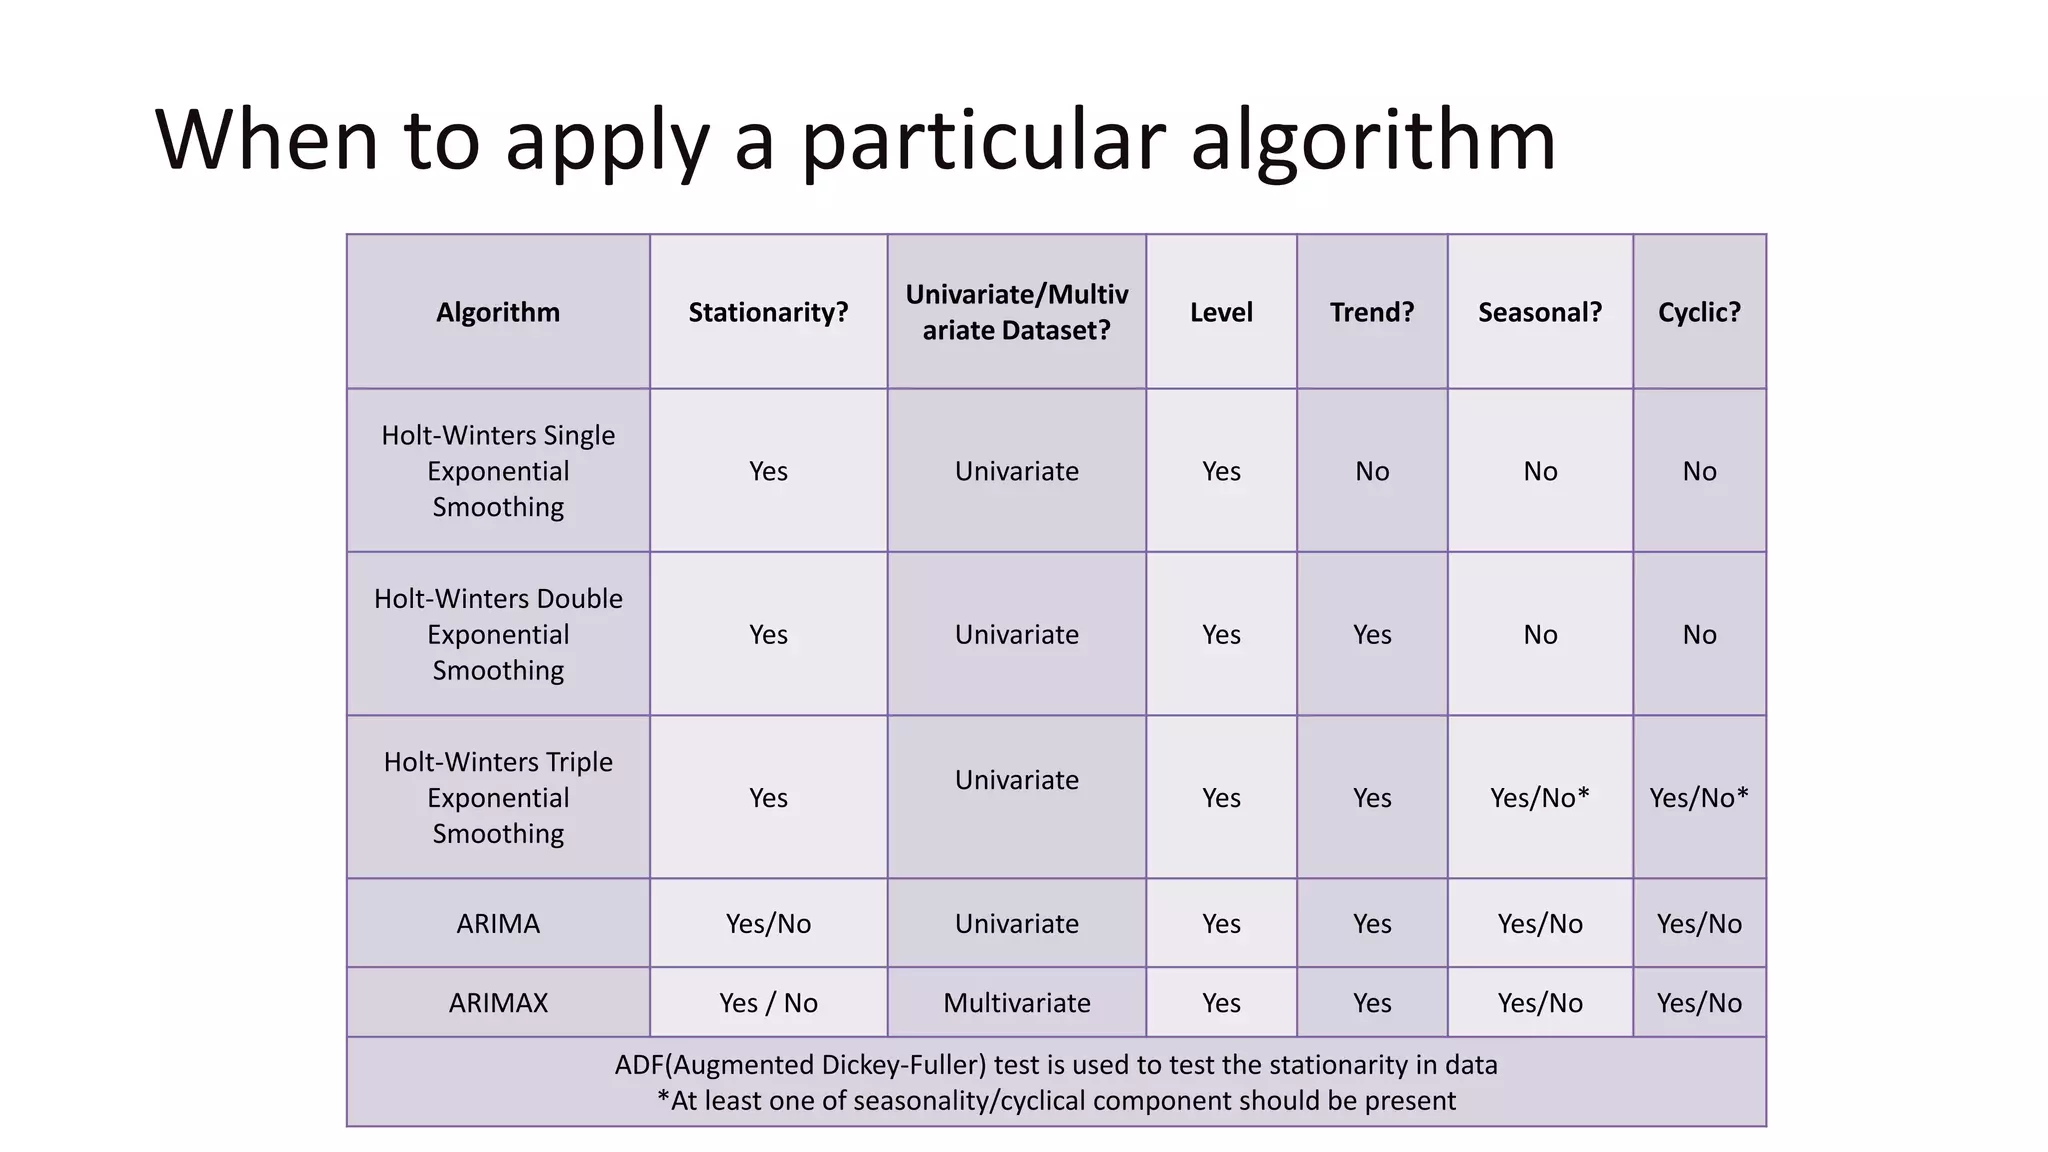
TIME SERIES FORECASTING
AND PATTERN IDENTIFICATION
A Simplistic Explainer Series For Citizen Data Scientists
J o u r n e y T o w a r d s A u g m e n t e d A n a l y t i c s
INTRODUCTION WITH
EXAMPLE
Introduction
• 'Time' is the most important factor which ensures success in a
business. It’s difficult to keep up with the speed of time. But,
technology has developed some powerful methods using
which we can 'see things' ahead of time.
• “Time series forecasting” is used to predict future values
based on previously observed values.
• The analysis of time series is extremely useful to a business
executive in planning future operations. A few examples are:
Example
• A Business executive can make intelligent choices regarding
capital investment, production, sales and inventory.
• Are gross revenues going to rise?
• Is March going to be the lowest month for sales each year?
• Is customer satisfaction going to increase over time?
• What would be the annual production of a crop like rice?
• Forecasting next day’s maximum temperature of a city based
on the maximum temperature of a city recorded by the
Meteorological Department over a number of years.
What can be forecasted?
• It depends on several factors including:
1. How much data are available.
2. Whether the forecasts can be made meaningfully and accurately.
• For example, forecasts of electricity demand can be made with remarkable accuracy if we have
sufficient historical data on electricity demand and weather conditions.
• On the other hand, tomorrow's Lotto numbers cannot be forecasted with any accuracy.
• While forecasting whether a tossed coin will come down as a head or a tail, you will be correct
about 50% of the time, whatever you forecast. In situations like this, forecasters need to be aware of
their own limitations.
TYPES OF DATA
PATTERNS
Types of data patterns
There are four types of data patterns in time series dataset:
1. Trend with following subtypes:
i. Linear Trend
ii. Exponential Trend
iii. Damped Trend
2. Seasonal.
3. Cyclical.
4. Random or Irregular or Error.
Trend patterns type 1 : Linear trend
• Definition : “A linear pattern is a continuous decrease or increase in numbers
over time.”
• On a graph, this appears as a straight line angled diagonally up or down (angle
may be steep or shallow). So basically, trend either can be upward trend or
downward trend.
Trend patterns type 1 : Linear trend - Examples
Examples of upward trend:
• World population increase over a period of time
• Increase of production of goods in emerging
economies over the years.
Example of downward trend:
• Sales of consumer goods during recession.
• Commodity prices go down during deflation.
Trend patterns type 2 : Exponential trend
• Definition : “Exponential trends are non linear curved lines where the data rises or
falls not at a steady rate, but at a higher rate.”
• Thus , instead of a straight line pointing diagonally up, the graph will show a curved
line where the last point in later years is higher than the first year, if the trend is up.
Trend patterns type 2 : Exponential trend - Example
• For example, an exponential trend for sales might indicate that sales were very
slow in early years, but the product has been getting increasingly popular year
in later years.
Trend patterns type 3 : Damped trend
• Definition : “A Damped Trend line is a curved line that shows data values
rise or fall initially, and then suddenly stops rising or falling.”
Trend patterns type 3 : Damped trend
• For example, a damped trend may show there was an overall decrease in
sales for a number of years and then the sales suddenly became flat and
stopped decreasing.
Seasonal pattern
• Definition : “Patterns are called seasonal when fluctuations repeat over
fixed periods of time and are hence predictable and do not extend beyond
a year.”
• Seasonality may be caused by various factors, such as weather, vacation, and
holidays and usually consists of periodic, repetitive, and generally regular and
predictable patterns.
• Seasonality can repeat on a weekly, monthly or quarterly basis, these periods
of time are structured and occur in a length of time less than a year.
Seasonal pattern
• Seasonality occurs when the time series exhibits regular fluctuations during
the same period every year.
Seasonal patterns - Example
• For example, it is commonly observed that the consumption of ice-cream during summer is
generally high and hence sales of an ice-cream would be higher in some months of the year while
relatively lower during winter months.
• Similarly sales of garments, umbrella, greeting cards and fire-works are subjected to seasonal trend
during festivals like Valentine’s Day, Eid, Christmas, Diwali, New Year etc.
Cyclical pattern
• Definition : “Patterns are called cyclical when fluctuations do not repeat over fixed
periods of time and are hence unpredictable and extend beyond a year.”
Cyclical pattern –
repeating at unpredicted intervals
Seasonal pattern –
repeating at regular period each year
As can be seen in the images above , seasonality is observed at regular period of time
every year and hence is predictable while cyclical pattern is unpredictable and does not
show up at regular period of time
Cyclical pattern - Example
• A typical business cycle consists of a period of prosperity followed by periods of
recession, depression, and then recovery with no fixed duration of the cycle.
• In a recession, for example, employment, production and many other business and
economic series are below the long-term trend lines. Conversely, in periods of rise
they are above their long-term trend lines.
• Similarly, in good economic times, people have more disposable income, so they
are more willing to take vacations and make use of air travel. Conversely, during bad
economic times, people are much more cautious about spending. As a result, they
tend to take more conservative vacations closer to home (if they go at all) and avoid
expensive air travel.
Random/ Irregular pattern
• Definition : “Irregular patterns are fluctuations in time series that are short in
duration, erratic in nature and follow no regularity in the occurrence pattern.”
• In prediction, the objective is to “model” all the components to some trend patterns
to the point that the only component that remains unexplained is the random
component.
Random pattern - Example
• Irregular economic fluctuations result from unusual events, such as floods, strikes, civil strife, large
bankruptcies and terrorist incidents. The impact of these fluctuations is usually limited to a certain
industry or market. For example, a flood may affect the distribution capability within a specific
region. Major natural disasters, such as the 2011 Japanese earthquake, can affect the supply chains
of several industries.
STATIONARY & LEVEL
COMPONENT IN TIME
SERIES
What is stationary?
• Definition : “A
stationary time
series is one whose
statistical
properties such as
mean, variance are
all constant over
time.” In a practical
sense, stationary
series vary around
a constant mean
level, neither
decreasing nor
increasing
systematically over
time, with constant
variance.
Stationaryseries
Nonstationaryseries
Mean is constant
Variance is constant
Mean is not constant
Variance is not constant
What is level component in a series?
• Level : In a time series there might be one or more significant jump, occurring
in few successive time points. Post the jump the level of a time series is
different compared to the one before jump. If there is no significant jump, we
say the time series has level 1, else more than one depending on the number
of considerable jump(s) as explained in the diagrams below
Level 1 Level 2 Level 3
What is trend component in a series?
• Trend: Long term increasing or decreasing pattern in the time series is called
trend. This pattern might be linear or non-linear.
FLOW DIAGRAM
Flow Diagram
Dataset
Stationarity?(ADF Test)
Holt's Winter exponential
smoothing algorithm :
Select best of the
single/double/triple
automatically based on
Lowest Error.
Yes No
Univariate Dataset?
Forecast Result with
Accuracy
Autoregressive Integrated Moving
Average(ARIMA) & Select model
based on Lowest AIC value
Yes
Univariate Dataset?
Yes
Forecast Result with
Accuracy
For multi dimensional dataset
use Autoregressive Integrated
Moving Average with Exogenous
Input (ARIMAX) & Select model
based on Lowest MAPE value.
(Set differencing=0 for stationary
data)
Forecast Result with
Accuracy
No No
When to apply a particular algorithm
Algorithm Stationarity?
Univariate/Multiv
ariate Dataset?
Level Trend? Seasonal? Cyclic?
Holt-Winters Single
Exponential
Smoothing
Yes Univariate Yes No No No
Holt-Winters Double
Exponential
Smoothing
Yes Univariate Yes Yes No No
Holt-Winters Triple
Exponential
Smoothing
Yes
Univariate
Yes Yes Yes/No* Yes/No*
ARIMA Yes/No Univariate Yes Yes Yes/No Yes/No
ARIMAX Yes / No Multivariate Yes Yes Yes/No Yes/No
ADF(Augmented Dickey-Fuller) test is used to test the stationarity in data
*At least one of seasonality/cyclical component should be present
WANT TO
LEARN
MORE?
Get in touch with us @
support@Smarten.com
And Do Checkout the Learning section on
Smarten.com
June 2018

What Are Data Trends and Patterns, and How Do They Impact Business Decisions?

  • 1.
    TIME SERIES FORECASTING ANDPATTERN IDENTIFICATION A Simplistic Explainer Series For Citizen Data Scientists J o u r n e y T o w a r d s A u g m e n t e d A n a l y t i c s
  • 2.
  • 3.
    Introduction • 'Time' isthe most important factor which ensures success in a business. It’s difficult to keep up with the speed of time. But, technology has developed some powerful methods using which we can 'see things' ahead of time. • “Time series forecasting” is used to predict future values based on previously observed values. • The analysis of time series is extremely useful to a business executive in planning future operations. A few examples are:
  • 4.
    Example • A Businessexecutive can make intelligent choices regarding capital investment, production, sales and inventory. • Are gross revenues going to rise? • Is March going to be the lowest month for sales each year? • Is customer satisfaction going to increase over time? • What would be the annual production of a crop like rice? • Forecasting next day’s maximum temperature of a city based on the maximum temperature of a city recorded by the Meteorological Department over a number of years.
  • 5.
    What can beforecasted? • It depends on several factors including: 1. How much data are available. 2. Whether the forecasts can be made meaningfully and accurately. • For example, forecasts of electricity demand can be made with remarkable accuracy if we have sufficient historical data on electricity demand and weather conditions. • On the other hand, tomorrow's Lotto numbers cannot be forecasted with any accuracy. • While forecasting whether a tossed coin will come down as a head or a tail, you will be correct about 50% of the time, whatever you forecast. In situations like this, forecasters need to be aware of their own limitations.
  • 6.
  • 7.
    Types of datapatterns There are four types of data patterns in time series dataset: 1. Trend with following subtypes: i. Linear Trend ii. Exponential Trend iii. Damped Trend 2. Seasonal. 3. Cyclical. 4. Random or Irregular or Error.
  • 8.
    Trend patterns type1 : Linear trend • Definition : “A linear pattern is a continuous decrease or increase in numbers over time.” • On a graph, this appears as a straight line angled diagonally up or down (angle may be steep or shallow). So basically, trend either can be upward trend or downward trend.
  • 9.
    Trend patterns type1 : Linear trend - Examples Examples of upward trend: • World population increase over a period of time • Increase of production of goods in emerging economies over the years. Example of downward trend: • Sales of consumer goods during recession. • Commodity prices go down during deflation.
  • 10.
    Trend patterns type2 : Exponential trend • Definition : “Exponential trends are non linear curved lines where the data rises or falls not at a steady rate, but at a higher rate.” • Thus , instead of a straight line pointing diagonally up, the graph will show a curved line where the last point in later years is higher than the first year, if the trend is up.
  • 11.
    Trend patterns type2 : Exponential trend - Example • For example, an exponential trend for sales might indicate that sales were very slow in early years, but the product has been getting increasingly popular year in later years.
  • 12.
    Trend patterns type3 : Damped trend • Definition : “A Damped Trend line is a curved line that shows data values rise or fall initially, and then suddenly stops rising or falling.”
  • 13.
    Trend patterns type3 : Damped trend • For example, a damped trend may show there was an overall decrease in sales for a number of years and then the sales suddenly became flat and stopped decreasing.
  • 14.
    Seasonal pattern • Definition: “Patterns are called seasonal when fluctuations repeat over fixed periods of time and are hence predictable and do not extend beyond a year.” • Seasonality may be caused by various factors, such as weather, vacation, and holidays and usually consists of periodic, repetitive, and generally regular and predictable patterns. • Seasonality can repeat on a weekly, monthly or quarterly basis, these periods of time are structured and occur in a length of time less than a year.
  • 15.
    Seasonal pattern • Seasonalityoccurs when the time series exhibits regular fluctuations during the same period every year.
  • 16.
    Seasonal patterns -Example • For example, it is commonly observed that the consumption of ice-cream during summer is generally high and hence sales of an ice-cream would be higher in some months of the year while relatively lower during winter months. • Similarly sales of garments, umbrella, greeting cards and fire-works are subjected to seasonal trend during festivals like Valentine’s Day, Eid, Christmas, Diwali, New Year etc.
  • 17.
    Cyclical pattern • Definition: “Patterns are called cyclical when fluctuations do not repeat over fixed periods of time and are hence unpredictable and extend beyond a year.” Cyclical pattern – repeating at unpredicted intervals Seasonal pattern – repeating at regular period each year As can be seen in the images above , seasonality is observed at regular period of time every year and hence is predictable while cyclical pattern is unpredictable and does not show up at regular period of time
  • 18.
    Cyclical pattern -Example • A typical business cycle consists of a period of prosperity followed by periods of recession, depression, and then recovery with no fixed duration of the cycle. • In a recession, for example, employment, production and many other business and economic series are below the long-term trend lines. Conversely, in periods of rise they are above their long-term trend lines. • Similarly, in good economic times, people have more disposable income, so they are more willing to take vacations and make use of air travel. Conversely, during bad economic times, people are much more cautious about spending. As a result, they tend to take more conservative vacations closer to home (if they go at all) and avoid expensive air travel.
  • 19.
    Random/ Irregular pattern •Definition : “Irregular patterns are fluctuations in time series that are short in duration, erratic in nature and follow no regularity in the occurrence pattern.” • In prediction, the objective is to “model” all the components to some trend patterns to the point that the only component that remains unexplained is the random component.
  • 20.
    Random pattern -Example • Irregular economic fluctuations result from unusual events, such as floods, strikes, civil strife, large bankruptcies and terrorist incidents. The impact of these fluctuations is usually limited to a certain industry or market. For example, a flood may affect the distribution capability within a specific region. Major natural disasters, such as the 2011 Japanese earthquake, can affect the supply chains of several industries.
  • 21.
  • 22.
    What is stationary? •Definition : “A stationary time series is one whose statistical properties such as mean, variance are all constant over time.” In a practical sense, stationary series vary around a constant mean level, neither decreasing nor increasing systematically over time, with constant variance. Stationaryseries Nonstationaryseries Mean is constant Variance is constant Mean is not constant Variance is not constant
  • 23.
    What is levelcomponent in a series? • Level : In a time series there might be one or more significant jump, occurring in few successive time points. Post the jump the level of a time series is different compared to the one before jump. If there is no significant jump, we say the time series has level 1, else more than one depending on the number of considerable jump(s) as explained in the diagrams below Level 1 Level 2 Level 3
  • 24.
    What is trendcomponent in a series? • Trend: Long term increasing or decreasing pattern in the time series is called trend. This pattern might be linear or non-linear.
  • 25.
  • 26.
    Flow Diagram Dataset Stationarity?(ADF Test) Holt'sWinter exponential smoothing algorithm : Select best of the single/double/triple automatically based on Lowest Error. Yes No Univariate Dataset? Forecast Result with Accuracy Autoregressive Integrated Moving Average(ARIMA) & Select model based on Lowest AIC value Yes Univariate Dataset? Yes Forecast Result with Accuracy For multi dimensional dataset use Autoregressive Integrated Moving Average with Exogenous Input (ARIMAX) & Select model based on Lowest MAPE value. (Set differencing=0 for stationary data) Forecast Result with Accuracy No No
  • 27.
    When to applya particular algorithm Algorithm Stationarity? Univariate/Multiv ariate Dataset? Level Trend? Seasonal? Cyclic? Holt-Winters Single Exponential Smoothing Yes Univariate Yes No No No Holt-Winters Double Exponential Smoothing Yes Univariate Yes Yes No No Holt-Winters Triple Exponential Smoothing Yes Univariate Yes Yes Yes/No* Yes/No* ARIMA Yes/No Univariate Yes Yes Yes/No Yes/No ARIMAX Yes / No Multivariate Yes Yes Yes/No Yes/No ADF(Augmented Dickey-Fuller) test is used to test the stationarity in data *At least one of seasonality/cyclical component should be present
  • 28.
    WANT TO LEARN MORE? Get intouch with us @ support@Smarten.com And Do Checkout the Learning section on Smarten.com June 2018