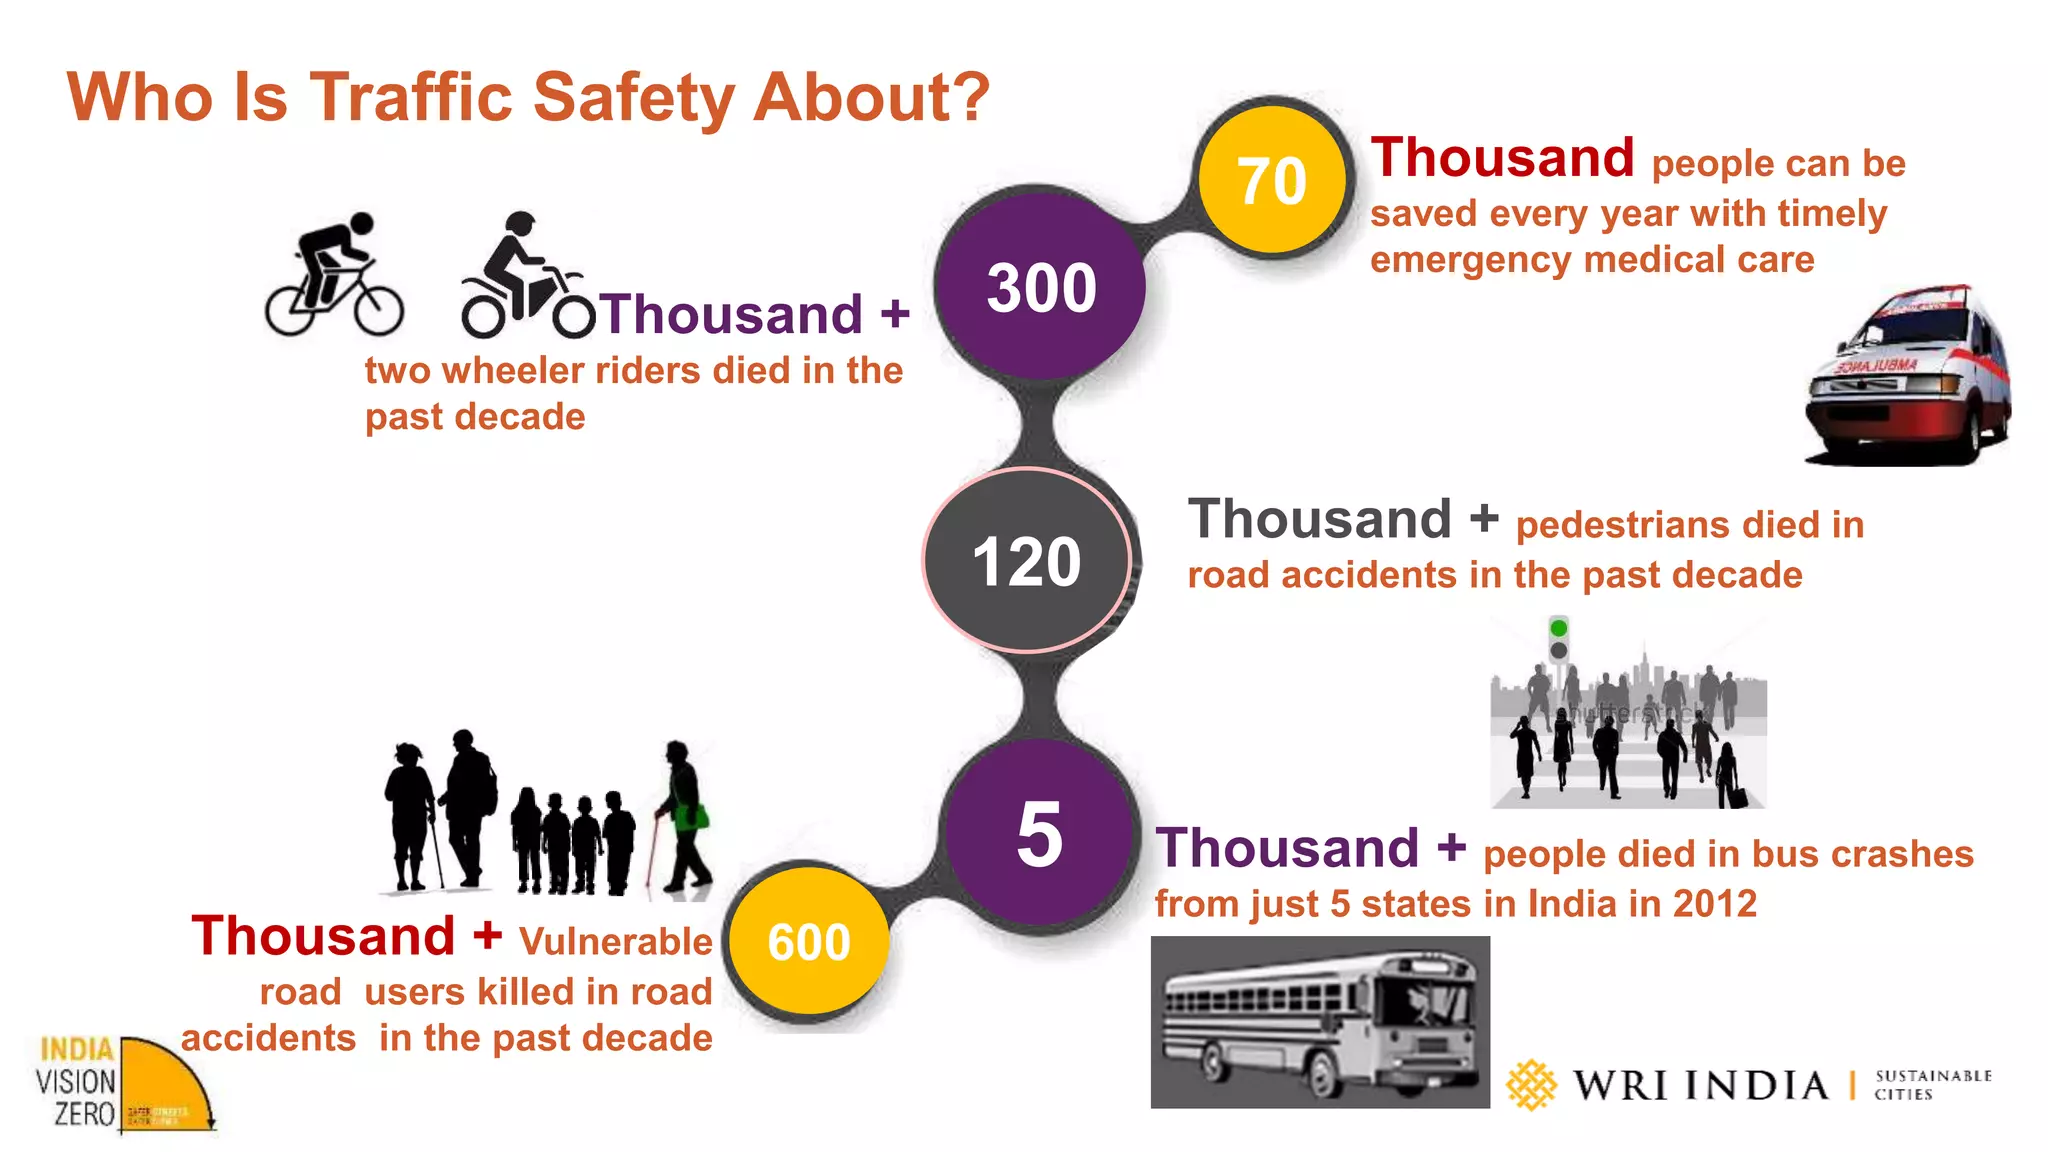
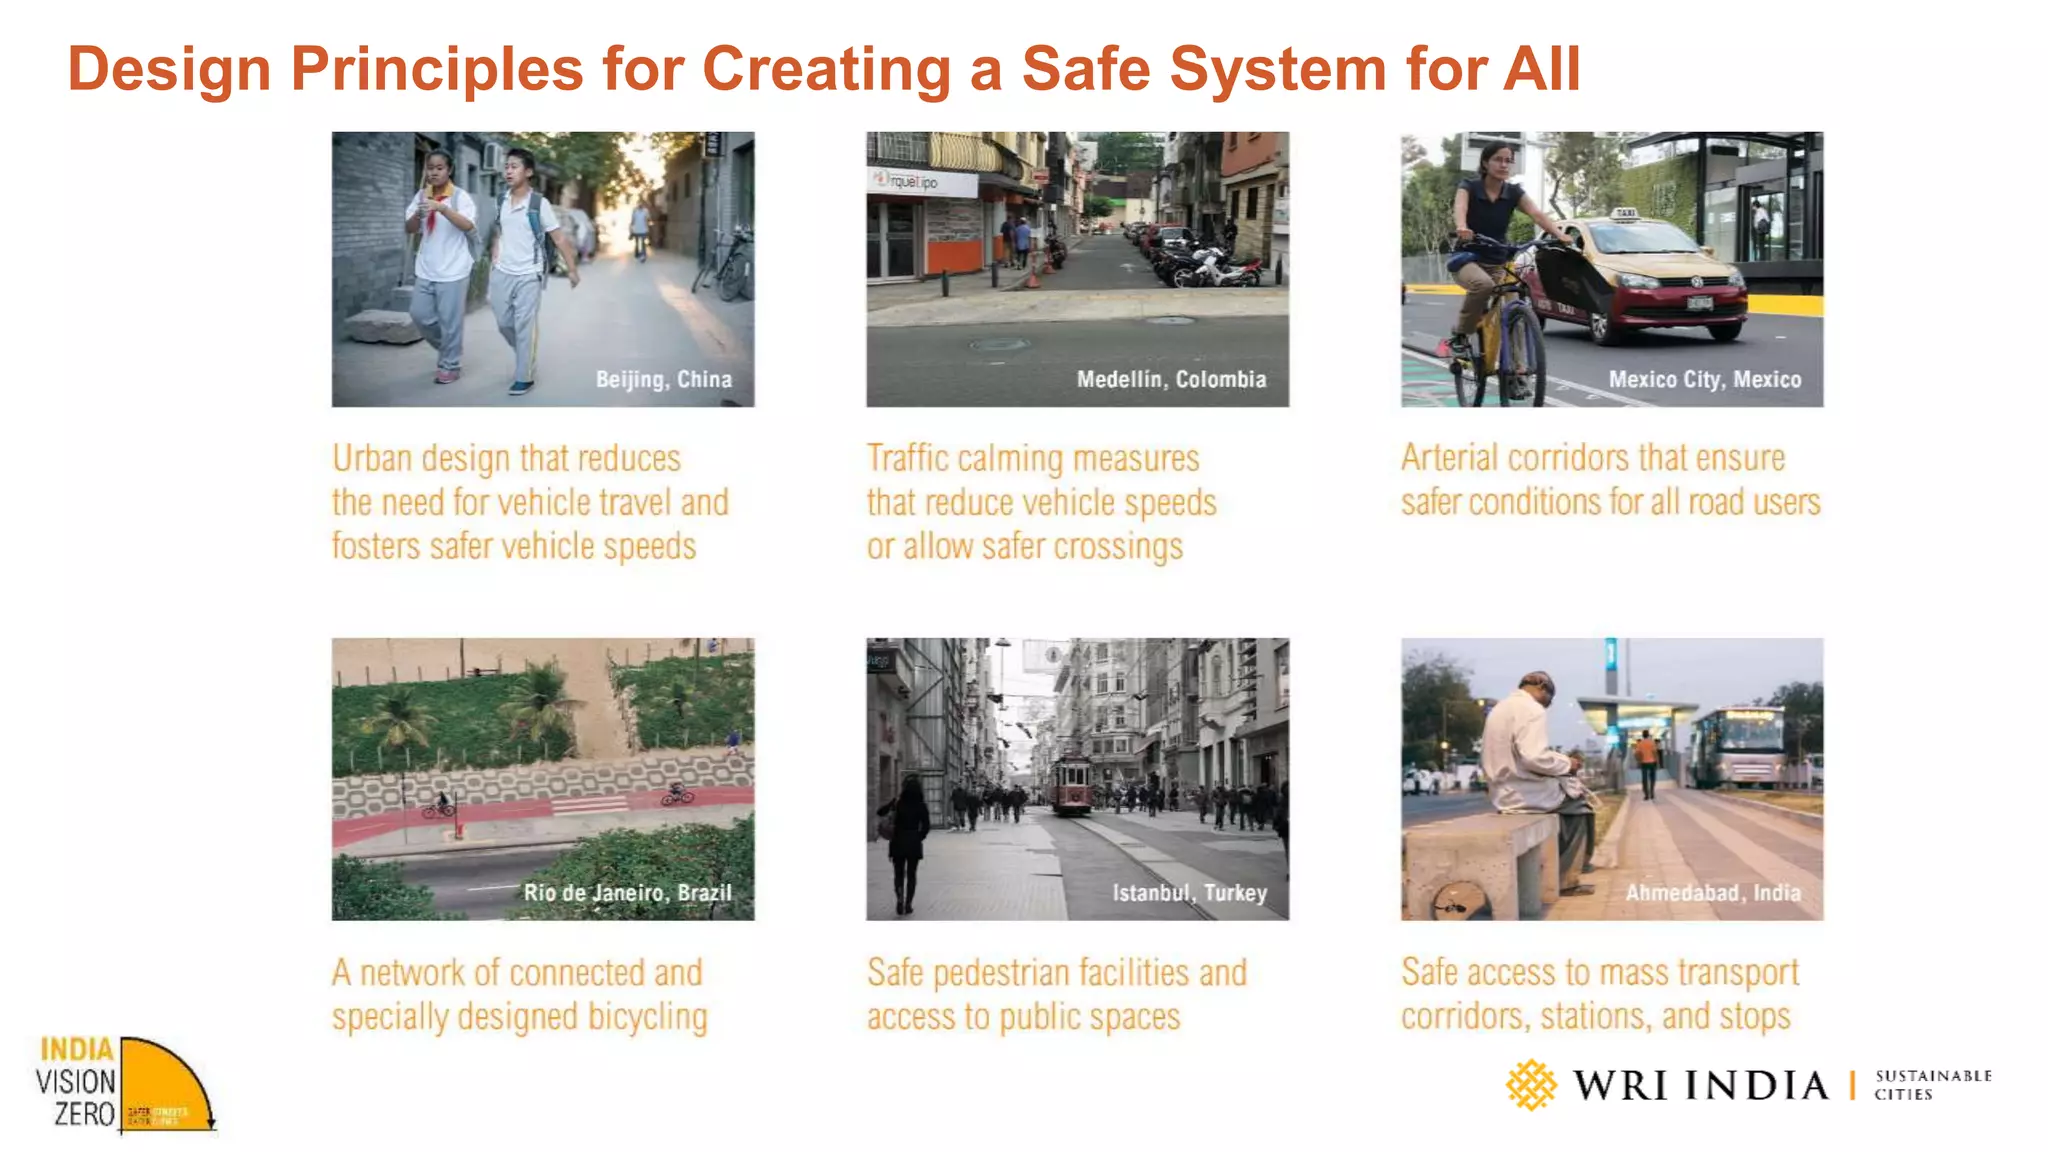
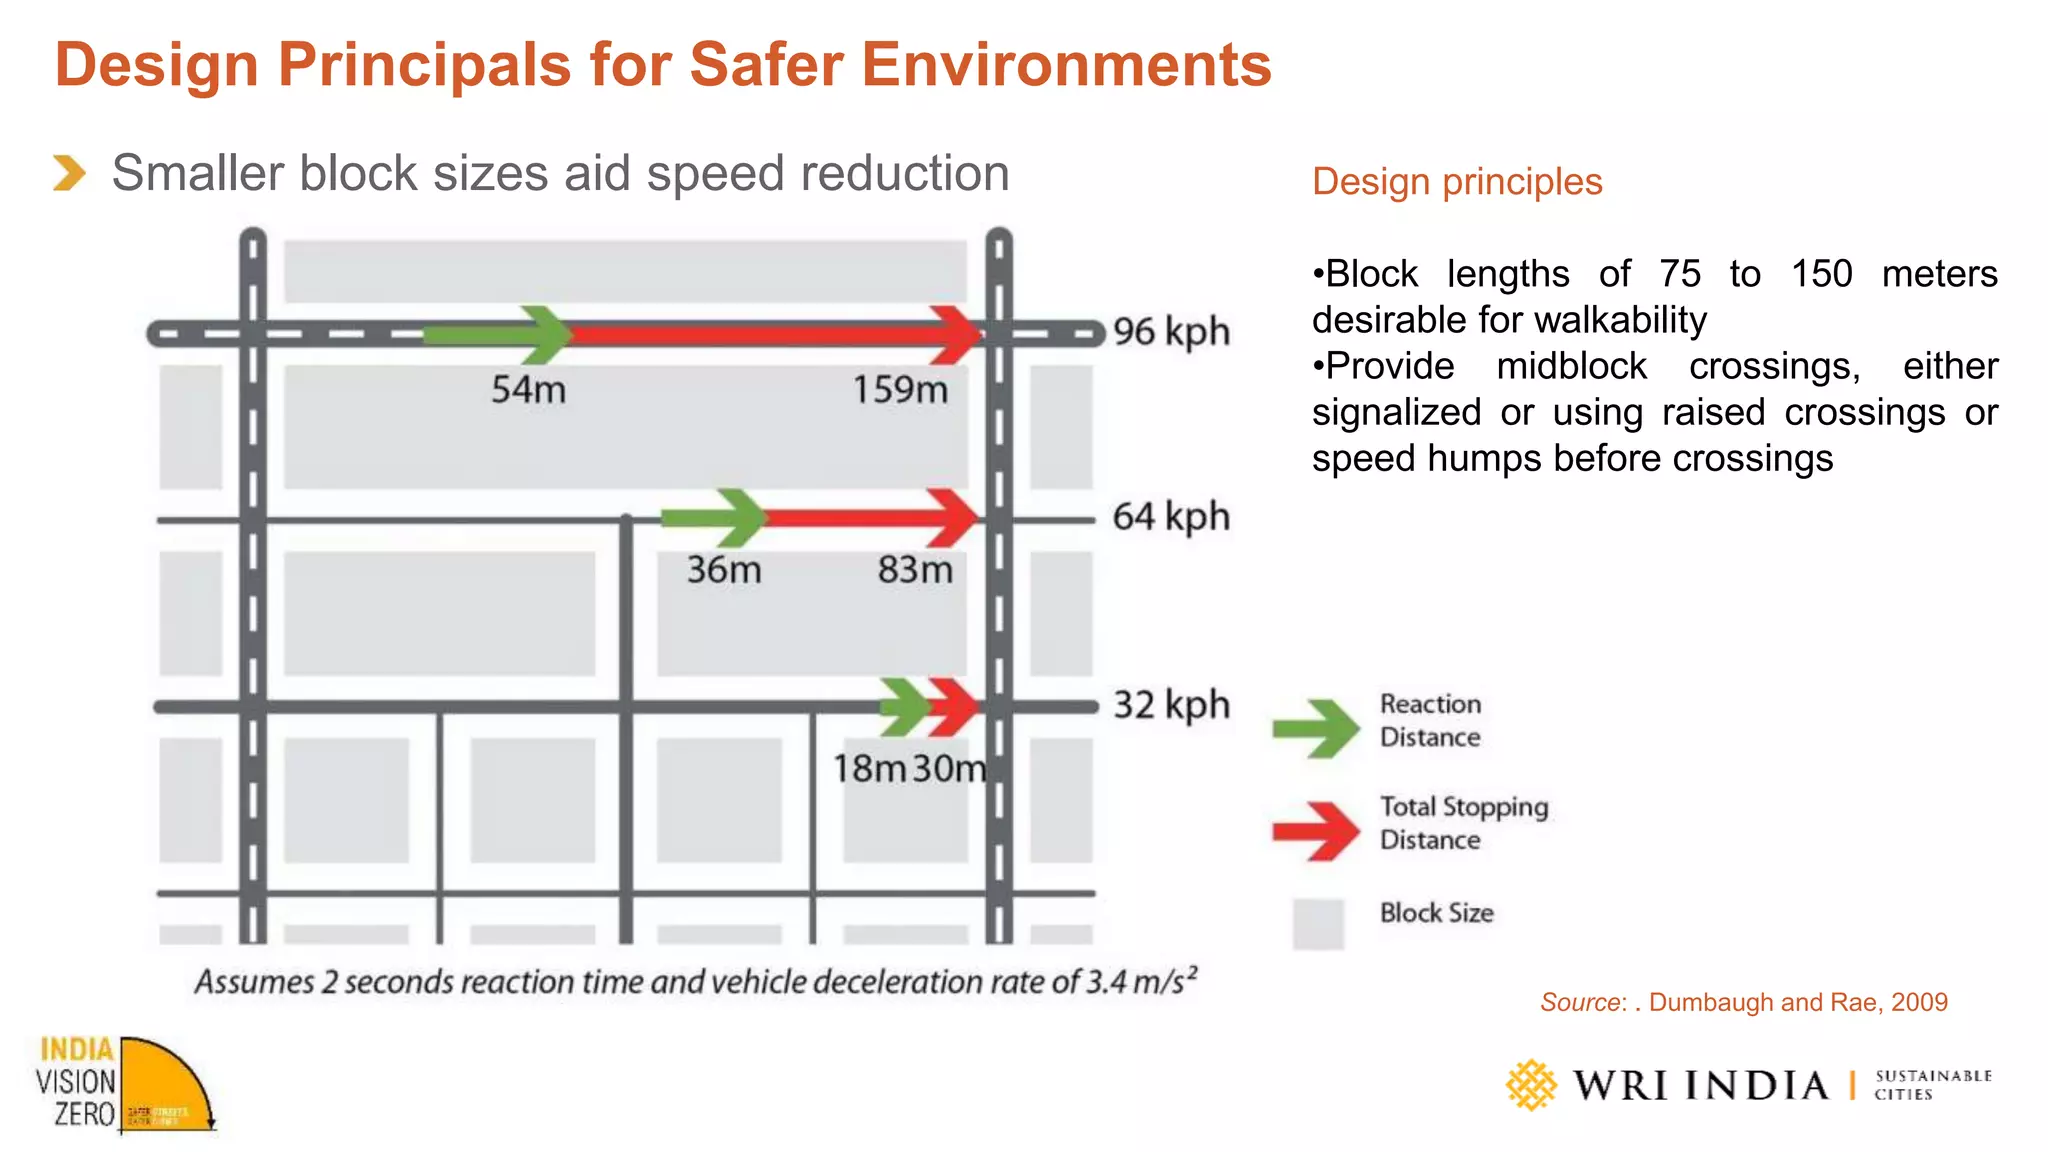
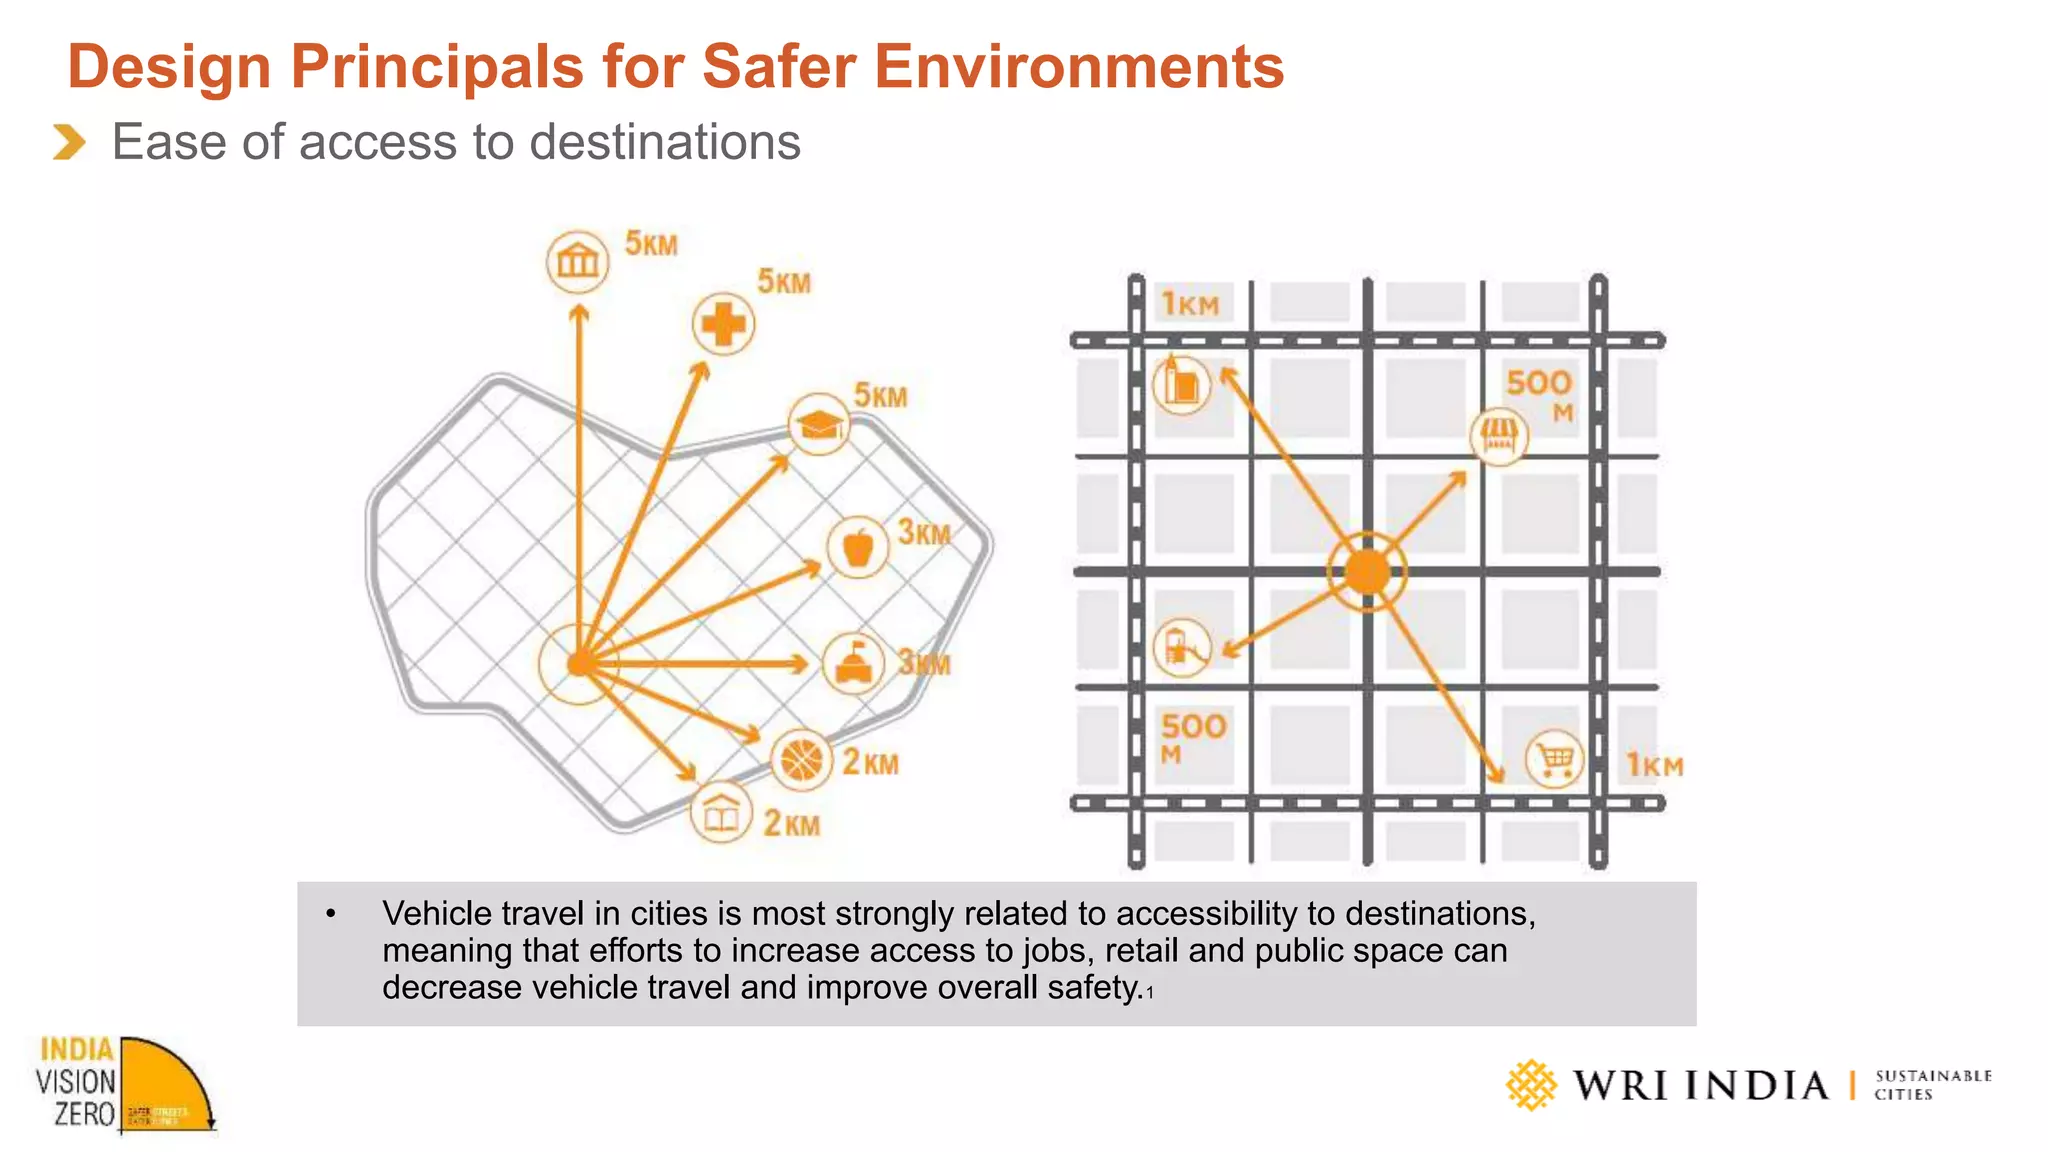
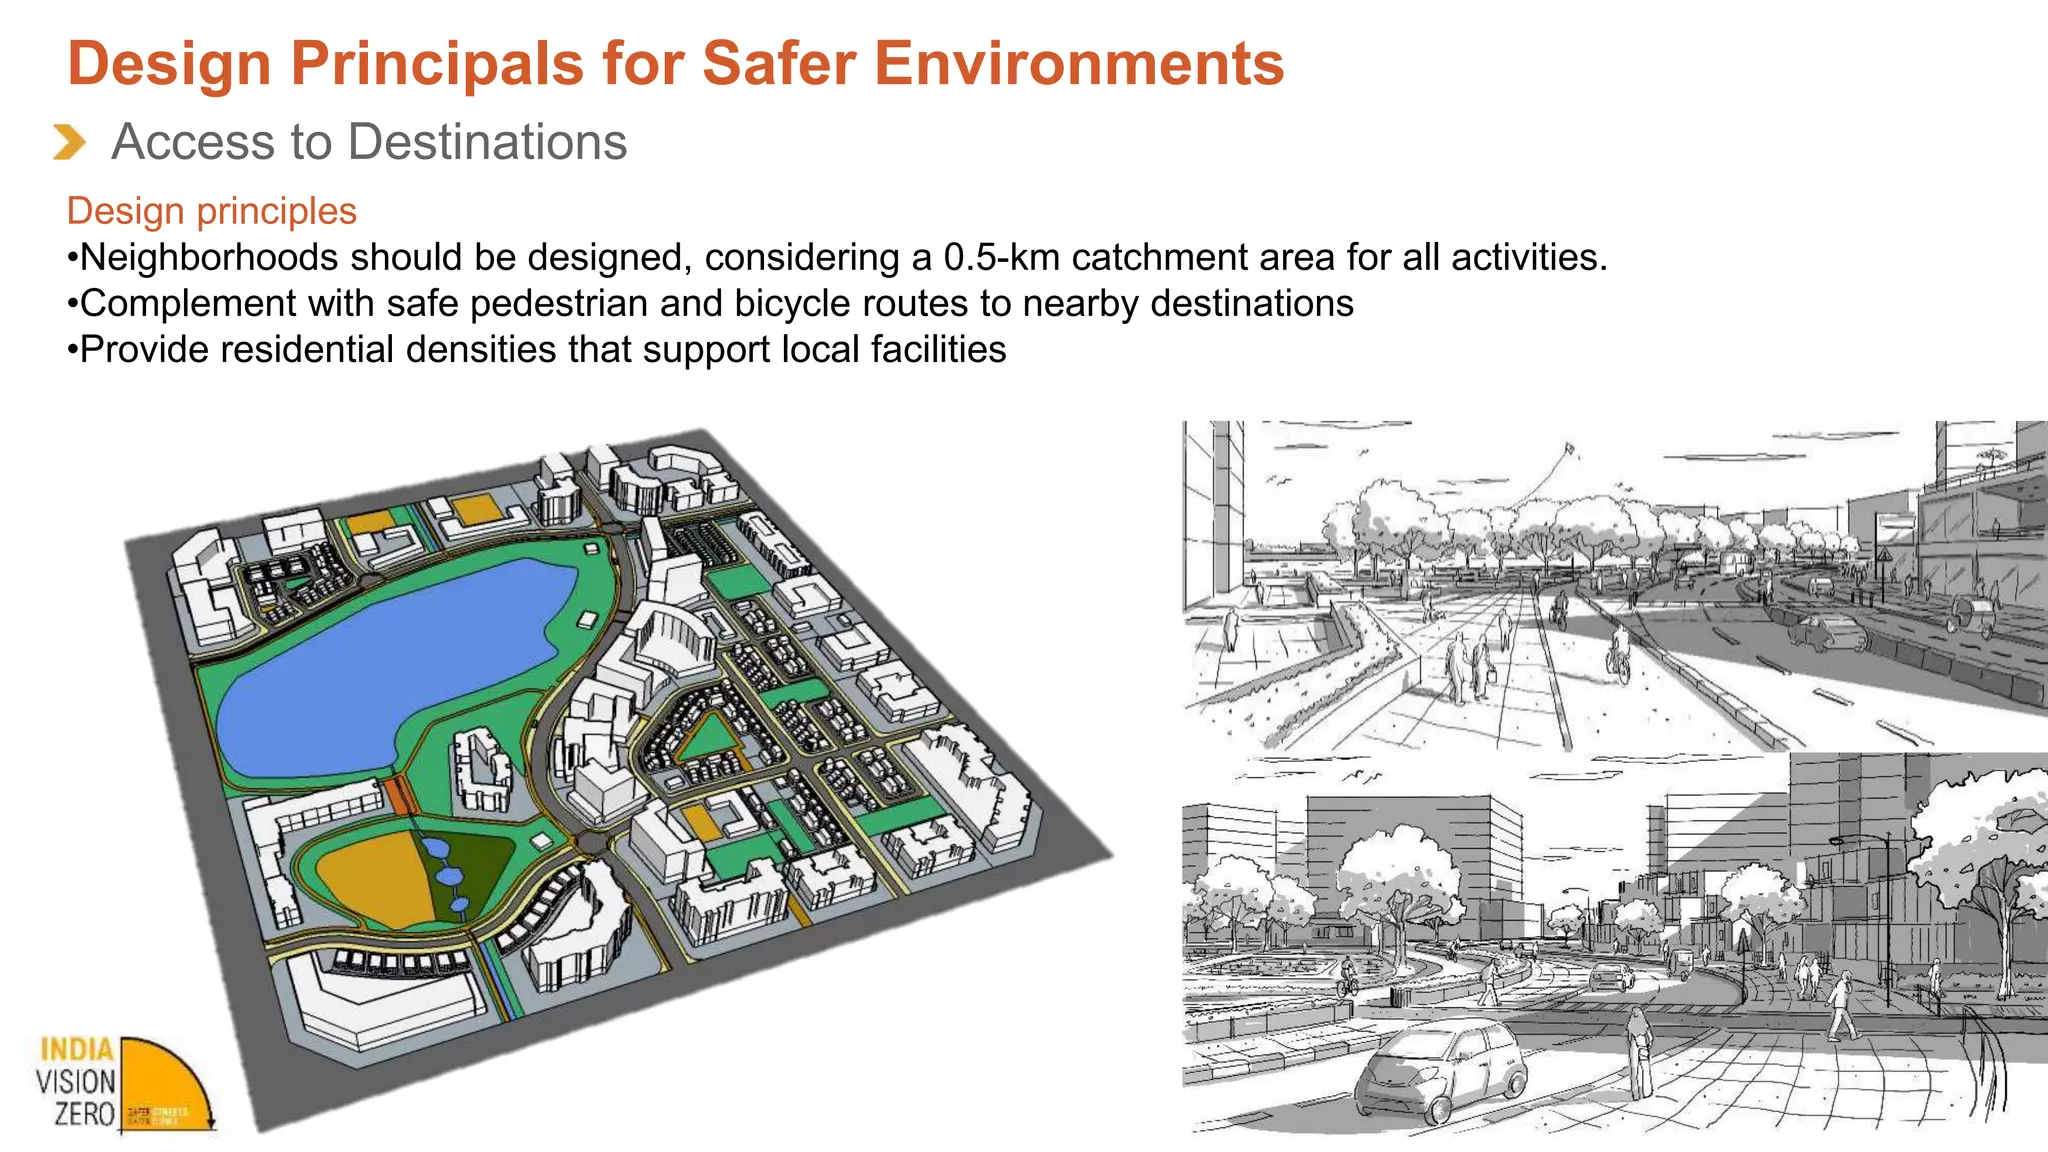
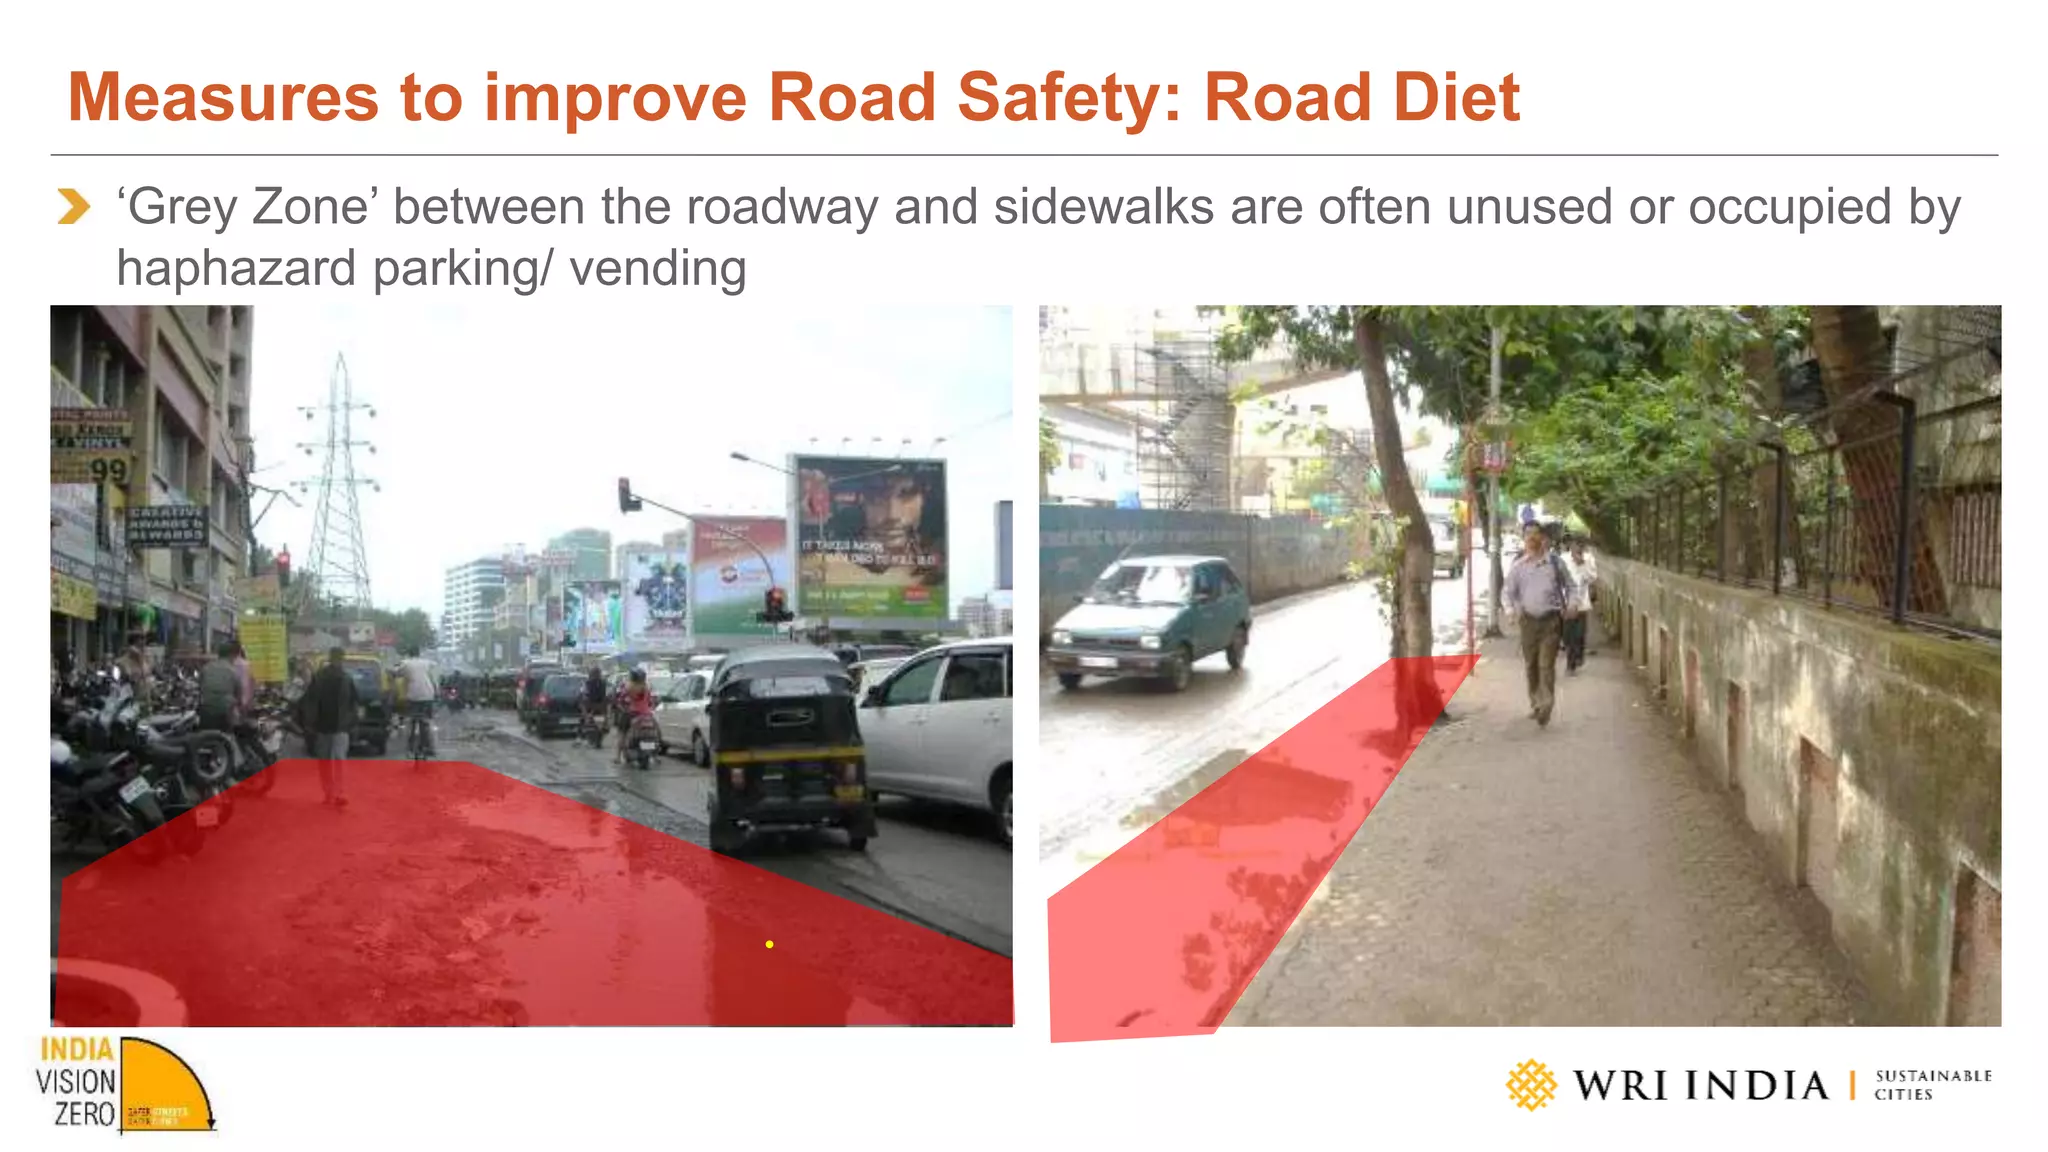
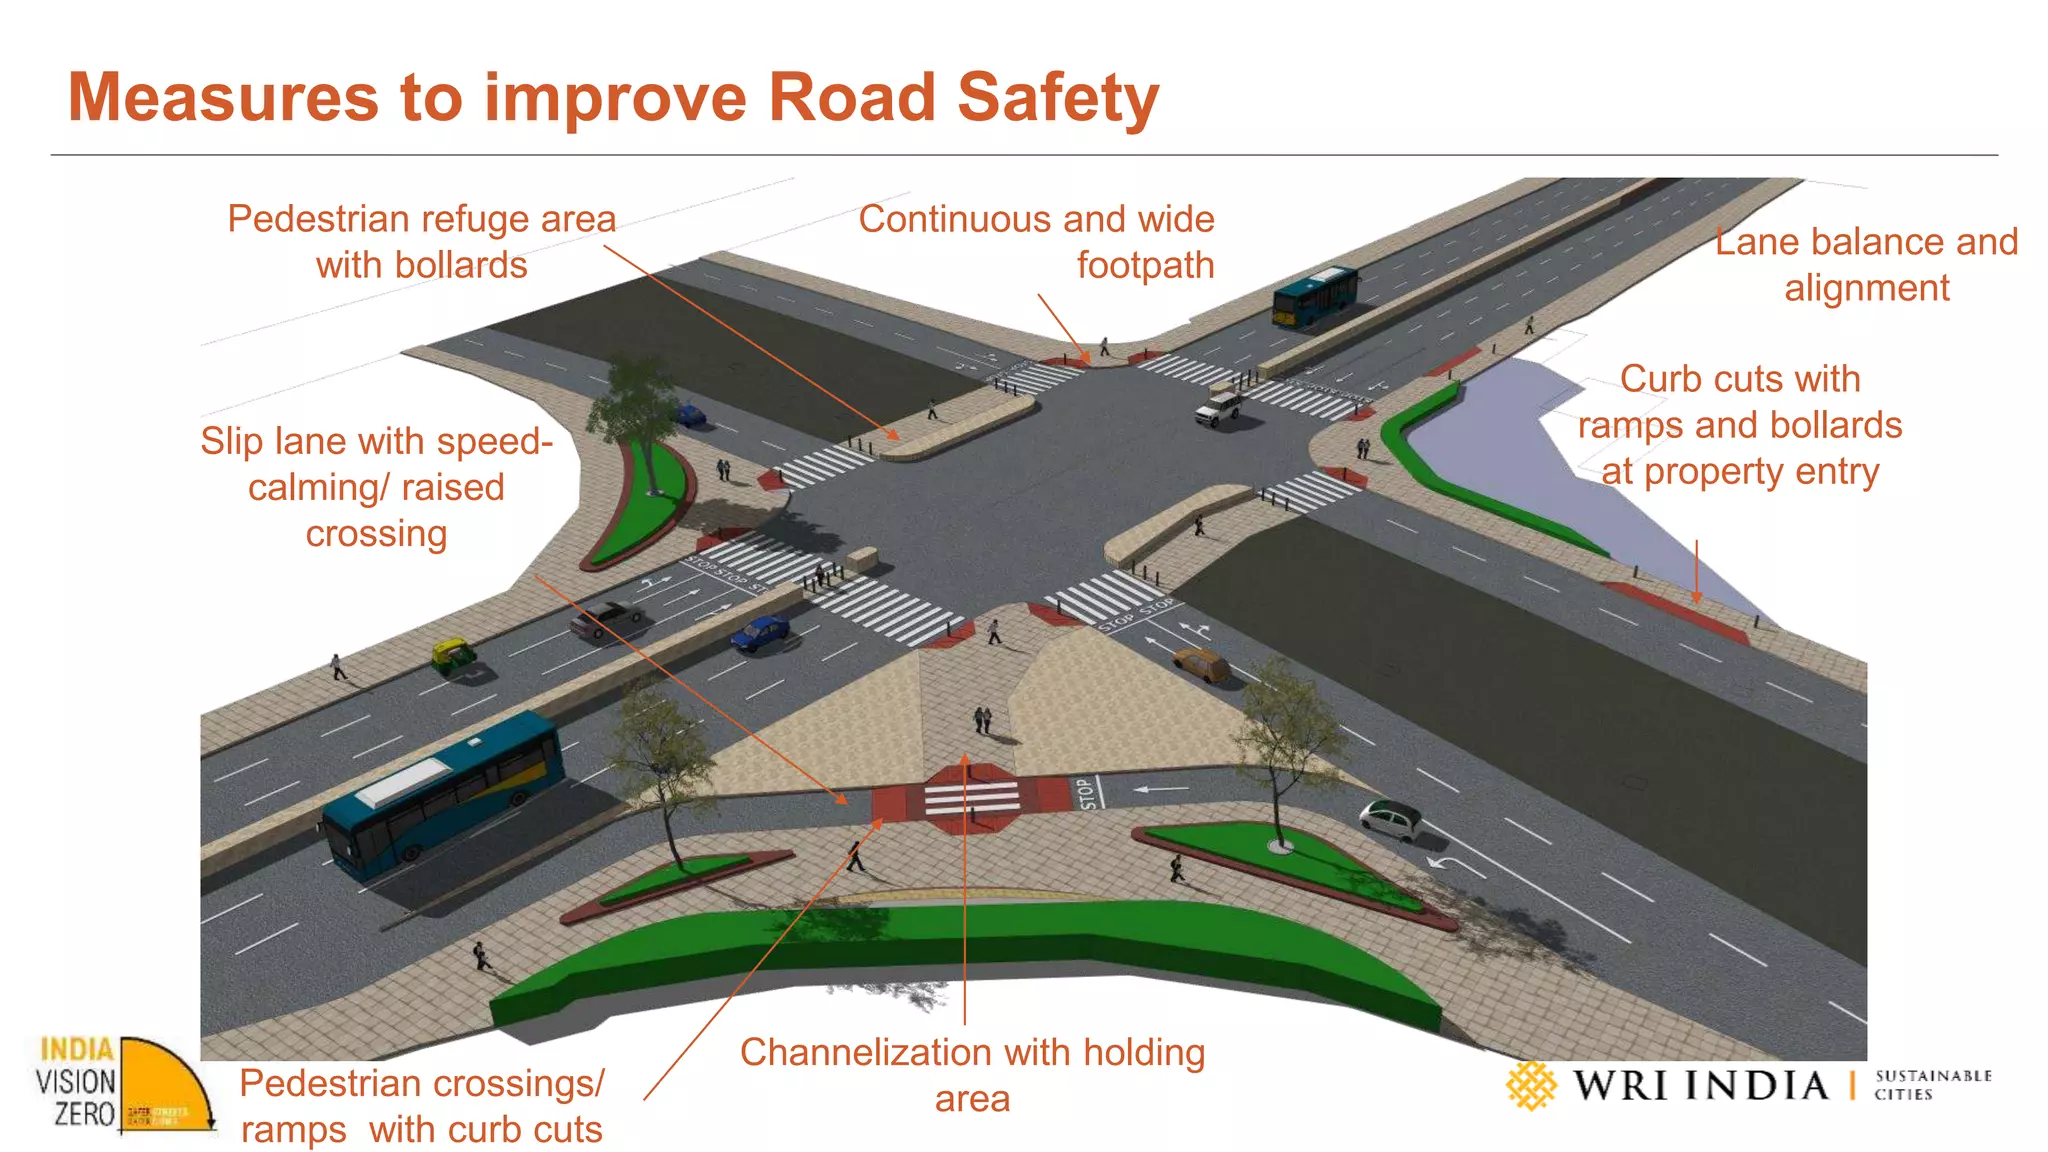
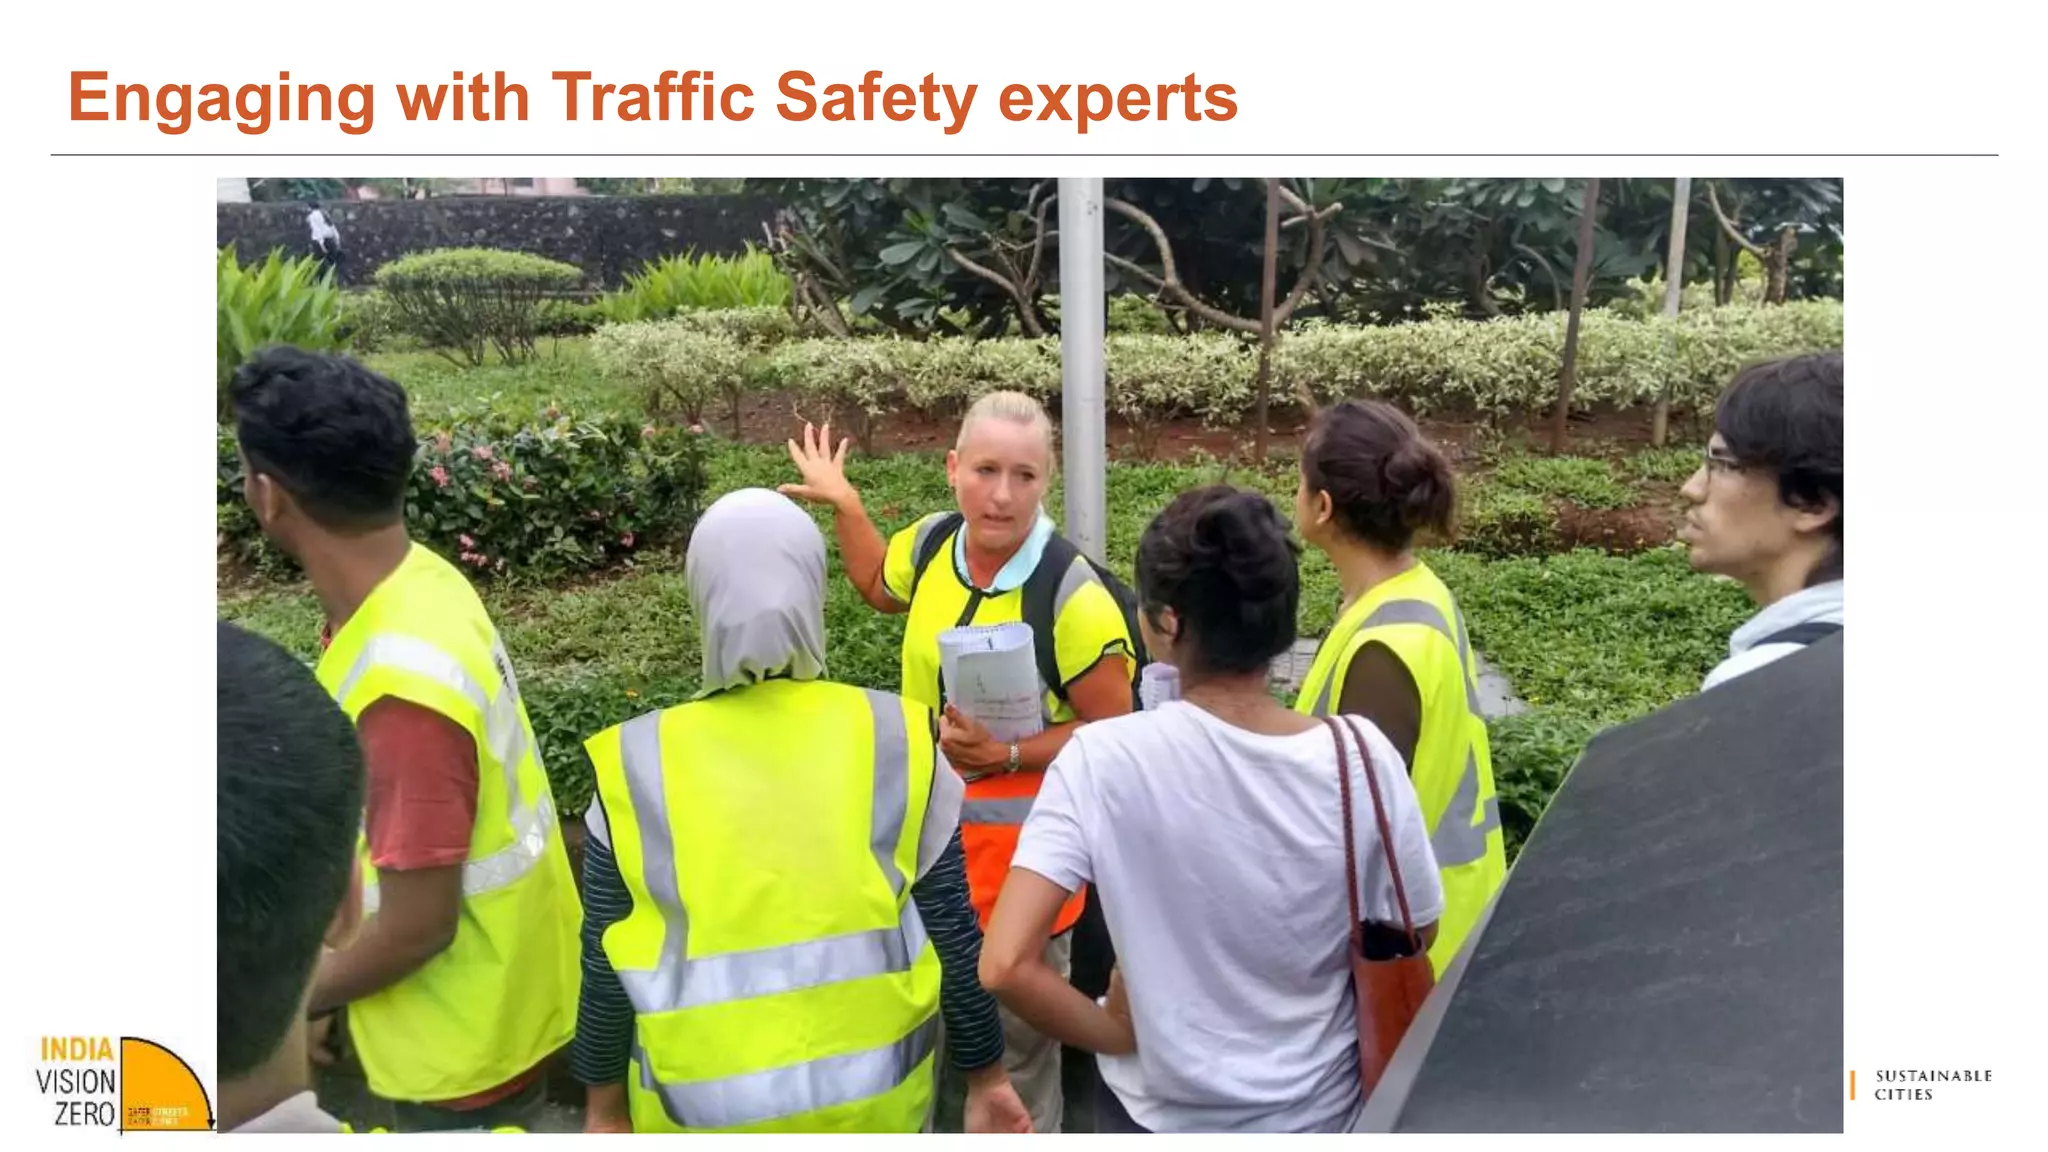
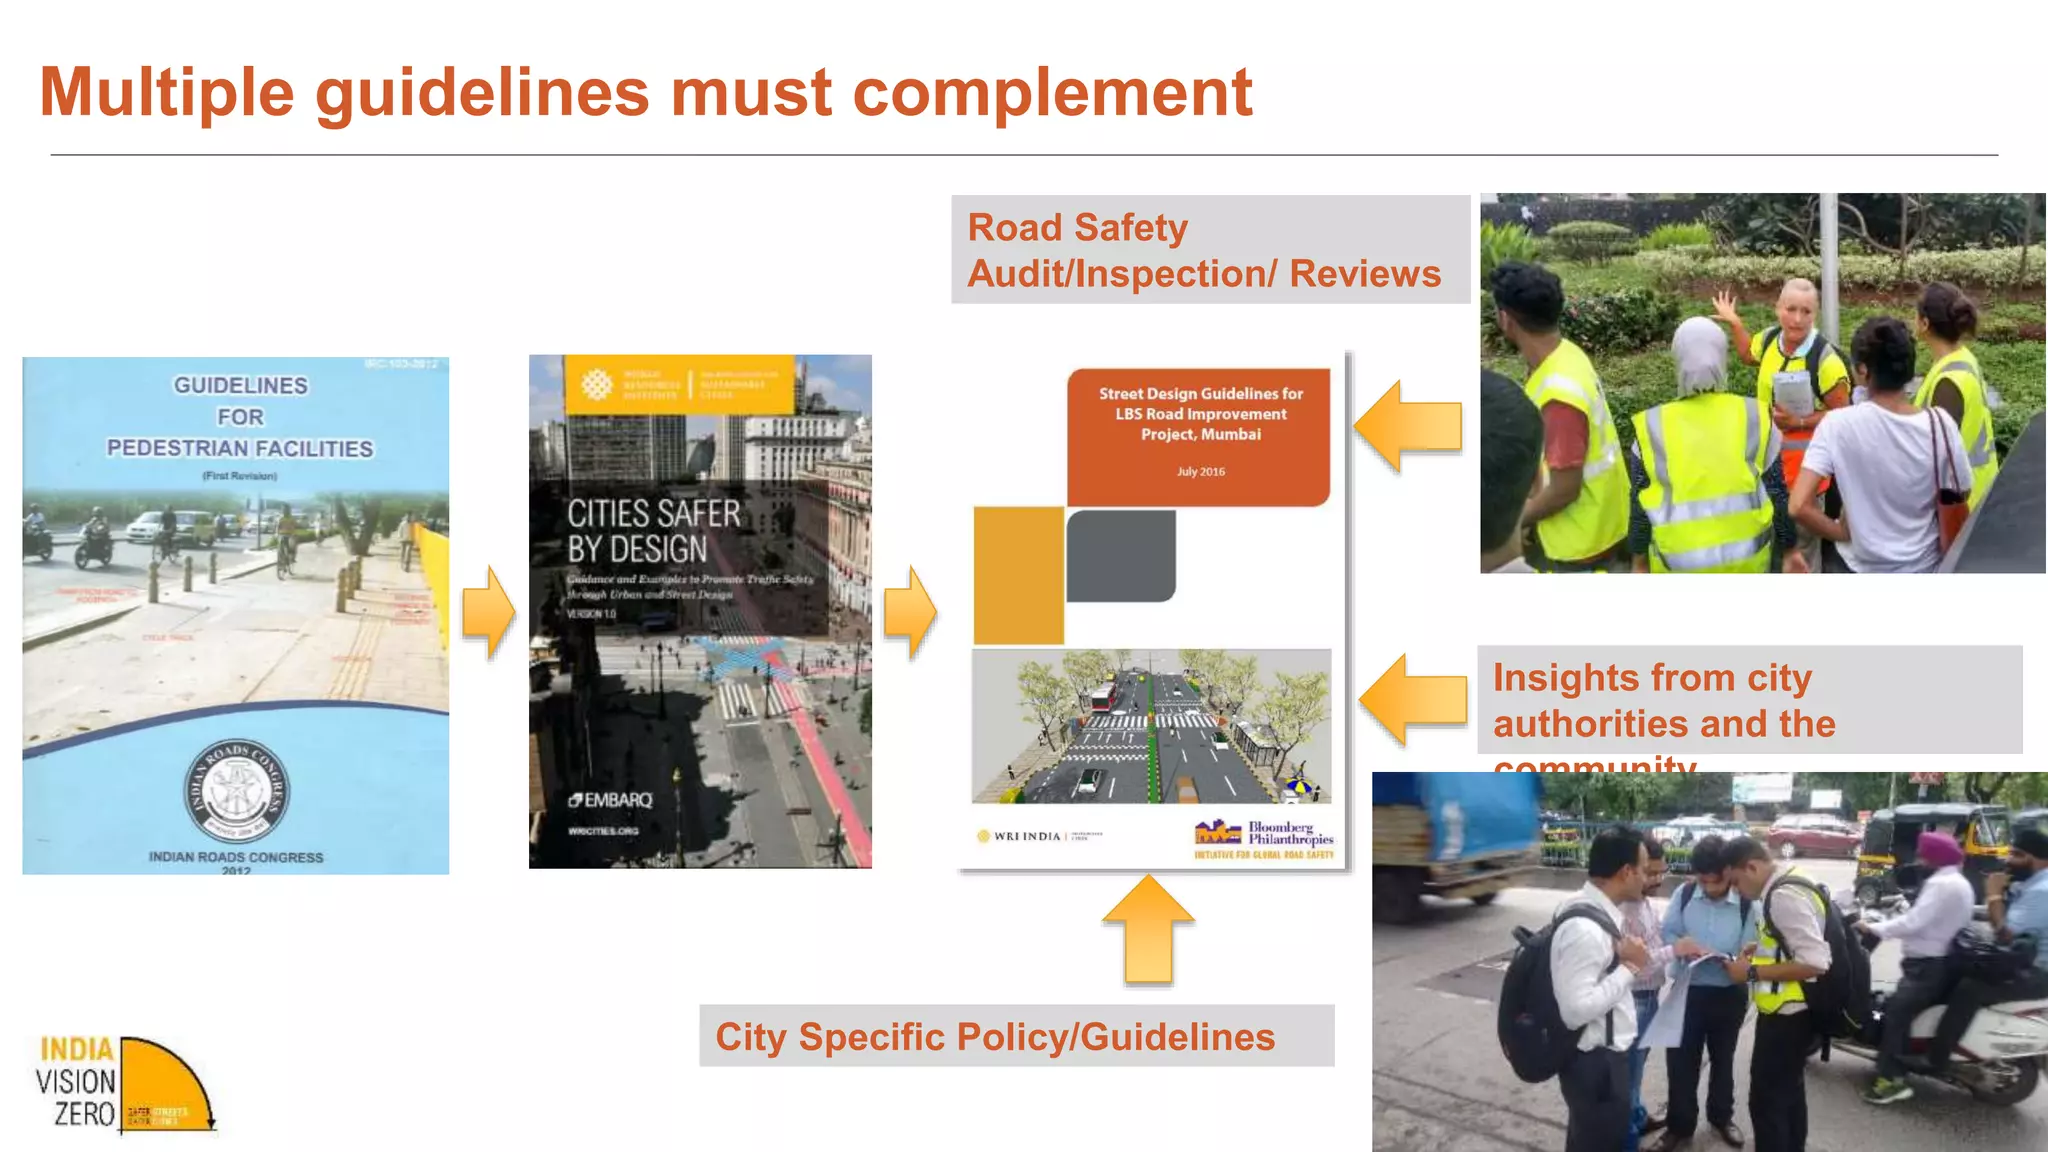
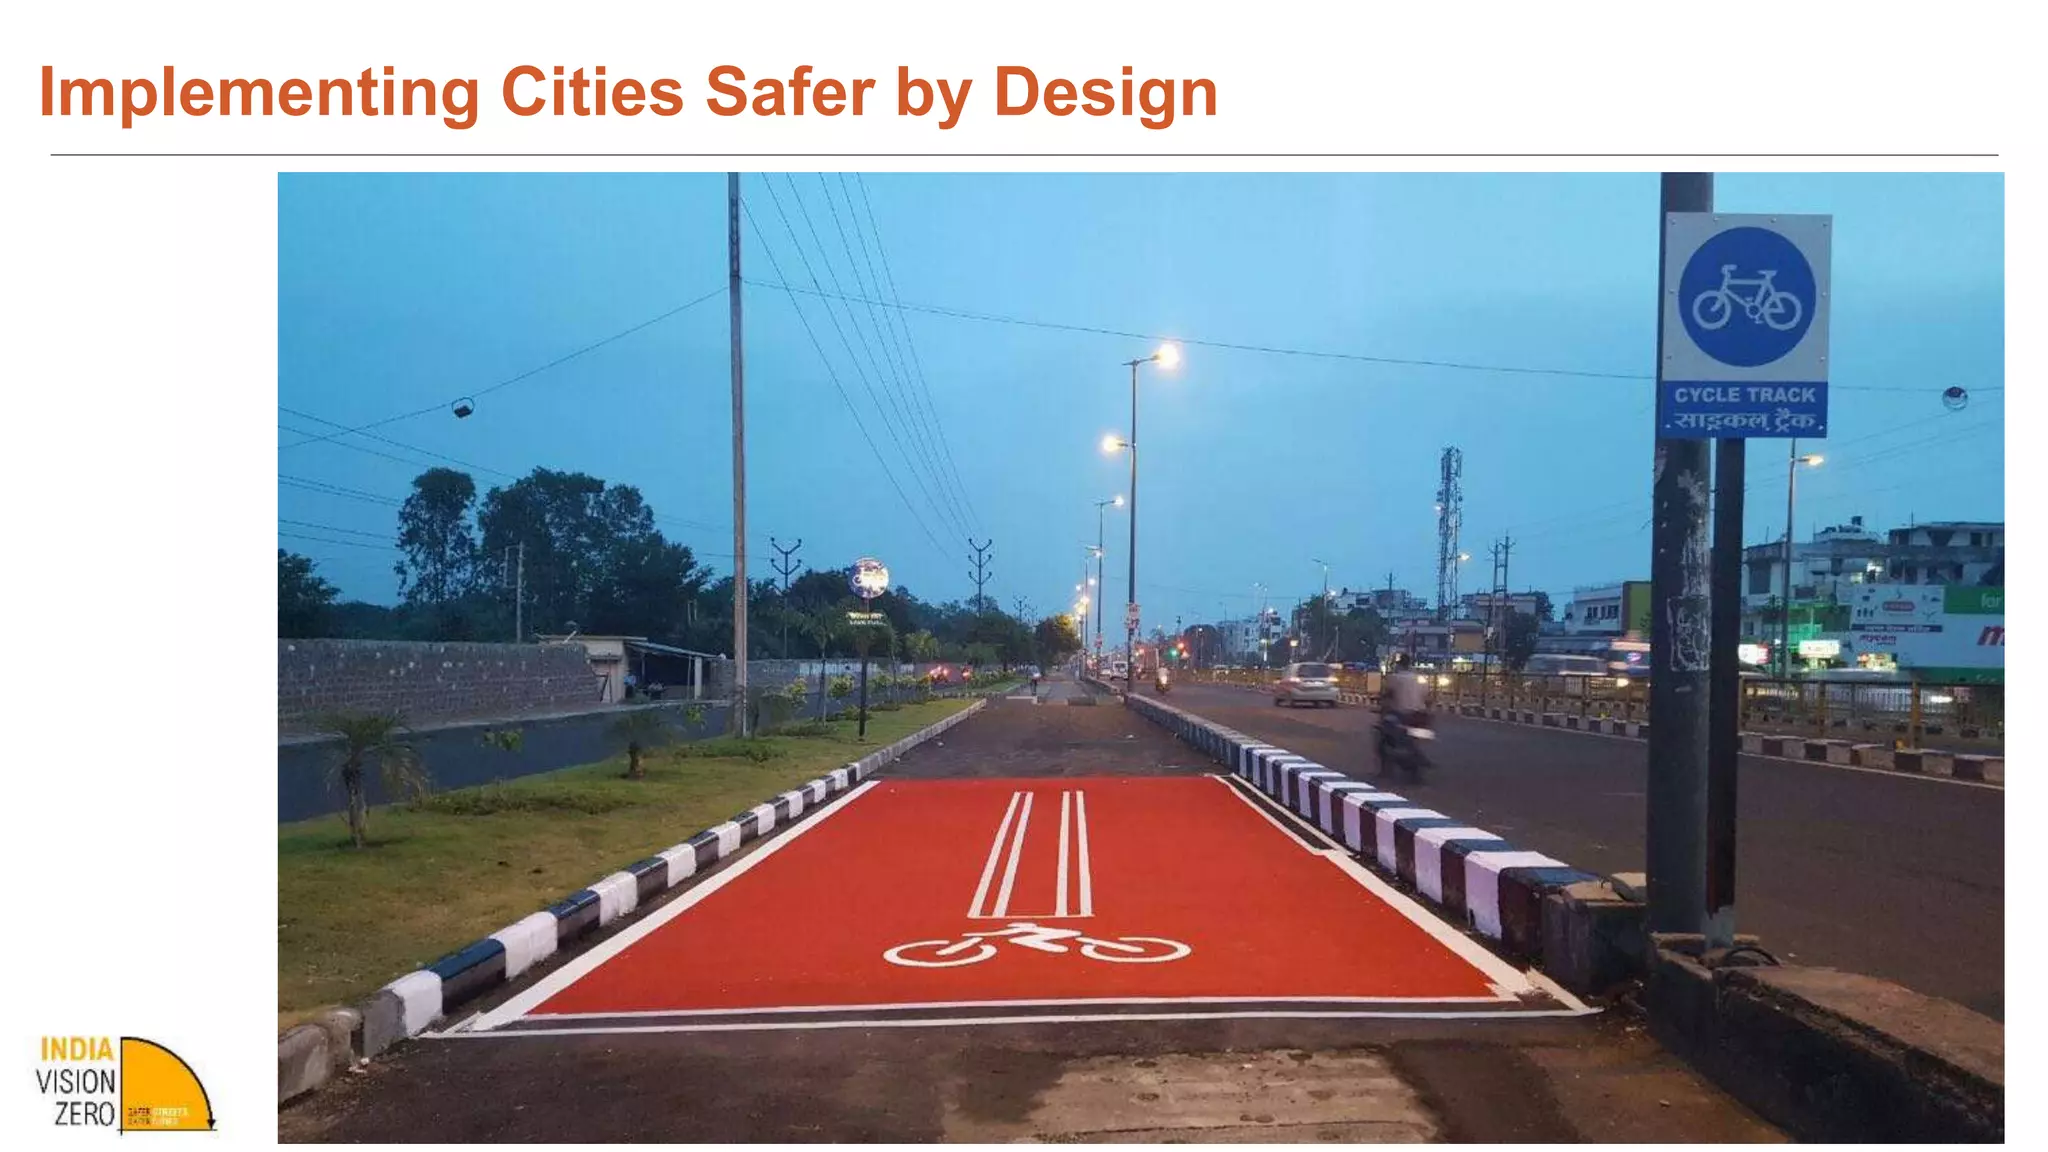
9953330565 Low Rate Call Girls In Adarsh Nagar Delhi NCR
Cities Safer by Design - Guidelines For Safe Road Design for Cities
1. Cities Safer by Design:
Guidelines for safe road design for cities
Bhubaneswar
19th September 2016
Nikhil Chaudhary
Senior Project Associate – Urban Transport & Road Safety
WRI India
2. Reported Traffic Fatality Rates in Selected Global Cities
Reported Traffic Fatality rate per 100,000 population
2. Chennai
4. Jaipur
16. Indore
23. Kolkata
24. Delhi
25. Bangalore
34. Pune
35. Surat
36. Ahmedabad
Source: EMBARQ technical note (Welle and Li 2015)
4. 15
1
5
20
0
Children (<14 yrs) are killed every
day in road accidents in India
People are killed
every
hour in road
accidents
in India
Million people were seriously
Injured or disabled
in road accidents
in India in the past decade
Million
people died in road
accidents in India in
the past decade
3%
Annual GDP loss to India
due to road accidents
Statutes to protect children on the road
Who Is Traffic Safety About?
5. 70
300
120
5
600
Thousand +
two wheeler riders died in the
past decade
Thousand people can be
saved every year with timely
emergency medical care
Thousand + Vulnerable
road users killed in road
accidents in the past decade
Thousand + people died in bus crashes
from just 5 states in India in 2012
Thousand + pedestrians died in
road accidents in the past decade
Who Is Traffic Safety About?
6. Traffic Safety for People First
Traffic Safety Across the Sections of the Society
Youth:
In India, 15-34 years accounted for
53.8% of the total road accident fatalities
(NCRB)
The poor:
People from lower socioeconomic
backgrounds more likely to be involved in
traffic crashes; Often live in areas with low-
quality infrastructure (WHO 2003)
Elderly and the disabled:
Age group of 35-64 years accounts for a
share of 35.7% of road accident fatalities
(NCRB)
Commuters and workers: Most workers
spend anywhere from 30 to 60 minutes or
more traveling to and from work
Customers: Research has shown that
pedestrian and other crashes are associated
with the location of retail land uses
7. Reducing Risk and Exposure: Creating a Safe System for All
Source: Rosen and Sander (2009).
10. Design Principals for Safer Environments
Source: . Dumbaugh and Rae, 2009
Design principles
•Block lengths of 75 to 150 meters
desirable for walkability
•Provide midblock crossings, either
signalized or using raised crossings or
speed humps before crossings
Smaller block sizes aid speed reduction
11. Greater population densities can help
support mass transit and nearby uses
Design Principals for Safer Environments
Complementing population and Density
Compact & connected Urban Design
Design principles
•Density can be used with other
community design elements to
increase walking and cycling and
reduce motorized travel.
.
•Areas around mass transport
stations and corridors can be
targeted, especially those within a
half-kilometer catchment area of
stations.
12. Design Principals for Safer Environments
At commercial locations, transit points should be so located so as to set down and pick up
passengers as close as possible to main destinations.
13. Design Principals for Safer Environments
• Vehicle travel in cities is most strongly related to accessibility to destinations,
meaning that efforts to increase access to jobs, retail and public space can
decrease vehicle travel and improve overall safety.1
Ease of access to destinations
14. Design Principals for Safer Environments
Source: OECD (2009)
Access to Destinations
Design principles
•Neighborhoods should be designed, considering a 0.5-km catchment area for all activities.
•Complement with safe pedestrian and bicycle routes to nearby destinations
•Provide residential densities that support local facilities
15. Measures to improve Road Safety
Indian urban roads are unique in their challenges
Each design element must function in coordination with others
16. Measures to improve Road Safety: Road diet
Lesser lane widths for speed-calming and better capacity
Designing outside-in vs. inside-out
17. Measures to improve Road Safety: Road diet
Lesser lane widths for speed-calming and better capacity
Designing outside-in vs. inside-out
18. Measures to improve Road Safety: Road Diet
‘Grey Zone’ between the roadway and sidewalks are often unused or occupied by
haphazard parking/ vending
19. Retain existing
median
Retain existing CC
lanes
Proposed bus-stop/ taxi-auto stand/ trees/
utilities + Uninterrupted walkway 1.8m
Measures to improve Road Safety
‘Grey Zone’ between the roadway and sidewalks are often unused or occupied by
haphazard parking/ vending
20. Measures to improve Road Safety
2m
Footpath
2.5m
MUZ
10 m
Carriageway
1.5m
M
10 m
Carriageway
2.5m MUZ 2m
Footpath
Speed humps can
reduce accidents by
up to 50%,
Ped. crashes
increase by 6% for
every extra 1 meter
of crossing distance
Lesser lane-widths
and MUZ allows for
continuous clear
walkways
21. Measures to improve Road Safety
Pedestrian refuge area
with bollards
Pedestrian crossings/
ramps with curb cuts
Channelization with holding
area
Slip lane with speed-
calming/ raised
crossing
Continuous and wide
footpath
Lane balance and
alignment
Curb cuts with
ramps and bollards
at property entry
22. Safe access to Public Transit
Median division for
waiting area with
protected refuge
island
Corner kerbs
Minimum turning
radii with well
oriented ramps
Optimised signal
phasing with protected
phase for pedestrians
Wide refuge area with
tapered carriageway
23. Shared streets to create speed-calmed zones
•Enhanced paving, alternating pavers, and street furnishings within the street can be used
with maximum speeds at most around 15 km/h.
38. Multiple guidelines must complement
Road Safety
Audit/Inspection/ Reviews
City Specific Policy/Guidelines
Insights from city
authorities and the
community