SLCPD CompStat no.52 (week ending 12-31-17)
•
0 likes•112 views

SLCPD CompStat for SLC, including D5 on page 7.

Recommended
More Related Content
What's hot
What's hot (20)
Similar to SLCPD CompStat no.52 (week ending 12-31-17)
Similar to SLCPD CompStat no.52 (week ending 12-31-17) (20)
More from ELPCO East Liberty Park Comm. Organization
More from ELPCO East Liberty Park Comm. Organization (20)
Recently uploaded
Recently uploaded (20)
SLCPD CompStat no.52 (week ending 12-31-17)
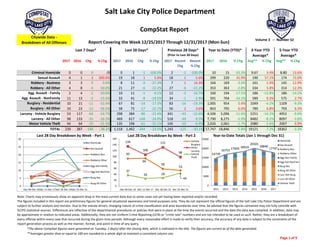
- 1. Salt Lake City Police Department 2017 2016 Chg % Chg 2017 2016 Chg % Chg 2017 Recent Chg Recent % Chg 2017 2016 % Chg Avg** % Chg Avg** % Chg Criminal Homicide 0 0 0 /0 0 1 ‐1 ‐100.0% 2 ‐2 ‐100.0% 10 15 ‐33.3% 9.67 3.4% 8.80 13.6% Sexual Assault 4 1 3 300.0% 19 18 1 5.6% 18 1 5.6% 299 220 35.9% 190 57.1% 174 72.0% Robbery ‐ Business 3 3 0 0.0% 8 11 ‐3 ‐27.3% 7 1 14.3% 164 169 ‐3.0% 161 1.9% 145 12.9% Robbery ‐ All Other 4 8 ‐4 ‐50.0% 21 27 ‐6 ‐22.2% 27 ‐6 ‐22.2% 353 363 ‐2.8% 334 5.8% 314 12.3% Agg. Assault ‐ Family 2 4 ‐2 ‐50.0% 10 11 ‐1 ‐9.1% 12 ‐2 ‐16.7% 160 194 ‐17.5% 186 ‐13.8% 186 ‐14.2% Agg. Assault ‐ NonFamily 11 13 ‐2 ‐15.4% 33 41 ‐8 ‐19.5% 34 ‐1 ‐2.9% 591 704 ‐16.1% 589 0.3% 575 2.7% Burglary ‐ Residential 10 21 ‐11 ‐52.4% 67 81 ‐14 ‐17.3% 83 ‐16 ‐19.3% 1,005 954 5.4% 1049 ‐4.2% 1109 ‐9.3% Burglary ‐ All Other 10 23 ‐13 ‐56.5% 58 75 ‐17 ‐22.7% 56 2 3.6% 843 795 6.0% 789 6.8% 793 6.3% Larceny ‐ Vehicle Burglary 53 117 ‐64 ‐54.7% 298 384 ‐86 ‐22.4% 341 ‐43 ‐12.6% 4,506 5,096 ‐11.6% 5251 ‐14.2% 4952 ‐9.0% Larceny ‐ All Other 98 133 ‐35 ‐26.3% 469 617 ‐148 ‐24.0% 518 ‐49 ‐9.5% 7,790 8,275 ‐5.9% 8482 ‐8.2% 8097 ‐3.8% Motor Vehicle Theft 44 64 ‐20 ‐31.3% 135 196 ‐61 ‐31.1% 145 ‐10 ‐6.9% 2,026 2,061 ‐1.7% 2080 ‐2.6% 2007 0.9% TOTAL 239 387 ‐148 ‐38.2% 1,118 1,462 ‐344 ‐23.5% 1,243 ‐125 ‐10.1% 17,747 18,846 ‐5.8% 19121 ‐7.2% 18362 ‐3.3% Dec 04Dec 11‐Dec 18Dec 25‐Dec 2011 2012 2013 2014 2015 2016 2017 Homicide 0 0 0 0 9 7 8 8 6 15 10 Sex Assault 6 7 2 4 156 159 139 161 190 220 299 Robbery ‐ Business 2 3 0 3 119 99 144 147 167 169 164 Robbery ‐ All Other 5 9 3 4 260 260 310 319 319 363 353 Aggravated Assault ‐ Family 1 4 3 2 157 170 205 162 201 194 160 Aggravated Assault ‐ All Other 6 10 6 11 489 571 537 507 557 704 591 Burglary ‐ Residential 13 20 24 10 1081 1028 1369 1018 1174 954 1005 Burglary ‐ All Other 15 16 17 10 592 848 751 728 845 795 843 Larceny ‐ Vehicle Burglary 93 94 58 53 4157 4730 4280 5054 5602 5096 4506 Larceny ‐ All Other 134 106 131 98 6155 7094 7943 8443 8729 8275 7790 Vehicle Theft 37 26 28 44 1564 1787 2007 1869 2311 2061 2026 TOTALS 312 295 272 239 14739 16753 17693 18416 20101 18846 17747 Year‐to‐Date Totals (Jan 1 through Dec 31) Note: Charts may erroneously show an apparent drop in the most current data due to some cases not yet having been reported and/or recorded. The figures included in this report are preliminary figures for general situational awareness and trend purposes only. They do not represent the official figures of the Salt Lake City Police Department and are subject to further analysis and revision. Due to the statute‐driven, changing nature of crime classification and area boundaries over time, be advised that the figures contained may not fully coincide with SLCPD statistical sources. Differences are reflective of the departmental procedures or policies that were in place at the time the events occurred and the date the data was compiled. In addition, data may be approximate in relation to indicated areas. Additionally, they are not Uniform Crime Reporting (UCR) or "crime rate" numbers and are not intended to be used as such. Rather, they are a breakdown of every offense within every case that occurred during the given time periods. Although every reasonable effort is made to verify their accuracy, the accuracy of any data is subject to the constraints of the report generation process as well as the manner, format, and point in time of any query. *The above CompStat figures were generated on Tuesday, 2 day(s) after the closing date, which is indicated in the title. The figures are current as of the date generated. CompStat Report……. Citywide Data ‐ Breakdown of All Offenses Volume 3 ‐‐ Number 52 Last 7 Days* Last 28 Days* Previous 28 Days* (Prior to Last 28 Days) Year to Date (YTD)* 3‐Year YTD Average* 5‐Year YTD Average* **Averages greater than or equal to 100 are rounded to a whole digit to maintain a consistent column size. Report Covering the Week 12/25/2017 Through 12/31/2017 (Mon‐Sun) 0 5 10 15 20 25 30 Dec 04‐Dec 10Dec 11‐Dec 17Dec 18‐Dec 24Dec 25‐Dec 31 Last 28 Day Breakdown by Week ‐ Part 1 Homicide Sex Assault Robbery‐Bus. Robbery‐Other Agg Aslt‐Family Agg Aslt‐NonFam Burg‐Res Burg‐All Other 14739 16753 17693 18416 20101 18846 17747 0 5000 10000 15000 20000 25000 2011 2012 2013 2014 2015 2016 2017 Year‐to‐Date Totals (Jan 1 through Dec 31) Homicide Sex Assault Robbery‐Bus. Robbery‐Other Agg Aslt‐Family Agg Aslt‐NonFam Burg‐Res Burg‐All Other Larc‐Veh Burg Larc‐All Other Vehicle Theft 93 94 58 53 134 106 131 98 37 26 28 44 0 20 40 60 80 100 120 140 160 Dec 04‐Dec 10 Dec 11‐Dec 17 Dec 18‐Dec 24 Dec 25‐Dec 31 Last 28 Day Breakdown by Week ‐ Part 2 Vehicle Burglary Other Larceny Vehicle Theft Page 1 of 9
- 2. Salt Lake City Police Department 2017 2016 Chg % Chg 2017 2016 Chg % Chg 2017 Recent Chg Recent % Chg 2017 2016 % Chg Avg** % Chg Avg** % Chg Criminal Homicide 0 0 0 /0 0 0 0 /0 0 0 /0 3 1 200.0% 1.33 125.0% 1.20 150.0% Sexual Assault 1 1 0 0.0% 7 3 4 133.3% 5 2 40.0% 57 45 26.7% 42.67 33.6% 33.00 72.7% Robbery ‐ Business 0 0 0 /0 0 1 ‐1 ‐100.0% 0 0 /0 20 22 ‐9.1% 19.67 1.7% 16.80 19.0% Robbery ‐ All Other 0 2 ‐2 ‐100.0% 6 11 ‐5 ‐45.5% 7 ‐1 ‐14.3% 124 142 ‐12.7% 135 ‐7.9% 116 7.1% Agg. Assault ‐ Family 0 0 0 /0 1 0 1 /0 2 ‐1 ‐50.0% 14 11 27.3% 13.67 2.4% 11.60 20.7% Agg. Assault ‐ NonFamily 3 2 1 50.0% 6 11 ‐5 ‐45.5% 7 ‐1 ‐14.3% 171 200 ‐14.5% 179 ‐4.6% 167 2.6% Burglary ‐ Residential 0 1 ‐1 ‐100.0% 1 1 0 0.0% 4 ‐3 ‐75.0% 46 30 53.3% 28.00 64.3% 26.40 74.2% Burglary ‐ All Other 0 1 ‐1 ‐100.0% 4 4 0 0.0% 2 2 100.0% 85 90 ‐5.6% 76.33 11.4% 76.60 11.0% Larceny ‐ Vehicle Burglary 10 16 ‐6 ‐37.5% 40 69 ‐29 ‐42.0% 49 ‐9 ‐18.4% 657 801 ‐18.0% 791 ‐16.9% 840 ‐21.8% Larceny ‐ All Other 13 21 ‐8 ‐38.1% 68 94 ‐26 ‐27.7% 64 4 6.3% 1,244 1,406 ‐11.5% 1395 ‐10.8% 1312 ‐5.2% Motor Vehicle Theft 2 4 ‐2 ‐50.0% 9 12 ‐3 ‐25.0% 14 ‐5 ‐35.7% 181 174 4.0% 183 ‐1.1% 167 8.1% TOTAL 29 48 ‐19 ‐39.6% 142 206 ‐64 ‐31.1% 154 ‐12 ‐7.8% 2,602 2,922 ‐11.0% 2865 ‐9.2% 2767 ‐6.0% Dec 04Dec 11‐Dec 18 Dec 25‐Dec 2011 2012 2013 2014 2015 2016 2017 Homicide 0 0 0 0 3 1 1 3 0 1 3 Sex Assault 3 2 1 1 26 18 19 41 42 45 57 Robbery ‐ Business 0 0 0 0 15 10 15 14 23 22 20 Robbery ‐ All Other 2 2 2 0 63 69 106 121 141 142 124 Aggravated Assault ‐ Family 0 1 0 0 6 9 8 14 16 11 14 Aggravated Assault ‐ All Other 1 1 1 3 134 138 157 160 178 200 171 Burglary ‐ Residential 0 0 1 0 26 28 20 22 32 30 46 Burglary ‐ All Other 0 3 1 0 40 80 74 70 69 90 85 Larceny ‐ Vehicle Burglary 12 10 8 10 804 1054 774 708 864 801 657 Larceny ‐ All Other 25 9 21 13 824 1033 1341 1355 1424 1406 1244 Vehicle Theft 4 1 2 2 147 131 157 156 219 174 181 TOTALS 47 29 37 29 2088 2571 2672 2664 3008 2922 2602 Year‐to‐Date Totals (Jan 1 through Jan 1) Note: Charts may erroneously show an apparent drop in the most current data due to some cases not yet having been reported and/or recorded. The figures included in this report are preliminary figures for general situational awareness and trend purposes only. They do not represent the official figures of the Salt Lake City Police Department and are subject to further analysis and revision. Due to the statute‐driven, changing nature of crime classification and area boundaries over time, be advised that the figures contained may not fully coincide with SLCPD statistical sources. Differences are reflective of the departmental procedures or policies that were in place at the time the events occurred and the date the data was compiled. In addition, data may be approximate in relation to indicated areas. Additionally, they are not Uniform Crime Reporting (UCR) or "crime rate" numbers and are not intended to be used as such. Rather, they are a breakdown of every offense within every case that occurred during the given time periods. Although every reasonable effort is made to verify their accuracy, the accuracy of any data is subject to the constraints of the report generation process as well as the manner, format, and point in time of any query. *The above CompStat figures were generated on Tuesday, 2 day(s) after the closing date, which is indicated in the title. The figures are current as of the date generated. **Averages greater than or equal to 100 are rounded to a whole digit to maintain a consistent column size. ***The Rio Grande District is defined as the area from North Temple to 700 South and State Street to I‐15. However, this area overlaps other districts covered with the SLCPD CompStat Report, namely parts of Districts 3 & 4. As a result, the data contained within the Rio Grande District may also be listed in the data for other areas. CompStat Report……. Rio Grande District*** Breakdown of All Offenses Report Covering the Week 12/25/2017 Through 12/31/2017 (Mon‐Sun) Volume 3 ‐‐ Number 52 Last 7 Days* Last 28 Days* Previous 28 Days* (Prior to Last 28 Days) Year to Date (YTD)* 3‐Year YTD Average* 5‐Year YTD Average* 0 1 2 3 4 Dec 04‐Dec 10 Dec 11‐Dec 17 Dec 18‐Dec 24 Dec 25‐Dec 31 Last 28 Day Breakdown by Week ‐ Part 1 Homicide Sex Assault Robbery‐Bus. Robbery‐Other Agg Aslt‐Family Agg Aslt‐NonFam Burg‐Res Burg‐All Other 2088 2571 2672 2664 3008 2922 2602 0 500 1000 1500 2000 2500 3000 3500 2011 2012 2013 2014 2015 2016 2017 Year‐to‐Date Totals (Jan 1 through Jan 1) Homicide Sex Assault Robbery‐Bus. Robbery‐Other Agg Aslt‐Family Agg Aslt‐NonFam Burg‐Res Burg‐All Other Larc‐Veh Burg Larc‐All Other Vehicle Theft 0 5 10 15 20 25 30 Dec 04‐Dec 10 Dec 11‐Dec 17 Dec 18‐Dec 24 Dec 25‐Dec 31 Last 28 Day Breakdown by Week ‐ Part 2 Vehicle Burglary Other Larceny Vehicle Theft Page 2 of 9
- 3. Salt Lake City Police Department 2017 2016 Chg % Chg 2017 2016 Chg % Chg 2017 Recent Chg Recent % Chg 2017 2016 % Chg Avg** % Chg Avg** % Chg Criminal Homicide 0 0 0 /0 0 0 0 /0 0 0 /0 0 5 ‐100.0% 2.33 ‐100.0% 1.60 ‐100.0% Sexual Assault 0 0 0 /0 3 2 1 50.0% 2 1 50.0% 32 18 77.8% 16.33 95.9% 15.40 107.8% Robbery ‐ Business 0 2 ‐2 ‐100.0% 0 4 ‐4 ‐100.0% 0 0 /0 11 18 ‐38.9% 13.33 ‐17.5% 10.60 3.8% Robbery ‐ All Other 0 1 ‐1 ‐100.0% 2 6 ‐4 ‐66.7% 4 ‐2 ‐50.0% 30 33 ‐9.1% 33.33 ‐10.0% 30.80 ‐2.6% Agg. Assault ‐ Family 0 1 ‐1 ‐100.0% 1 2 ‐1 ‐50.0% 3 ‐2 ‐66.7% 29 49 ‐40.8% 42.33 ‐31.5% 40.60 ‐28.6% Agg. Assault ‐ NonFamily 1 2 ‐1 ‐50.0% 3 5 ‐2 ‐40.0% 6 ‐3 ‐50.0% 59 71 ‐16.9% 60.00 ‐1.7% 64.60 ‐8.7% Burglary ‐ Residential 2 3 ‐1 ‐33.3% 13 15 ‐2 ‐13.3% 8 5 62.5% 117 109 7.3% 137 ‐14.8% 163 ‐28.1% Burglary ‐ All Other 0 2 ‐2 ‐100.0% 4 5 ‐1 ‐20.0% 4 0 0.0% 52 49 6.1% 51.67 0.6% 57.00 ‐8.8% Larceny ‐ Vehicle Burglary 8 10 ‐2 ‐20.0% 17 33 ‐16 ‐48.5% 23 ‐6 ‐26.1% 345 376 ‐8.2% 419 ‐17.7% 393 ‐12.3% Larceny ‐ All Other 7 7 0 0.0% 28 40 ‐12 ‐30.0% 23 5 21.7% 388 452 ‐14.2% 485 ‐20.1% 495 ‐21.6% Motor Vehicle Theft 8 4 4 100.0% 23 26 ‐3 ‐11.5% 21 2 9.5% 277 280 ‐1.1% 306 ‐9.6% 317 ‐12.7% TOTAL 26 32 ‐6 ‐18.8% 94 138 ‐44 ‐31.9% 94 0 0.0% 1,340 1,460 ‐8.2% 1567 ‐14.5% 1589 ‐15.7% Dec 04Dec 11‐Dec 18Dec 25‐Dec 2011 2012 2013 2014 2015 2016 2017 Homicide 0 0 0 0 1 0 1 0 2 5 0 Sex Assault 1 2 0 0 15 14 14 11 20 18 32 Robbery ‐ Business 0 0 0 0 3 4 9 8 14 18 11 Robbery ‐ All Other 1 1 0 0 21 27 27 37 30 33 30 Aggravated Assault ‐ Family 0 0 1 0 39 32 44 33 45 49 29 Aggravated Assault ‐ All Other 1 0 1 1 54 72 71 52 57 71 59 Burglary ‐ Residential 2 4 5 2 126 146 256 142 161 109 117 Burglary ‐ All Other 2 2 0 0 40 57 73 43 63 49 52 Larceny ‐ Vehicle Burglary 3 2 4 8 314 350 359 448 433 376 345 Larceny ‐ All Other 5 10 6 7 497 526 494 479 525 452 388 Vehicle Theft 4 7 4 8 286 297 371 313 326 280 277 TOTALS 19 28 21 26 1396 1525 1719 1566 1676 1460 1340 Year‐to‐Date Totals (Jan 1 through Jan 1) Note: Charts may erroneously show an apparent drop in the most current data due to some cases not yet having been reported and/or recorded. The figures included in this report are preliminary figures for general situational awareness and trend purposes only. They do not represent the official figures of the Salt Lake City Police Department and are subject to further analysis and revision. Due to the statute‐driven, changing nature of crime classification and area boundaries over time, be advised that the figures contained may not fully coincide with SLCPD statistical sources. Differences are reflective of the departmental procedures or policies that were in place at the time the events occurred and the date the data was compiled. In addition, data may be approximate in relation to indicated areas. Additionally, they are not Uniform Crime Reporting (UCR) or "crime rate" numbers and are not intended to be used as such. Rather, they are a breakdown of every offense within every case that occurred during the given time periods. Although every reasonable effort is made to verify their accuracy, the accuracy of any data is subject to the constraints of the report generation process as well as the manner, format, and point in time of any query. CompStat Report……. Council District 1 ‐ Breakdown of All Offenses *The above CompStat figures were generated on Tuesday, 2 day(s) after the closing date, which is indicated in the title. The figures are current as of the date generated. Last 7 Days* Last 28 Days* Previous 28 Days* (Prior to Last 28 Days) Year to Date (YTD)* 3‐Year YTD Average* 5‐Year YTD Average* Volume 3 ‐‐ Number 52 **Averages greater than or equal to 100 are rounded to a whole digit to maintain a consistent column size. Report Covering the Week 12/25/2017 Through 12/31/2017 (Mon‐Sun) 0 1 2 3 4 5 6 Dec 04‐Dec 10Dec 11‐Dec 17Dec 18‐Dec 24Dec 25‐Dec 31 Last 28 Day Breakdown by Week ‐ Part 1 Homicide Sex Assault Robbery‐Bus. Robbery‐Other Agg Aslt‐Family Agg Aslt‐ NonFam Burg‐Res 1396 1525 1719 1566 1676 1460 1340 0 200 400 600 800 1000 1200 1400 1600 1800 2000 2011 2012 2013 2014 2015 2016 2017 Year‐to‐Date Totals (Jan 1 through Jan 1) Homicide Sex Assault Robbery‐Bus. Robbery‐Other Agg Aslt‐Family Agg Aslt‐NonFam Burg‐Res Burg‐All Other Larc‐Veh Burg Larc‐All Other Vehicle Theft 0 2 4 6 8 10 12 Dec 04‐Dec 10 Dec 11‐Dec 17 Dec 18‐Dec 24 Dec 25‐Dec 31 Last 28 Day Breakdown by Week ‐ Part 2 Vehicle Burglary Other Larceny Vehicle Theft Page 3 of 9
- 4. Salt Lake City Police Department 2017 2016 Chg % Chg 2017 2016 Chg % Chg 2017 Recent Chg Recent % Chg 2017 2016 % Chg Avg** % Chg Avg** % Chg Criminal Homicide 0 0 0 /0 0 0 0 /0 2 ‐2 ‐100.0% 2 4 ‐50.0% 3.00 ‐33.3% 2.80 ‐28.6% Sexual Assault 1 0 1 /0 3 1 2 200.0% 1 2 200.0% 38 30 26.7% 24.33 56.2% 22.40 69.6% Robbery ‐ Business 0 0 0 /0 1 2 ‐1 ‐50.0% 2 ‐1 ‐50.0% 29 28 3.6% 28.00 3.6% 26.00 11.5% Robbery ‐ All Other 1 0 1 /0 4 1 3 300.0% 7 ‐3 ‐42.9% 80 51 56.9% 49.33 62.2% 50.00 60.0% Agg. Assault ‐ Family 1 3 ‐2 ‐66.7% 4 4 0 0.0% 2 2 100.0% 51 53 ‐3.8% 49.67 2.7% 48.40 5.4% Agg. Assault ‐ NonFamily 2 3 ‐1 ‐33.3% 6 5 1 20.0% 5 1 20.0% 119 129 ‐7.8% 106 12.6% 95.60 24.5% Burglary ‐ Residential 3 4 ‐1 ‐25.0% 20 17 3 17.6% 12 8 66.7% 157 115 36.5% 137 14.9% 163 ‐3.4% Burglary ‐ All Other 4 6 ‐2 ‐33.3% 19 17 2 11.8% 10 9 90.0% 166 180 ‐7.8% 194 ‐14.6% 184 ‐9.6% Larceny ‐ Vehicle Burglary 5 11 ‐6 ‐54.6% 25 35 ‐10 ‐28.6% 34 ‐9 ‐26.5% 508 623 ‐18.5% 588 ‐13.6% 557 ‐8.7% Larceny ‐ All Other 16 19 ‐3 ‐15.8% 69 81 ‐12 ‐14.8% 96 ‐27 ‐28.1% 1,129 1,141 ‐1.1% 1195 ‐5.5% 1190 ‐5.2% Motor Vehicle Theft 8 19 ‐11 ‐57.9% 27 52 ‐25 ‐48.1% 35 ‐8 ‐22.9% 432 472 ‐8.5% 442 ‐2.3% 430 0.6% TOTAL 41 65 ‐24 ‐36.9% 178 215 ‐37 ‐17.2% 206 ‐28 ‐13.6% 2,711 2,826 ‐4.1% 2816 ‐3.7% 2768 ‐2.1% Dec 04Dec 11‐Dec 18Dec 25‐Dec 2011 2012 2013 2014 2015 2016 2017 Homicide 0 0 0 0 1 4 1 4 1 4 2 Sex Assault 0 2 0 1 19 26 13 22 21 30 38 Robbery ‐ Business 0 1 0 0 26 16 30 25 31 28 29 Robbery ‐ All Other 0 2 1 1 49 49 53 53 44 51 80 Aggravated Assault ‐ Family 1 2 0 1 36 47 46 40 56 53 51 Aggravated Assault ‐ All Other 0 3 1 2 76 91 70 96 92 129 119 Burglary ‐ Residential 4 4 9 3 201 164 239 151 144 115 157 Burglary ‐ All Other 5 3 7 4 187 177 158 171 232 180 166 Larceny ‐ Vehicle Burglary 8 6 6 5 576 465 555 524 616 623 508 Larceny ‐ All Other 21 12 20 16 1315 1163 1204 1240 1204 1141 1129 Vehicle Theft 5 9 5 8 369 403 418 361 494 472 432 TOTALS 44 44 49 41 2855 2605 2787 2687 2935 2826 2711 Year‐to‐Date Totals (Jan 1 through Jan 1) Note: Charts may erroneously show an apparent drop in the most current data due to some cases not yet having been reported and/or recorded. The figures included in this report are preliminary figures for general situational awareness and trend purposes only. They do not represent the official figures of the Salt Lake City Police Department and are subject to further analysis and revision. Due to the statute‐driven, changing nature of crime classification and area boundaries over time, be advised that the figures contained may not fully coincide with SLCPD statistical sources. Differences are reflective of the departmental procedures or policies that were in place at the time the events occurred and the date the data was compiled. In addition, data may be approximate in relation to indicated areas. Additionally, they are not Uniform Crime Reporting (UCR) or "crime rate" numbers and are not intended to be used as such. Rather, they are a breakdown of every offense within every case that occurred during the given time periods. Although every reasonable effort is made to verify their accuracy, the accuracy of any data is subject to the constraints of the report generation process as well as the manner, format, and point in time of any query. CompStat Report……. Council District 2 ‐ Breakdown of All Offenses *The above CompStat figures were generated on Tuesday, 2 day(s) after the closing date, which is indicated in the title. The figures are current as of the date generated. Last 7 Days* Last 28 Days* Previous 28 Days* (Prior to Last 28 Days) Year to Date (YTD)* 3‐Year YTD Average* 5‐Year YTD Average* Volume 3 ‐‐ Number 52 **Averages greater than or equal to 100 are rounded to a whole digit to maintain a consistent column size. Report Covering the Week 12/25/2017 Through 12/31/2017 (Mon‐Sun) 0 1 2 3 4 5 6 7 8 9 10 Dec 04‐Dec 10 Dec 11‐Dec 17 Dec 18‐Dec 24 Dec 25‐Dec 31 Last 28 Day Breakdown by Week ‐ Part 1 Homicide Sex Assault Robbery‐Bus. Robbery‐Other Agg Aslt‐Family Agg Aslt‐ NonFam Burg‐Res 2855 2605 2787 2687 2935 2826 2711 0 500 1000 1500 2000 2500 3000 3500 2011 2012 2013 2014 2015 2016 2017 Year‐to‐Date Totals (Jan 1 through Jan 1) Homicide Sex Assault Robbery‐Bus. Robbery‐Other Agg Aslt‐Family Agg Aslt‐NonFam Burg‐Res Burg‐All Other Larc‐Veh Burg Larc‐All Other Vehicle Theft 0 5 10 15 20 25 Dec 04‐Dec 10 Dec 11‐Dec 17 Dec 18‐Dec 24 Dec 25‐Dec 31 Last 28 Day Breakdown by Week ‐ Part 2 Vehicle Burglary Other Larceny Vehicle Theft Page 4 of 9
- 5. Salt Lake City Police Department 2017 2016 Chg % Chg 2017 2016 Chg % Chg 2017 Recent Chg Recent % Chg 2017 2016 % Chg Avg** % Chg Avg** % Chg Criminal Homicide 0 0 0 /0 0 1 ‐1 ‐100.0% 0 0 /0 0 3 ‐100.0% 1.00 ‐100.0% 0.80 ‐100.0% Sexual Assault 0 0 0 /0 2 2 0 0.0% 0 2 /0 26 15 73.3% 14.67 77.3% 14.80 75.7% Robbery ‐ Business 0 0 0 /0 0 0 0 /0 0 0 /0 8 5 60.0% 5.67 41.2% 5.60 42.9% Robbery ‐ All Other 0 1 ‐1 ‐100.0% 4 1 3 300.0% 0 4 /0 24 18 33.3% 15.67 53.2% 14.40 66.7% Agg. Assault ‐ Family 0 0 0 /0 1 2 ‐1 ‐50.0% 2 ‐1 ‐50.0% 16 24 ‐33.3% 13.67 17.1% 12.80 25.0% Agg. Assault ‐ NonFamily 0 1 ‐1 ‐100.0% 1 4 ‐3 ‐75.0% 3 ‐2 ‐66.7% 45 48 ‐6.3% 35.00 28.6% 31.40 43.3% Burglary ‐ Residential 1 2 ‐1 ‐50.0% 10 8 2 25.0% 10 0 0.0% 162 141 14.9% 156 3.6% 152 6.7% Burglary ‐ All Other 1 7 ‐6 ‐85.7% 4 15 ‐11 ‐73.3% 7 ‐3 ‐42.9% 95 102 ‐6.9% 85.67 10.9% 82.00 15.9% Larceny ‐ Vehicle Burglary 6 19 ‐13 ‐68.4% 50 65 ‐15 ‐23.1% 48 2 4.2% 628 725 ‐13.4% 759 ‐17.2% 661 ‐4.9% Larceny ‐ All Other 3 9 ‐6 ‐66.7% 21 47 ‐26 ‐55.3% 23 ‐2 ‐8.7% 414 450 ‐8.0% 476 ‐13.1% 456 ‐9.3% Motor Vehicle Theft 2 2 0 0.0% 8 7 1 14.3% 8 0 0.0% 215 203 5.9% 201 7.1% 196 9.8% TOTAL 13 41 ‐28 ‐68.3% 101 152 ‐51 ‐33.6% 101 0 0.0% 1,633 1,734 ‐5.8% 1763 ‐7.4% 1626 0.4% Dec 04Dec 11‐Dec 18Dec 25‐Dec 2011 2012 2013 2014 2015 2016 2017 Homicide 0 0 0 0 1 1 0 0 0 3 0 Sex Assault 2 0 0 0 26 16 14 11 18 15 26 Robbery ‐ Business 0 0 0 0 13 6 5 9 3 5 8 Robbery ‐ All Other 2 1 1 0 17 6 19 15 14 18 24 Aggravated Assault ‐ Family 0 0 1 0 10 9 14 8 9 24 16 Aggravated Assault ‐ All Other 0 0 1 0 30 31 21 24 33 48 45 Burglary ‐ Residential 0 5 4 1 146 127 163 148 180 141 162 Burglary ‐ All Other 1 0 2 1 55 68 85 90 65 102 95 Larceny ‐ Vehicle Burglary 20 19 5 6 431 491 536 808 743 725 628 Larceny ‐ All Other 5 6 7 3 408 418 435 509 470 450 414 Vehicle Theft 3 1 2 2 168 193 184 177 222 203 215 TOTALS 33 32 23 13 1305 1366 1476 1799 1757 1734 1633 Year‐to‐Date Totals (Jan 1 through Jan 1) Note: Charts may erroneously show an apparent drop in the most current data due to some cases not yet having been reported and/or recorded. The figures included in this report are preliminary figures for general situational awareness and trend purposes only. They do not represent the official figures of the Salt Lake City Police Department and are subject to further analysis and revision. Due to the statute‐driven, changing nature of crime classification and area boundaries over time, be advised that the figures contained may not fully coincide with SLCPD statistical sources. Differences are reflective of the departmental procedures or policies that were in place at the time the events occurred and the date the data was compiled. In addition, data may be approximate in relation to indicated areas. Additionally, they are not Uniform Crime Reporting (UCR) or "crime rate" numbers and are not intended to be used as such. Rather, they are a breakdown of every offense within every case that occurred during the given time periods. Although every reasonable effort is made to verify their accuracy, the accuracy of any data is subject to the constraints of the report generation process as well as the manner, format, and point in time of any query. CompStat Report……. Council District 3 ‐ Breakdown of All Offenses *The above CompStat figures were generated on Tuesday, 2 day(s) after the closing date, which is indicated in the title. The figures are current as of the date generated. Last 7 Days* Last 28 Days* Previous 28 Days* (Prior to Last 28 Days) Year to Date (YTD)* 3‐Year YTD Average* 5‐Year YTD Average* Volume 3 ‐‐ Number 52 **Averages greater than or equal to 100 are rounded to a whole digit to maintain a consistent column size. Report Covering the Week 12/25/2017 Through 12/31/2017 (Mon‐Sun) 0 1 2 3 4 5 6 Dec 04‐Dec 10Dec 11‐Dec 17Dec 18‐Dec 24Dec 25‐Dec 31 Last 28 Day Breakdown by Week ‐ Part 1 Homicide Sex Assault Robbery‐Bus. Robbery‐Other Agg Aslt‐Family Agg Aslt‐ NonFam Burg‐Res Burg‐All Other 1305 1366 1476 1799 1757 1734 1633 0 200 400 600 800 1000 1200 1400 1600 1800 2000 2011 2012 2013 2014 2015 2016 2017 Year‐to‐Date Totals (Jan 1 through Jan 1) Homicide Sex Assault Robbery‐Bus. Robbery‐Other Agg Aslt‐Family Agg Aslt‐NonFam Burg‐Res Burg‐All Other Larc‐Veh Burg Larc‐All Other Vehicle Theft 0 5 10 15 20 25 Dec 04‐Dec 10 Dec 11‐Dec 17 Dec 18‐Dec 24 Dec 25‐Dec 31 Last 28 Day Breakdown by Week ‐ Part 2 Vehicle Burglary Other Larceny Vehicle Theft Page 5 of 9
- 6. Salt Lake City Police Department 2017 2016 Chg % Chg 2017 2016 Chg % Chg 2017 Recent Chg Recent % Chg 2017 2016 % Chg Avg** % Chg Avg** % Chg Criminal Homicide 0 0 0 /0 0 0 0 /0 0 0 /0 5 2 150.0% 2.00 150.0% 1.60 212.5% Sexual Assault 1 1 0 0.0% 6 7 ‐1 ‐14.3% 9 ‐3 ‐33.3% 113 93 21.5% 77.67 45.5% 65.20 73.3% Robbery ‐ Business 0 1 ‐1 ‐100.0% 2 4 ‐2 ‐50.0% 1 1 100.0% 62 52 19.2% 46.33 33.8% 41.00 51.2% Robbery ‐ All Other 0 2 ‐2 ‐100.0% 7 13 ‐6 ‐46.2% 9 ‐2 ‐22.2% 150 171 ‐12.3% 160 ‐6.4% 144 4.0% Agg. Assault ‐ Family 0 0 0 /0 1 0 1 /0 4 ‐3 ‐75.0% 31 22 40.9% 28.67 8.1% 32.40 ‐4.3% Agg. Assault ‐ NonFamily 5 3 2 66.7% 13 19 ‐6 ‐31.6% 13 0 0.0% 235 286 ‐17.8% 247 ‐5.0% 232 1.3% Burglary ‐ Residential 1 3 ‐2 ‐66.7% 7 10 ‐3 ‐30.0% 16 ‐9 ‐56.3% 188 176 6.8% 172 9.1% 173 8.8% Burglary ‐ All Other 2 2 0 0.0% 13 12 1 8.3% 13 0 0.0% 211 168 25.6% 180 17.0% 189 11.8% Larceny ‐ Vehicle Burglary 15 32 ‐17 ‐53.1% 70 99 ‐29 ‐29.3% 80 ‐10 ‐12.5% 1,284 1,278 0.5% 1433 ‐10.4% 1418 ‐9.4% Larceny ‐ All Other 26 41 ‐15 ‐36.6% 137 189 ‐52 ‐27.5% 132 5 3.8% 2,473 2,643 ‐6.4% 2704 ‐8.5% 2622 ‐5.7% Motor Vehicle Theft 7 13 ‐6 ‐46.2% 23 33 ‐10 ‐30.3% 44 ‐21 ‐47.7% 433 410 5.6% 425 1.8% 386 12.2% TOTAL 57 98 ‐41 ‐41.8% 279 386 ‐107 ‐27.7% 321 ‐42 ‐13.1% 5,185 5,301 ‐2.2% 5478 ‐5.3% 5304 ‐2.2% Dec 04Dec 11‐Dec 18Dec 25‐Dec 2011 2012 2013 2014 2015 2016 2017 Homicide 0 0 0 0 3 1 1 4 0 2 5 Sex Assault 2 2 1 1 50 46 47 67 73 93 113 Robbery ‐ Business 2 0 0 0 31 28 38 36 51 52 62 Robbery ‐ All Other 2 4 1 0 91 109 131 144 166 171 150 Aggravated Assault ‐ Family 0 1 0 0 23 33 43 31 33 22 31 Aggravated Assault ‐ All Other 2 4 2 5 199 207 211 221 235 286 235 Burglary ‐ Residential 2 1 3 1 178 155 192 161 180 176 188 Burglary ‐ All Other 1 5 5 2 110 227 176 178 195 168 211 Larceny ‐ Vehicle Burglary 23 20 12 15 1195 1546 1243 1460 1562 1278 1284 Larceny ‐ All Other 47 29 35 26 1722 2177 2821 2761 2708 2643 2473 Vehicle Theft 10 1 5 7 280 290 364 364 502 410 433 TOTALS 91 67 64 57 3882 4819 5267 5427 5705 5301 5185 Year‐to‐Date Totals (Jan 1 through Jan 1) Note: Charts may erroneously show an apparent drop in the most current data due to some cases not yet having been reported and/or recorded. The figures included in this report are preliminary figures for general situational awareness and trend purposes only. They do not represent the official figures of the Salt Lake City Police Department and are subject to further analysis and revision. Due to the statute‐driven, changing nature of crime classification and area boundaries over time, be advised that the figures contained may not fully coincide with SLCPD statistical sources. Differences are reflective of the departmental procedures or policies that were in place at the time the events occurred and the date the data was compiled. In addition, data may be approximate in relation to indicated areas. Additionally, they are not Uniform Crime Reporting (UCR) or "crime rate" numbers and are not intended to be used as such. Rather, they are a breakdown of every offense within every case that occurred during the given time periods. Although every reasonable effort is made to verify their accuracy, the accuracy of any data is subject to the constraints of the report generation process as well as the manner, format, and point in time of any query. CompStat Report……. Council District 4 ‐ Breakdown of All Offenses *The above CompStat figures were generated on Tuesday, 2 day(s) after the closing date, which is indicated in the title. The figures are current as of the date generated. Last 7 Days* Last 28 Days* Previous 28 Days* (Prior to Last 28 Days) Year to Date (YTD)* 3‐Year YTD Average* 5‐Year YTD Average* Volume 3 ‐‐ Number 52 **Averages greater than or equal to 100 are rounded to a whole digit to maintain a consistent column size. Report Covering the Week 12/25/2017 Through 12/31/2017 (Mon‐Sun) 0 1 2 3 4 5 6 Dec 04‐Dec 10Dec 11‐Dec 17Dec 18‐Dec 24Dec 25‐Dec 31 Last 28 Day Breakdown by Week ‐ Part 1 Homicide Sex Assault Robbery‐Bus. Robbery‐Other Agg Aslt‐Family Agg Aslt‐NonFam Burg‐Res Burg‐All Other 3882 4819 5267 5427 5705 5301 5185 0 1000 2000 3000 4000 5000 6000 2011 2012 2013 2014 2015 2016 2017 Year‐to‐Date Totals (Jan 1 through Jan 1) Homicide Sex Assault Robbery‐Bus. Robbery‐Other Agg Aslt‐Family Agg Aslt‐NonFam Burg‐Res Burg‐All Other Larc‐Veh Burg Larc‐All Other Vehicle Theft0 5 10 15 20 25 30 35 40 45 50 Dec 04‐Dec 10 Dec 11‐Dec 17 Dec 18‐Dec 24 Dec 25‐Dec 31 Last 28 Day Breakdown by Week ‐ Part 2 Vehicle Burglary Other Larceny Vehicle Theft Page 6 of 9
- 7. Salt Lake City Police Department 2017 2016 Chg % Chg 2017 2016 Chg % Chg 2017 Recent Chg Recent % Chg 2017 2016 % Chg Avg** % Chg Avg** % Chg Criminal Homicide 0 0 0 /0 0 0 0 /0 0 0 /0 2 1 100.0% 1.00 100.0% 1.20 66.7% Sexual Assault 1 0 1 /0 3 5 ‐2 ‐40.0% 3 0 0.0% 54 44 22.7% 35.00 54.3% 30.80 75.3% Robbery ‐ Business 1 0 1 /0 2 1 1 100.0% 1 1 100.0% 32 32 0.0% 30.67 4.3% 31.00 3.2% Robbery ‐ All Other 3 2 1 50.0% 4 2 2 100.0% 5 ‐1 ‐20.0% 50 59 ‐15.3% 52.67 ‐5.1% 49.60 0.8% Agg. Assault ‐ Family 1 0 1 /0 1 2 ‐1 ‐50.0% 1 0 0.0% 18 30 ‐40.0% 32.67 ‐44.9% 32.60 ‐44.8% Agg. Assault ‐ NonFamily 2 2 0 0.0% 8 6 2 33.3% 5 3 60.0% 102 124 ‐17.7% 93.00 9.7% 93.00 9.7% Burglary ‐ Residential 1 6 ‐5 ‐83.3% 9 15 ‐6 ‐40.0% 22 ‐13 ‐59.1% 179 201 ‐11.0% 214 ‐16.4% 215 ‐16.9% Burglary ‐ All Other 2 4 ‐2 ‐50.0% 6 13 ‐7 ‐53.8% 11 ‐5 ‐45.5% 157 159 ‐1.3% 137 14.3% 136 15.6% Larceny ‐ Vehicle Burglary 10 16 ‐6 ‐37.5% 55 48 7 14.6% 60 ‐5 ‐8.3% 709 913 ‐22.3% 847 ‐16.3% 765 ‐7.3% Larceny ‐ All Other 29 36 ‐7 ‐19.4% 143 146 ‐3 ‐2.1% 146 ‐3 ‐2.1% 2,001 2,124 ‐5.8% 2175 ‐8.0% 1931 3.6% Motor Vehicle Theft 13 9 4 44.4% 30 39 ‐9 ‐23.1% 23 7 30.4% 348 361 ‐3.6% 352 ‐1.0% 324 7.3% TOTAL 63 75 ‐12 ‐16.0% 261 277 ‐16 ‐5.8% 277 ‐16 ‐5.8% 3,652 4,048 ‐9.8% 3970 ‐8.0% 3610 1.2% Dec 04Dec 11‐Dec 18Dec 25‐Dec 2011 2012 2013 2014 2015 2016 2017 Homicide 0 0 0 0 2 0 3 0 2 1 2 Sex Assault 1 1 0 1 25 27 22 28 33 44 54 Robbery ‐ Business 0 1 0 1 23 29 34 30 30 32 32 Robbery ‐ All Other 0 1 0 3 50 37 53 52 47 59 50 Aggravated Assault ‐ Family 0 0 0 1 34 27 38 37 31 30 18 Aggravated Assault ‐ All Other 3 2 1 2 73 91 95 70 85 124 102 Burglary ‐ Residential 2 5 1 1 203 205 230 197 244 201 179 Burglary ‐ All Other 1 2 1 2 97 136 131 116 137 159 157 Larceny ‐ Vehicle Burglary 19 16 10 10 580 704 581 745 882 913 709 Larceny ‐ All Other 41 34 39 29 1029 1550 1578 2028 2374 2124 2001 Vehicle Theft 8 2 7 13 188 252 315 325 369 361 348 TOTALS 75 64 59 63 2304 3058 3080 3628 4234 4048 3652 Year‐to‐Date Totals (Jan 1 through Jan 1) Note: Charts may erroneously show an apparent drop in the most current data due to some cases not yet having been reported and/or recorded. The figures included in this report are preliminary figures for general situational awareness and trend purposes only. They do not represent the official figures of the Salt Lake City Police Department and are subject to further analysis and revision. Due to the statute‐driven, changing nature of crime classification and area boundaries over time, be advised that the figures contained may not fully coincide with SLCPD statistical sources. Differences are reflective of the departmental procedures or policies that were in place at the time the events occurred and the date the data was compiled. In addition, data may be approximate in relation to indicated areas. Additionally, they are not Uniform Crime Reporting (UCR) or "crime rate" numbers and are not intended to be used as such. Rather, they are a breakdown of every offense within every case that occurred during the given time periods. Although every reasonable effort is made to verify their accuracy, the accuracy of any data is subject to the constraints of the report generation process as well as the manner, format, and point in time of any query. CompStat Report……. Council District 5 ‐ Breakdown of All Offenses *The above CompStat figures were generated on Tuesday, 2 day(s) after the closing date, which is indicated in the title. The figures are current as of the date generated. Last 7 Days* Last 28 Days* Previous 28 Days* (Prior to Last 28 Days) Year to Date (YTD)* 3‐Year YTD Average* 5‐Year YTD Average* Volume 3 ‐‐ Number 52 **Averages greater than or equal to 100 are rounded to a whole digit to maintain a consistent column size. Report Covering the Week 12/25/2017 Through 12/31/2017 (Mon‐Sun) 0 1 2 3 4 5 6 Dec 04‐Dec 10Dec 11‐Dec 17Dec 18‐Dec 24Dec 25‐Dec 31 Last 28 Day Breakdown by Week ‐ Part 1 Homicide Sex Assault Robbery‐Bus. Robbery‐Other Agg Aslt‐Family Agg Aslt‐ NonFam Burg‐Res 2304 3058 3080 3628 4234 4048 3652 0 500 1000 1500 2000 2500 3000 3500 4000 4500 2011 2012 2013 2014 2015 2016 2017 Year‐to‐Date Totals (Jan 1 through Jan 1) Homicide Sex Assault Robbery‐Bus. Robbery‐Other Agg Aslt‐Family Agg Aslt‐NonFam Burg‐Res Burg‐All Other Larc‐Veh Burg Larc‐All Other Vehicle Theft0 5 10 15 20 25 30 35 40 45 Dec 04‐Dec 10 Dec 11‐Dec 17 Dec 18‐Dec 24 Dec 25‐Dec 31 Last 28 Day Breakdown by Week ‐ Part 2 Vehicle Burglary Other Larceny Vehicle Theft Page 7 of 9
- 8. Salt Lake City Police Department 2017 2016 Chg % Chg 2017 2016 Chg % Chg 2017 Recent Chg Recent % Chg 2017 2016 % Chg Avg** % Chg Avg** % Chg Criminal Homicide 0 0 0 /0 0 0 0 /0 0 0 /0 1 0 /0 0.00 /0 0.00 /0 Sexual Assault 0 0 0 /0 0 0 0 /0 1 ‐1 ‐100.0% 5 4 25.0% 6.33 ‐21.1% 6.80 ‐26.5% Robbery ‐ Business 0 0 0 /0 0 0 0 /0 1 ‐1 ‐100.0% 6 4 50.0% 7.33 ‐18.2% 5.80 3.4% Robbery ‐ All Other 0 0 0 /0 0 0 0 /0 0 0 /0 3 2 50.0% 3.00 0.0% 3.80 ‐21.1% Agg. Assault ‐ Family 0 0 0 /0 0 0 0 /0 0 0 /0 5 4 25.0% 3.00 66.7% 2.60 92.3% Agg. Assault ‐ NonFamily 0 0 0 /0 0 0 0 /0 1 ‐1 ‐100.0% 10 4 150.0% 5.00 100.0% 8.60 16.3% Burglary ‐ Residential 0 2 ‐2 ‐100.0% 1 9 ‐8 ‐88.9% 10 ‐9 ‐90.0% 82 87 ‐5.8% 90.00 ‐8.9% 89.40 ‐8.3% Burglary ‐ All Other 0 0 0 /0 4 1 3 300.0% 2 2 100.0% 46 24 91.7% 31.33 46.8% 33.20 38.6% Larceny ‐ Vehicle Burglary 2 6 ‐4 ‐66.7% 25 20 5 25.0% 19 6 31.6% 341 341 0.0% 360 ‐5.4% 350 ‐2.5% Larceny ‐ All Other 1 2 ‐1 ‐50.0% 10 20 ‐10 ‐50.0% 13 ‐3 ‐23.1% 214 204 4.9% 216 ‐1.1% 206 3.9% Motor Vehicle Theft 3 3 0 0.0% 4 7 ‐3 ‐42.9% 6 ‐2 ‐33.3% 71 61 16.4% 80.67 ‐12.0% 84.40 ‐15.9% TOTAL 6 13 ‐7 ‐53.9% 44 57 ‐13 ‐22.8% 53 ‐9 ‐17.0% 784 735 6.7% 803 ‐2.4% 790 ‐0.8% Dec 04Dec 11‐Dec 18Dec 25‐Dec 2011 2012 2013 2014 2015 2016 2017 Homicide 0 0 0 0 0 0 0 0 0 0 1 Sex Assault 0 0 0 0 6 10 5 9 6 4 5 Robbery ‐ Business 0 0 0 0 5 4 3 10 8 4 6 Robbery ‐ All Other 0 0 0 0 7 6 4 2 5 2 3 Aggravated Assault ‐ Family 0 0 0 0 6 2 2 3 2 4 5 Aggravated Assault ‐ All Other 0 0 0 0 7 19 9 4 7 4 10 Burglary ‐ Residential 0 1 0 0 86 77 100 85 98 87 82 Burglary ‐ All Other 2 2 0 0 30 30 42 32 38 24 46 Larceny ‐ Vehicle Burglary 5 10 8 2 423 355 312 319 421 341 341 Larceny ‐ All Other 4 2 3 1 204 206 175 226 219 204 214 Vehicle Theft 0 0 1 3 92 99 81 87 94 61 71 TOTALS 11 15 12 6 866 808 733 777 898 735 784 Year‐to‐Date Totals (Jan 1 through Jan 1) Note: Charts may erroneously show an apparent drop in the most current data due to some cases not yet having been reported and/or recorded. The figures included in this report are preliminary figures for general situational awareness and trend purposes only. They do not represent the official figures of the Salt Lake City Police Department and are subject to further analysis and revision. Due to the statute‐driven, changing nature of crime classification and area boundaries over time, be advised that the figures contained may not fully coincide with SLCPD statistical sources. Differences are reflective of the departmental procedures or policies that were in place at the time the events occurred and the date the data was compiled. In addition, data may be approximate in relation to indicated areas. Additionally, they are not Uniform Crime Reporting (UCR) or "crime rate" numbers and are not intended to be used as such. Rather, they are a breakdown of every offense within every case that occurred during the given time periods. Although every reasonable effort is made to verify their accuracy, the accuracy of any data is subject to the constraints of the report generation process as well as the manner, format, and point in time of any query. CompStat Report……. Council District 6 ‐ Breakdown of All Offenses *The above CompStat figures were generated on Tuesday, 2 day(s) after the closing date, which is indicated in the title. The figures are current as of the date generated. Last 7 Days* Last 28 Days* Previous 28 Days* (Prior to Last 28 Days) Year to Date (YTD)* 3‐Year YTD Average* 5‐Year YTD Average* Volume 3 ‐‐ Number 52 **Averages greater than or equal to 100 are rounded to a whole digit to maintain a consistent column size. Report Covering the Week 12/25/2017 Through 12/31/2017 (Mon‐Sun) 0 1 2 3 Dec 04‐Dec 10Dec 11‐Dec 17Dec 18‐Dec 24Dec 25‐Dec 31 Last 28 Day Breakdown by Week ‐ Part 1 Homicide Sex Assault Robbery‐Bus. Robbery‐Other Agg Aslt‐Family Agg Aslt‐NonFam Burg‐Res Burg‐All Other 866 808 733 777 898 735 784 0 100 200 300 400 500 600 700 800 900 1000 2011 2012 2013 2014 2015 2016 2017 Year‐to‐Date Totals (Jan 1 through Jan 1) Homicide Sex Assault Robbery‐Bus. Robbery‐Other Agg Aslt‐Family Agg Aslt‐NonFam Burg‐Res Burg‐All Other Larc‐Veh Burg Larc‐All Other Vehicle Theft0 2 4 6 8 10 12 Dec 04‐Dec 10 Dec 11‐Dec 17 Dec 18‐Dec 24 Dec 25‐Dec 31 Last 28 Day Breakdown by Week ‐ Part 2 Vehicle Burglary Other Larceny Vehicle Theft Page 8 of 9
- 9. Salt Lake City Police Department 2017 2016 Chg % Chg 2017 2016 Chg % Chg 2017 Recent Chg Recent % Chg 2017 2016 % Chg Avg** % Chg Avg** % Chg Criminal Homicide 0 0 0 /0 0 0 0 /0 0 0 /0 0 0 /0 0.33 ‐100.0% 0.60 ‐100.0% Sexual Assault 0 0 0 /0 0 1 ‐1 ‐100.0% 2 ‐2 ‐100.0% 24 12 100.0% 11.67 105.7% 14.00 71.4% Robbery ‐ Business 1 0 1 /0 2 0 2 /0 2 0 0.0% 14 28 ‐50.0% 28.33 ‐50.6% 23.20 ‐39.7% Robbery ‐ All Other 0 2 ‐2 ‐100.0% 0 3 ‐3 ‐100.0% 1 ‐1 ‐100.0% 13 23 ‐43.5% 15.67 ‐17.0% 16.60 ‐21.7% Agg. Assault ‐ Family 0 0 0 /0 2 1 1 100.0% 0 2 /0 9 11 ‐18.2% 12.67 ‐28.9% 14.60 ‐38.4% Agg. Assault ‐ NonFamily 1 2 ‐1 ‐50.0% 2 2 0 0.0% 1 1 100.0% 16 38 ‐57.9% 36.67 ‐56.4% 39.80 ‐59.8% Burglary ‐ Residential 2 1 1 100.0% 6 6 0 0.0% 4 2 50.0% 116 117 ‐0.9% 135 ‐14.1% 145 ‐20.2% Burglary ‐ All Other 1 2 ‐1 ‐50.0% 8 10 ‐2 ‐20.0% 9 ‐1 ‐11.1% 106 103 2.9% 93.00 14.0% 95.80 10.6% Larceny ‐ Vehicle Burglary 6 20 ‐14 ‐70.0% 50 78 ‐28 ‐35.9% 69 ‐19 ‐27.5% 618 741 ‐16.6% 740 ‐16.4% 679 ‐9.0% Larceny ‐ All Other 12 16 ‐4 ‐25.0% 50 80 ‐30 ‐37.5% 65 ‐15 ‐23.1% 972 1,045 ‐7.0% 1032 ‐5.8% 969 0.3% Motor Vehicle Theft 3 12 ‐9 ‐75.0% 18 25 ‐7 ‐28.0% 5 13 260.0% 184 199 ‐7.5% 204 ‐9.7% 197 ‐6.5% TOTAL 26 55 ‐29 ‐52.7% 138 206 ‐68 ‐33.0% 158 ‐20 ‐12.7% 2,072 2,317 ‐10.6% 2309 ‐10.3% 2195 ‐5.6% Dec 04Dec 11‐Dec 18Dec 25‐Dec 2011 2012 2013 2014 2015 2016 2017 Homicide 0 0 0 0 1 1 1 0 1 0 0 Sex Assault 0 0 0 0 7 17 18 10 13 12 24 Robbery ‐ Business 0 1 0 1 14 7 24 28 29 28 14 Robbery ‐ All Other 0 0 0 0 19 21 15 11 13 23 13 Aggravated Assault ‐ Family 0 1 1 0 8 19 16 8 19 11 9 Aggravated Assault ‐ All Other 0 1 0 1 39 43 46 32 40 38 16 Burglary ‐ Residential 2 0 2 2 131 141 181 127 161 117 116 Burglary ‐ All Other 3 2 2 1 58 132 68 78 98 103 106 Larceny ‐ Vehicle Burglary 13 20 11 6 531 627 551 637 841 741 618 Larceny ‐ All Other 10 11 17 12 754 786 964 1010 1041 1045 972 Vehicle Theft 6 6 3 3 127 166 207 177 235 199 184 TOTALS 34 42 36 26 1689 1960 2091 2118 2491 2317 2072 Year‐to‐Date Totals (Jan 1 through Jan 1) Note: Charts may erroneously show an apparent drop in the most current data due to some cases not yet having been reported and/or recorded. The figures included in this report are preliminary figures for general situational awareness and trend purposes only. They do not represent the official figures of the Salt Lake City Police Department and are subject to further analysis and revision. Due to the statute‐driven, changing nature of crime classification and area boundaries over time, be advised that the figures contained may not fully coincide with SLCPD statistical sources. Differences are reflective of the departmental procedures or policies that were in place at the time the events occurred and the date the data was compiled. In addition, data may be approximate in relation to indicated areas. Additionally, they are not Uniform Crime Reporting (UCR) or "crime rate" numbers and are not intended to be used as such. Rather, they are a breakdown of every offense within every case that occurred during the given time periods. Although every reasonable effort is made to verify their accuracy, the accuracy of any data is subject to the constraints of the report generation process as well as the manner, format, and point in time of any query. *The above CompStat figures were generated on Tuesday, 2 day(s) after the closing date, which is indicated in the title. The figures are current as of the date generated. CompStat Report……. Council District 7 ‐ Breakdown of All Offenses Volume 3 ‐‐ Number 52 Last 7 Days* Last 28 Days* Previous 28 Days* (Prior to Last 28 Days) Year to Date (YTD)* 3‐Year YTD Average* 5‐Year YTD Average* **Averages greater than or equal to 100 are rounded to a whole digit to maintain a consistent column size. Report Covering the Week 12/25/2017 Through 12/31/2017 (Mon‐Sun) 0 1 2 3 4 Dec 04‐Dec 10Dec 11‐Dec 17Dec 18‐Dec 24Dec 25‐Dec 31 Last 28 Day Breakdown by Week ‐ Part 1 Homicide Sex Assault Robbery‐Bus. Robbery‐Other Agg Aslt‐Family Agg Aslt‐NonFam Burg‐Res Burg‐All Other 1689 1960 2091 2118 2491 2317 2072 0 500 1000 1500 2000 2500 3000 2011 2012 2013 2014 2015 2016 2017 Year‐to‐Date Totals (Jan 1 through Jan 1) Homicide Sex Assault Robbery‐Bus. Robbery‐Other Agg Aslt‐Family Agg Aslt‐NonFam Burg‐Res Burg‐All Other Larc‐Veh Burg Larc‐All Other Vehicle Theft0 5 10 15 20 25 Dec 04‐Dec 10 Dec 11‐Dec 17 Dec 18‐Dec 24 Dec 25‐Dec 31 Last 28 Day Breakdown by Week ‐ Part 2 Vehicle Burglary Other Larceny Vehicle Theft Page 9 of 9