SlideShare a Scribd company logo
1 of 9
Download to read offline
Salt Lake City Police Department
 
2017 2016 Chg % Chg 2017 2016 Chg % Chg 2017 Recent 
Chg
Recent
% Chg
2017 2016 % Chg Avg** % Chg Avg** % Chg
Criminal Homicide 0 1 ‐1 ‐100.0% 1 2 ‐1 ‐50.0% 2 ‐1 ‐50.0% 11 14 ‐21.4% 9.00 22.2% 8.00 37.5%
Sexual Assault 4 7 ‐3 ‐42.9% 15 18 ‐3 ‐16.7% 24 ‐9 ‐37.5% 289 216 33.8% 185 56.5% 170 70.4%
Robbery ‐ Business 3 4 ‐1 ‐25.0% 7 10 ‐3 ‐30.0% 5 2 40.0% 161 157 2.5% 153 5.2% 137 17.5%
Robbery ‐ All Other 8 9 ‐1 ‐11.1% 29 28 1 3.6% 22 7 31.8% 345 350 ‐1.4% 323 6.9% 303 13.7%
Agg. Assault ‐ Family 4 3 1 33.3% 13 13 0 0.0% 12 1 8.3% 155 188 ‐17.6% 178 ‐12.9% 179 ‐13.3%
Agg. Assault ‐ NonFamily 9 10 ‐1 ‐10.0% 35 42 ‐7 ‐16.7% 33 2 6.1% 573 679 ‐15.6% 573 ‐0.1% 560 2.3%
Burglary ‐ Residential 19 17 2 11.8% 76 74 2 2.7% 68 8 11.8% 968 917 5.6% 1017 ‐4.8% 1071 ‐9.6%
Burglary ‐ All Other 9 12 ‐3 ‐25.0% 47 74 ‐27 ‐36.5% 63 ‐16 ‐25.4% 805 758 6.2% 754 6.8% 762 5.6%
Larceny ‐ Vehicle Burglary 73 96 ‐23 ‐24.0% 320 361 ‐41 ‐11.4% 357 ‐37 ‐10.4% 4,358 4,896 ‐11.0% 5075 ‐14.1% 4786 ‐9.0%
Larceny ‐ All Other 81 164 ‐83 ‐50.6% 472 619 ‐147 ‐23.7% 519 ‐47 ‐9.1% 7,517 8,020 ‐6.3% 8219 ‐8.5% 7841 ‐4.1%
Motor Vehicle Theft 25 41 ‐16 ‐39.0% 125 170 ‐45 ‐26.5% 164 ‐39 ‐23.8% 1,944 1,953 ‐0.5% 1981 ‐1.9% 1914 1.6%
TOTAL 235 364 ‐129 ‐35.4% 1,140 1,411 ‐271 ‐19.2% 1,269 ‐129 ‐10.2% 17,126 18,148 ‐5.6% 18465 ‐7.3% 17731 ‐3.4%
Nov 20Nov 27 Dec 04Dec 11‐Dec 2011 2012 2013 2014 2015 2016 2017
Homicide 0 1 0 0 8 6 7 7 6 14 11
Sex Assault 2 3 6 4 152 158 136 158 180 216 289
Robbery ‐ Business 1 1 2 3 116 91 135 143 159 157 161
Robbery ‐ All Other 6 10 5 8 256 253 296 309 309 350 345
Aggravated Assault ‐ Family 5 3 1 4 151 164 196 154 192 188 155
Aggravated Assault ‐ All Other 12 8 6 9 478 559 522 500 541 679 573
Burglary ‐ Residential 23 21 13 19 1046 989 1316 987 1146 917 968
Burglary ‐ All Other 13 11 14 9 571 819 730 691 812 758 805
Larceny ‐ Vehicle Burglary 77 86 84 73 3995 4585 4123 4895 5433 4896 4358
Larceny ‐ All Other 123 145 123 81 5934 6848 7702 8176 8461 8020 7517
Vehicle Theft 32 36 32 25 1502 1717 1909 1785 2204 1953 1944
TOTALS 294 325 286 235 14209 16189 17072 17805 19443 18148 17126 Year‐to‐Date Totals (Jan 1 through Dec 17)
Note: Charts may erroneously show an apparent drop in the most current data due to some cases not yet having been reported and/or recorded.
The figures included in this report are preliminary figures for general situational awareness and trend purposes only. They do not represent the official figures of the Salt Lake City Police Department and are 
subject to further analysis and revision. Due to the statute‐driven, changing nature of crime classification and area boundaries over time, be advised that the figures contained may not fully coincide with 
SLCPD statistical sources. Differences are reflective of the departmental procedures or policies that were in place at the time the events occurred and the date the data was compiled. In addition, data may 
be approximate in relation to indicated areas. Additionally, they are not Uniform Crime Reporting (UCR) or "crime rate" numbers and are not intended to be used as such. Rather, they are a breakdown of 
every offense within every case that occurred during the given time periods. Although every reasonable effort is made to verify their accuracy, the accuracy of any data is subject to the constraints of the 
report generation process as well as the manner, format, and point in time of any query.  
*The above CompStat figures were generated on Monday, 1 day(s) after the closing date, which is indicated in the title. The figures are current as of the date generated.
CompStat Report…….
Citywide Data ‐ 
Breakdown of All Offenses
Volume 3   ‐‐  Number 50
Last 7 Days* Last 28 Days* Previous 28 Days*
(Prior to Last 28 Days)
Year to Date (YTD)* 3‐Year YTD
Average*
5‐Year YTD
Average*
**Averages greater than or equal to 100 are rounded to a whole digit to maintain a consistent column size.
Report Covering the Week 12/11/2017 Through 12/17/2017 (Mon‐Sun)
0
5
10
15
20
25
Nov 20‐Nov 26Nov 27‐Dec 03Dec 04‐Dec 10Dec 11‐Dec 17
Last 28 Day Breakdown by Week ‐ Part 1
Homicide
Sex Assault
Robbery‐Bus.
Robbery‐Other
Agg Aslt‐Family
Agg Aslt‐NonFam
Burg‐Res
Burg‐All Other
14209
16189 17072 17805
19443
18148
17126
0
5000
10000
15000
20000
25000
2011 2012 2013 2014 2015 2016 2017
Year‐to‐Date Totals (Jan 1 through Dec 17)
Homicide
Sex Assault
Robbery‐Bus.
Robbery‐Other
Agg Aslt‐Family
Agg Aslt‐NonFam
Burg‐Res
Burg‐All Other
Larc‐Veh Burg
Larc‐All Other
Vehicle Theft
77
86 84
73
123
145
123
81
32 36 32
25
0
20
40
60
80
100
120
140
160
Nov 20‐Nov 26 Nov 27‐Dec 03 Dec 04‐Dec 10 Dec 11‐Dec 17
Last 28 Day Breakdown by Week ‐ Part 2
Vehicle
Burglary
Other
Larceny
Vehicle
Theft
Page 1 of 9 
Salt Lake City Police Department
 
2017 2016 Chg % Chg 2017 2016 Chg % Chg 2017 Recent 
Chg
Recent
% Chg
2017 2016 % Chg Avg** % Chg Avg** % Chg
Criminal Homicide 0 0 0 /0 0 0 0 /0 0 0 /0 3 1 200.0% 1.00 200.0% 1.00 200.0%
Sexual Assault 1 1 0 0.0% 5 2 3 150.0% 6 ‐1 ‐16.7% 54 44 22.7% 42.33 27.6% 32.60 65.6%
Robbery ‐ Business 0 1 ‐1 ‐100.0% 0 1 ‐1 ‐100.0% 0 0 /0 20 20 0.0% 18.67 7.1% 16.20 23.5%
Robbery ‐ All Other 2 4 ‐2 ‐50.0% 8 11 ‐3 ‐27.3% 6 2 33.3% 122 139 ‐12.2% 131 ‐6.9% 113 8.0%
Agg. Assault ‐ Family 1 0 1 /0 2 0 2 /0 1 1 100.0% 14 11 27.3% 13.00 7.7% 11.20 25.0%
Agg. Assault ‐ NonFamily 0 4 ‐4 ‐100.0% 4 12 ‐8 ‐66.7% 7 ‐3 ‐42.9% 166 195 ‐14.9% 175 ‐5.1% 162 2.3%
Burglary ‐ Residential 0 0 0 /0 2 0 2 /0 4 ‐2 ‐50.0% 45 28 60.7% 26.33 70.9% 25.00 80.0%
Burglary ‐ All Other 3 0 3 /0 5 3 2 66.7% 3 2 66.7% 84 87 ‐3.4% 72.67 15.6% 73.60 14.1%
Larceny ‐ Vehicle Burglary 7 17 ‐10 ‐58.8% 36 76 ‐40 ‐52.6% 55 ‐19 ‐34.5% 635 771 ‐17.6% 769 ‐17.4% 821 ‐22.6%
Larceny ‐ All Other 8 21 ‐13 ‐61.9% 68 95 ‐27 ‐28.4% 66 2 3.0% 1,207 1,360 ‐11.3% 1351 ‐10.7% 1270 ‐4.9%
Motor Vehicle Theft 1 3 ‐2 ‐66.7% 10 10 0 0.0% 11 ‐1 ‐9.1% 175 167 4.8% 176 ‐0.4% 160 9.5%
TOTAL 23 51 ‐28 ‐54.9% 140 210 ‐70 ‐33.3% 159 ‐19 ‐11.9% 2,525 2,823 ‐10.6% 2776 ‐9.0% 2685 ‐6.0%
Nov 20Nov 27 Dec 04Dec 11‐Dec 2011 2012 2013 2014 2015 2016 2017
Homicide 0 0 0 0 2 1 1 2 0 1 3
Sex Assault 1 0 3 1 25 18 18 41 42 44 54
Robbery ‐ Business 0 0 0 0 15 10 15 14 22 20 20
Robbery ‐ All Other 2 2 2 2 62 68 104 118 136 139 122
Aggravated Assault ‐ Family 0 1 0 1 6 9 8 13 15 11 14
Aggravated Assault ‐ All Other 3 0 1 0 128 134 152 158 172 195 166
Burglary ‐ Residential 2 0 0 0 24 26 20 21 30 28 45
Burglary ‐ All Other 1 1 0 3 40 78 72 66 65 87 84
Larceny ‐ Vehicle Burglary 13 5 11 7 756 1037 760 684 852 771 635
Larceny ‐ All Other 16 20 24 8 799 997 1299 1311 1382 1360 1207
Vehicle Theft 6 1 2 1 142 124 148 149 211 167 175
TOTALS 44 30 43 23 1999 2502 2597 2577 2927 2823 2525 Year‐to‐Date Totals (Jan 1 through Dec 17)
Note: Charts may erroneously show an apparent drop in the most current data due to some cases not yet having been reported and/or recorded.
The figures included in this report are preliminary figures for general situational awareness and trend purposes only. They do not represent the official figures of the Salt Lake City Police Department and are 
subject to further analysis and revision. Due to the statute‐driven, changing nature of crime classification and area boundaries over time, be advised that the figures contained may not fully coincide with 
SLCPD statistical sources. Differences are reflective of the departmental procedures or policies that were in place at the time the events occurred and the date the data was compiled. In addition, data may 
be approximate in relation to indicated areas. Additionally, they are not Uniform Crime Reporting (UCR) or "crime rate" numbers and are not intended to be used as such. Rather, they are a breakdown of 
every offense within every case that occurred during the given time periods. Although every reasonable effort is made to verify their accuracy, the accuracy of any data is subject to the constraints of the 
report generation process as well as the manner, format, and point in time of any query.  
*The above CompStat figures were generated on Monday, 1 day(s) after the closing date, which is indicated in the title. The figures are current as of the date generated.
**Averages greater than or equal to 100 are rounded to a whole digit to maintain a consistent column size.
***The Rio Grande District is defined as the area from North Temple to 700 South and State Street to I‐15. However, this area overlaps other districts covered with the SLCPD CompStat Report, namely 
parts of Districts 3 & 4. As a result, the data contained within the Rio Grande District may also be listed in the data for other areas.
CompStat Report…….
Rio Grande District***
Breakdown of All Offenses Report Covering the Week 12/11/2017 Through 12/17/2017 (Mon‐Sun)
Volume 3   ‐‐  Number 50
Last 7 Days* Last 28 Days* Previous 28 Days*
(Prior to Last 28 Days)
Year to Date (YTD)* 3‐Year YTD
Average*
5‐Year YTD
Average*
0
1
2
3
4
Nov 20‐Nov 26Nov 27‐Dec 03Dec 04‐Dec 10Dec 11‐Dec 17
Last 28 Day Breakdown by Week ‐ Part 1
Homicide
Sex Assault
Robbery‐Bus.
Robbery‐Other
Agg Aslt‐Family
Agg Aslt‐NonFam
Burg‐Res
Burg‐All Other
1999
2502 2597 2577
2927 2823
2525
0
500
1000
1500
2000
2500
3000
3500
2011 2012 2013 2014 2015 2016 2017
Year‐to‐Date Totals (Jan 1 through Dec 17)
Homicide
Sex Assault
Robbery‐Bus.
Robbery‐Other
Agg Aslt‐Family
Agg Aslt‐NonFam
Burg‐Res
Burg‐All Other
Larc‐Veh Burg
Larc‐All Other
Vehicle Theft
0
5
10
15
20
25
30
Nov 20‐Nov 26 Nov 27‐Dec 03 Dec 04‐Dec 10 Dec 11‐Dec 17
Last 28 Day Breakdown by Week ‐ Part 2
Vehicle
Burglary
Other
Larceny
Vehicle
Theft
Page 2 of 9 
Salt Lake City Police Department
 
2017 2016 Chg % Chg 2017 2016 Chg % Chg 2017 Recent 
Chg
Recent
% Chg
2017 2016 % Chg Avg** % Chg Avg** % Chg
Criminal Homicide 0 0 0 /0 0 1 ‐1 ‐100.0% 0 0 /0 0 5 ‐100.0% 2.33 ‐100.0% 1.60 ‐100.0%
Sexual Assault 1 0 1 /0 4 2 2 100.0% 0 4 /0 31 17 82.4% 15.67 97.9% 15.00 106.7%
Robbery ‐ Business 0 1 ‐1 ‐100.0% 0 2 ‐2 ‐100.0% 0 0 /0 11 14 ‐21.4% 12.00 ‐8.3% 9.40 17.0%
Robbery ‐ All Other 1 1 0 0.0% 5 6 ‐1 ‐16.7% 2 3 150.0% 30 32 ‐6.3% 32.33 ‐7.2% 29.40 2.0%
Agg. Assault ‐ Family 0 0 0 /0 1 3 ‐2 ‐66.7% 2 ‐1 ‐50.0% 28 48 ‐41.7% 40.33 ‐30.6% 38.80 ‐27.8%
Agg. Assault ‐ NonFamily 0 1 ‐1 ‐100.0% 5 4 1 25.0% 4 1 25.0% 57 69 ‐17.4% 58.67 ‐2.8% 63.80 ‐10.7%
Burglary ‐ Residential 4 3 1 33.3% 8 16 ‐8 ‐50.0% 10 ‐2 ‐20.0% 110 104 5.8% 133 ‐17.3% 157 ‐29.8%
Burglary ‐ All Other 1 1 0 0.0% 5 6 ‐1 ‐16.7% 5 0 0.0% 51 47 8.5% 50.67 0.7% 55.40 ‐7.9%
Larceny ‐ Vehicle Burglary 2 9 ‐7 ‐77.8% 12 25 ‐13 ‐52.0% 26 ‐14 ‐53.8% 332 362 ‐8.3% 404 ‐17.9% 377 ‐12.0%
Larceny ‐ All Other 5 8 ‐3 ‐37.5% 26 37 ‐11 ‐29.7% 16 10 62.5% 370 444 ‐16.7% 474 ‐21.9% 483 ‐23.5%
Motor Vehicle Theft 6 5 1 20.0% 18 27 ‐9 ‐33.3% 32 ‐14 ‐43.8% 264 272 ‐2.9% 292 ‐9.7% 302 ‐12.7%
TOTAL 20 29 ‐9 ‐31.0% 84 129 ‐45 ‐34.9% 97 ‐13 ‐13.4% 1,284 1,414 ‐9.2% 1515 ‐15.3% 1533 ‐16.3%
Nov 20Nov 27 Dec 04Dec 11‐Dec 2011 2012 2013 2014 2015 2016 2017
Homicide 0 0 0 0 1 0 1 0 2 5 0
Sex Assault 1 1 1 1 15 14 14 11 19 17 31
Robbery ‐ Business 0 0 0 0 3 4 7 8 14 14 11
Robbery ‐ All Other 1 2 1 1 21 26 24 36 29 32 30
Aggravated Assault ‐ Family 1 0 0 0 38 31 42 30 43 48 28
Aggravated Assault ‐ All Other 2 2 1 0 54 72 71 51 56 69 57
Burglary ‐ Residential 0 2 2 4 122 142 243 139 156 104 110
Burglary ‐ All Other 1 1 2 1 39 55 70 42 63 47 51
Larceny ‐ Vehicle Burglary 4 4 2 2 301 334 339 431 420 362 332
Larceny ‐ All Other 9 7 5 5 483 513 483 470 507 444 370
Vehicle Theft 3 5 4 6 273 277 358 300 305 272 264
TOTALS 22 24 18 20 1350 1468 1652 1518 1614 1414 1284 Year‐to‐Date Totals (Jan 1 through Dec 17)
Note: Charts may erroneously show an apparent drop in the most current data due to some cases not yet having been reported and/or recorded.
The figures included in this report are preliminary figures for general situational awareness and trend purposes only. They do not represent the official figures of the Salt Lake City Police Department and are 
subject to further analysis and revision. Due to the statute‐driven, changing nature of crime classification and area boundaries over time, be advised that the figures contained may not fully coincide with 
SLCPD statistical sources. Differences are reflective of the departmental procedures or policies that were in place at the time the events occurred and the date the data was compiled. In addition, data may 
be approximate in relation to indicated areas. Additionally, they are not Uniform Crime Reporting (UCR) or "crime rate" numbers and are not intended to be used as such. Rather, they are a breakdown of 
every offense within every case that occurred during the given time periods. Although every reasonable effort is made to verify their accuracy, the accuracy of any data is subject to the constraints of the 
report generation process as well as the manner, format, and point in time of any query.  
CompStat Report…….
Council District 1 ‐ 
Breakdown of All Offenses
*The above CompStat figures were generated on Monday, 1 day(s) after the closing date, which is indicated in the title. The figures are current as of the date generated.
Last 7 Days* Last 28 Days* Previous 28 Days*
(Prior to Last 28 Days)
Year to Date (YTD)* 3‐Year YTD
Average*
5‐Year YTD
Average*
Volume 3   ‐‐  Number 50
**Averages greater than or equal to 100 are rounded to a whole digit to maintain a consistent column size.
Report Covering the Week 12/11/2017 Through 12/17/2017 (Mon‐Sun)
0
1
2
3
4
5
Nov 20‐Nov 26Nov 27‐Dec 03Dec 04‐Dec 10Dec 11‐Dec 17
Last 28 Day Breakdown by Week ‐ Part 1
Homicide
Sex Assault
Robbery‐Bus.
Robbery‐Other
Agg Aslt‐Family
Agg Aslt‐NonFam
Burg‐Res
Burg‐All Other
1350
1468
1652
1518 1614
1414
1284
0
200
400
600
800
1000
1200
1400
1600
1800
2011 2012 2013 2014 2015 2016 2017
Year‐to‐Date Totals (Jan 1 through Dec 17)
Homicide
Sex Assault
Robbery‐Bus.
Robbery‐Other
Agg Aslt‐Family
Agg Aslt‐NonFam
Burg‐Res
Burg‐All Other
Larc‐Veh Burg
Larc‐All Other
Vehicle Theft
0
1
2
3
4
5
6
7
8
9
10
Nov 20‐Nov 26 Nov 27‐Dec 03 Dec 04‐Dec 10 Dec 11‐Dec 17
Last 28 Day Breakdown by Week ‐ Part 2
Vehicle
Burglary
Other
Larceny
Vehicle
Theft
Page 3 of 9 
Salt Lake City Police Department
 
2017 2016 Chg % Chg 2017 2016 Chg % Chg 2017 Recent 
Chg
Recent
% Chg
2017 2016 % Chg Avg** % Chg Avg** % Chg
Criminal Homicide 0 0 0 /0 1 0 1 /0 2 ‐1 ‐50.0% 3 4 ‐25.0% 3.00 0.0% 2.60 15.4%
Sexual Assault 1 1 0 0.0% 2 1 1 100.0% 1 1 100.0% 36 30 20.0% 23.33 54.3% 21.80 65.1%
Robbery ‐ Business 1 1 0 0.0% 1 2 ‐1 ‐50.0% 2 ‐1 ‐50.0% 29 25 16.0% 26.67 8.7% 24.80 16.9%
Robbery ‐ All Other 1 1 0 0.0% 4 1 3 300.0% 8 ‐4 ‐50.0% 77 50 54.0% 48.33 59.3% 48.40 59.1%
Agg. Assault ‐ Family 2 1 1 100.0% 5 2 3 150.0% 3 2 66.7% 50 49 2.0% 47.33 5.6% 46.20 8.2%
Agg. Assault ‐ NonFamily 3 0 3 /0 5 4 1 25.0% 6 ‐1 ‐16.7% 116 125 ‐7.2% 104 11.9% 93.80 23.7%
Burglary ‐ Residential 4 3 1 33.3% 12 14 ‐2 ‐14.3% 11 1 9.1% 145 108 34.3% 131 10.4% 154 ‐6.0%
Burglary ‐ All Other 0 4 ‐4 ‐100.0% 12 18 ‐6 ‐33.3% 8 4 50.0% 152 171 ‐11.1% 185 ‐18.0% 176 ‐13.7%
Larceny ‐ Vehicle Burglary 5 8 ‐3 ‐37.5% 30 37 ‐7 ‐18.9% 44 ‐14 ‐31.8% 493 605 ‐18.5% 565 ‐12.8% 536 ‐8.0%
Larceny ‐ All Other 10 30 ‐20 ‐66.7% 73 81 ‐8 ‐9.9% 96 ‐23 ‐24.0% 1,088 1,103 ‐1.4% 1162 ‐6.4% 1156 ‐5.8%
Motor Vehicle Theft 9 9 0 0.0% 24 44 ‐20 ‐45.5% 41 ‐17 ‐41.5% 418 440 ‐5.0% 417 0.2% 409 2.3%
TOTAL 36 58 ‐22 ‐37.9% 169 204 ‐35 ‐17.2% 222 ‐53 ‐23.9% 2,607 2,710 ‐3.8% 2714 ‐3.9% 2668 ‐2.3%
Nov 20Nov 27 Dec 04Dec 11‐Dec 2011 2012 2013 2014 2015 2016 2017
Homicide 0 1 0 0 1 3 1 4 1 4 3
Sex Assault 0 1 0 1 18 26 13 20 20 30 36
Robbery ‐ Business 0 0 0 1 26 16 28 25 30 25 29
Robbery ‐ All Other 1 2 0 1 48 47 50 51 44 50 77
Aggravated Assault ‐ Family 0 2 1 2 34 46 43 38 55 49 50
Aggravated Assault ‐ All Other 2 0 0 3 76 90 68 96 90 125 116
Burglary ‐ Residential 2 2 4 4 199 152 225 145 141 108 145
Burglary ‐ All Other 5 2 5 0 179 172 153 163 222 171 152
Larceny ‐ Vehicle Burglary 8 9 8 5 549 452 531 509 582 605 493
Larceny ‐ All Other 20 25 18 10 1272 1130 1162 1202 1181 1103 1088
Vehicle Theft 3 8 4 9 351 393 399 351 461 440 418
TOTALS 41 52 40 36 2753 2527 2673 2604 2827 2710 2607 Year‐to‐Date Totals (Jan 1 through Dec 17)
Note: Charts may erroneously show an apparent drop in the most current data due to some cases not yet having been reported and/or recorded.
The figures included in this report are preliminary figures for general situational awareness and trend purposes only. They do not represent the official figures of the Salt Lake City Police Department and are 
subject to further analysis and revision. Due to the statute‐driven, changing nature of crime classification and area boundaries over time, be advised that the figures contained may not fully coincide with 
SLCPD statistical sources. Differences are reflective of the departmental procedures or policies that were in place at the time the events occurred and the date the data was compiled. In addition, data may 
be approximate in relation to indicated areas. Additionally, they are not Uniform Crime Reporting (UCR) or "crime rate" numbers and are not intended to be used as such. Rather, they are a breakdown of 
every offense within every case that occurred during the given time periods. Although every reasonable effort is made to verify their accuracy, the accuracy of any data is subject to the constraints of the 
report generation process as well as the manner, format, and point in time of any query.  
CompStat Report…….
Council District 2 ‐ 
Breakdown of All Offenses
*The above CompStat figures were generated on Monday, 1 day(s) after the closing date, which is indicated in the title. The figures are current as of the date generated.
Last 7 Days* Last 28 Days* Previous 28 Days*
(Prior to Last 28 Days)
Year to Date (YTD)* 3‐Year YTD
Average*
5‐Year YTD
Average*
Volume 3   ‐‐  Number 50
**Averages greater than or equal to 100 are rounded to a whole digit to maintain a consistent column size.
Report Covering the Week 12/11/2017 Through 12/17/2017 (Mon‐Sun)
0
1
2
3
4
5
6
Nov 20‐Nov 26Nov 27‐Dec 03Dec 04‐Dec 10Dec 11‐Dec 17
Last 28 Day Breakdown by Week ‐ Part 1
Homicide
Sex Assault
Robbery‐Bus.
Robbery‐Other
Agg Aslt‐Family
Agg Aslt‐NonFam
Burg‐Res
Burg‐All Other
2753 2527 2673 2604
2827 2710 2607
0
500
1000
1500
2000
2500
3000
2011 2012 2013 2014 2015 2016 2017
Year‐to‐Date Totals (Jan 1 through Dec 17)
Homicide
Sex Assault
Robbery‐Bus.
Robbery‐Other
Agg Aslt‐Family
Agg Aslt‐NonFam
Burg‐Res
Burg‐All Other
Larc‐Veh Burg
Larc‐All Other
Vehicle Theft
0
5
10
15
20
25
30
Nov 20‐Nov 26 Nov 27‐Dec 03 Dec 04‐Dec 10 Dec 11‐Dec 17
Last 28 Day Breakdown by Week ‐ Part 2
Vehicle
Burglary
Other
Larceny
Vehicle
Theft
Page 4 of 9 
Salt Lake City Police Department
 
2017 2016 Chg % Chg 2017 2016 Chg % Chg 2017 Recent 
Chg
Recent
% Chg
2017 2016 % Chg Avg** % Chg Avg** % Chg
Criminal Homicide 0 1 ‐1 ‐100.0% 0 1 ‐1 ‐100.0% 0 0 /0 0 3 ‐100.0% 1.00 ‐100.0% 0.80 ‐100.0%
Sexual Assault 0 1 ‐1 ‐100.0% 2 2 0 0.0% 3 ‐1 ‐33.3% 26 15 73.3% 14.67 77.3% 14.80 75.7%
Robbery ‐ Business 0 0 0 /0 0 0 0 /0 0 0 /0 8 4 100.0% 5.00 60.0% 4.80 66.7%
Robbery ‐ All Other 1 0 1 /0 3 0 3 /0 0 3 /0 23 17 35.3% 15.00 53.3% 14.00 64.3%
Agg. Assault ‐ Family 0 1 ‐1 ‐100.0% 2 3 ‐1 ‐33.3% 3 ‐1 ‐33.3% 15 24 ‐37.5% 13.33 12.5% 12.60 19.0%
Agg. Assault ‐ NonFamily 0 3 ‐3 ‐100.0% 3 5 ‐2 ‐40.0% 3 0 0.0% 44 47 ‐6.4% 34.67 26.9% 30.80 42.9%
Burglary ‐ Residential 5 2 3 150.0% 12 9 3 33.3% 7 5 71.4% 156 137 13.9% 151 3.3% 147 6.0%
Burglary ‐ All Other 0 4 ‐4 ‐100.0% 3 10 ‐7 ‐70.0% 8 ‐5 ‐62.5% 91 93 ‐2.2% 80.33 13.3% 77.80 17.0%
Larceny ‐ Vehicle Burglary 14 19 ‐5 ‐26.3% 52 63 ‐11 ‐17.5% 53 ‐1 ‐1.9% 611 687 ‐11.1% 730 ‐16.3% 636 ‐3.9%
Larceny ‐ All Other 5 20 ‐15 ‐75.0% 24 48 ‐24 ‐50.0% 26 ‐2 ‐7.7% 400 433 ‐7.6% 460 ‐13.0% 441 ‐9.2%
Motor Vehicle Theft 1 4 ‐3 ‐75.0% 5 8 ‐3 ‐37.5% 13 ‐8 ‐61.5% 211 201 5.0% 193 9.3% 187 12.7%
TOTAL 26 55 ‐29 ‐52.7% 106 149 ‐43 ‐28.9% 116 ‐10 ‐8.6% 1,585 1,661 ‐4.6% 1698 ‐6.7% 1566 1.2%
Nov 20Nov 27 Dec 04Dec 11‐Dec 2011 2012 2013 2014 2015 2016 2017
Homicide 0 0 0 0 1 1 0 0 0 3 0
Sex Assault 0 0 2 0 24 16 14 11 18 15 26
Robbery ‐ Business 0 0 0 0 13 5 4 9 2 4 8
Robbery ‐ All Other 0 0 2 1 17 6 19 14 14 17 23
Aggravated Assault ‐ Family 2 0 0 0 9 9 14 8 8 24 15
Aggravated Assault ‐ All Other 2 1 0 0 30 30 20 24 33 47 44
Burglary ‐ Residential 6 1 0 5 140 122 161 142 174 137 156
Burglary ‐ All Other 1 1 1 0 53 66 82 85 63 93 91
Larceny ‐ Vehicle Burglary 8 11 19 14 426 472 515 785 719 687 611
Larceny ‐ All Other 4 11 4 5 394 402 422 491 455 433 400
Vehicle Theft 1 0 3 1 167 184 173 164 214 201 211
TOTALS 24 25 31 26 1274 1313 1424 1733 1700 1661 1585 Year‐to‐Date Totals (Jan 1 through Dec 17)
Note: Charts may erroneously show an apparent drop in the most current data due to some cases not yet having been reported and/or recorded.
The figures included in this report are preliminary figures for general situational awareness and trend purposes only. They do not represent the official figures of the Salt Lake City Police Department and are 
subject to further analysis and revision. Due to the statute‐driven, changing nature of crime classification and area boundaries over time, be advised that the figures contained may not fully coincide with 
SLCPD statistical sources. Differences are reflective of the departmental procedures or policies that were in place at the time the events occurred and the date the data was compiled. In addition, data may 
be approximate in relation to indicated areas. Additionally, they are not Uniform Crime Reporting (UCR) or "crime rate" numbers and are not intended to be used as such. Rather, they are a breakdown of 
every offense within every case that occurred during the given time periods. Although every reasonable effort is made to verify their accuracy, the accuracy of any data is subject to the constraints of the 
report generation process as well as the manner, format, and point in time of any query.  
CompStat Report…….
Council District 3 ‐ 
Breakdown of All Offenses
*The above CompStat figures were generated on Monday, 1 day(s) after the closing date, which is indicated in the title. The figures are current as of the date generated.
Last 7 Days* Last 28 Days* Previous 28 Days*
(Prior to Last 28 Days)
Year to Date (YTD)* 3‐Year YTD
Average*
5‐Year YTD
Average*
Volume 3   ‐‐  Number 50
**Averages greater than or equal to 100 are rounded to a whole digit to maintain a consistent column size.
Report Covering the Week 12/11/2017 Through 12/17/2017 (Mon‐Sun)
0
1
2
3
4
5
6
7
Nov 20‐Nov 26Nov 27‐Dec 03Dec 04‐Dec 10Dec 11‐Dec 17
Last 28 Day Breakdown by Week ‐ Part 1
Homicide
Sex Assault
Robbery‐Bus.
Robbery‐Other
Agg Aslt‐Family
Agg Aslt‐NonFam
Burg‐Res
Burg‐All Other
1274 1313
1424
1733 1700 1661
1585
0
200
400
600
800
1000
1200
1400
1600
1800
2000
2011 2012 2013 2014 2015 2016 2017
Year‐to‐Date Totals (Jan 1 through Dec 17)
Homicide
Sex Assault
Robbery‐Bus.
Robbery‐Other
Agg Aslt‐Family
Agg Aslt‐NonFam
Burg‐Res
Burg‐All Other
Larc‐Veh Burg
Larc‐All Other
Vehicle Theft0
2
4
6
8
10
12
14
16
18
20
Nov 20‐Nov 26 Nov 27‐Dec 03 Dec 04‐Dec 10 Dec 11‐Dec 17
Last 28 Day Breakdown by Week ‐ Part 2
Vehicle
Burglary
Other
Larceny
Vehicle
Theft
Page 5 of 9 
Salt Lake City Police Department
 
2017 2016 Chg % Chg 2017 2016 Chg % Chg 2017 Recent 
Chg
Recent
% Chg
2017 2016 % Chg Avg** % Chg Avg** % Chg
Criminal Homicide 0 0 0 /0 0 0 0 /0 0 0 /0 5 2 150.0% 1.67 200.0% 1.40 257.1%
Sexual Assault 1 3 ‐2 ‐66.7% 4 6 ‐2 ‐33.3% 11 ‐7 ‐63.6% 110 90 22.2% 76.00 44.7% 63.60 73.0%
Robbery ‐ Business 0 2 ‐2 ‐100.0% 2 4 ‐2 ‐50.0% 1 1 100.0% 62 49 26.5% 44.67 38.8% 39.20 58.2%
Robbery ‐ All Other 4 6 ‐2 ‐33.3% 11 16 ‐5 ‐31.3% 8 3 37.5% 149 166 ‐10.2% 155 ‐3.9% 140 6.7%
Agg. Assault ‐ Family 1 0 1 /0 4 0 4 /0 1 3 300.0% 31 22 40.9% 27.67 12.0% 31.40 ‐1.3%
Agg. Assault ‐ NonFamily 3 5 ‐2 ‐40.0% 10 23 ‐13 ‐56.5% 13 ‐3 ‐23.1% 227 275 ‐17.5% 240 ‐5.4% 225 1.0%
Burglary ‐ Residential 1 2 ‐1 ‐50.0% 13 9 4 44.4% 12 1 8.3% 183 170 7.6% 166 10.2% 167 9.8%
Burglary ‐ All Other 3 1 2 200.0% 8 10 ‐2 ‐20.0% 19 ‐11 ‐57.9% 201 165 21.8% 175 14.6% 183 9.7%
Larceny ‐ Vehicle Burglary 13 23 ‐10 ‐43.5% 69 93 ‐24 ‐25.8% 105 ‐36 ‐34.3% 1,246 1,228 1.5% 1392 ‐10.5% 1379 ‐9.6%
Larceny ‐ All Other 24 41 ‐17 ‐41.5% 134 187 ‐53 ‐28.3% 137 ‐3 ‐2.2% 2,398 2,558 ‐6.3% 2617 ‐8.4% 2535 ‐5.4%
Motor Vehicle Theft 1 8 ‐7 ‐87.5% 32 28 4 14.3% 38 ‐6 ‐15.8% 419 387 8.3% 406 3.1% 369 13.5%
TOTAL 51 91 ‐40 ‐44.0% 287 376 ‐89 ‐23.7% 345 ‐58 ‐16.8% 5,031 5,112 ‐1.6% 5302 ‐5.1% 5133 ‐2.0%
Nov 20Nov 27 Dec 04Dec 11‐Dec 2011 2012 2013 2014 2015 2016 2017
Homicide 0 0 0 0 2 1 1 3 0 2 5
Sex Assault 1 0 2 1 50 45 45 67 71 90 110
Robbery ‐ Business 0 0 2 0 30 26 36 36 49 49 62
Robbery ‐ All Other 2 3 2 4 90 106 127 140 159 166 149
Aggravated Assault ‐ Family 2 1 0 1 23 32 42 30 31 22 31
Aggravated Assault ‐ All Other 4 1 2 3 192 201 203 219 226 275 227
Burglary ‐ Residential 5 5 2 1 169 148 187 153 175 170 183
Burglary ‐ All Other 4 1 0 3 110 219 171 173 188 165 201
Larceny ‐ Vehicle Burglary 22 14 20 13 1134 1513 1205 1416 1533 1228 1246
Larceny ‐ All Other 34 34 42 24 1661 2086 2735 2669 2625 2558 2398
Vehicle Theft 12 11 8 1 267 280 347 346 486 387 419
TOTALS 86 70 80 51 3728 4657 5099 5252 5543 5112 5031 Year‐to‐Date Totals (Jan 1 through Dec 17)
Note: Charts may erroneously show an apparent drop in the most current data due to some cases not yet having been reported and/or recorded.
The figures included in this report are preliminary figures for general situational awareness and trend purposes only. They do not represent the official figures of the Salt Lake City Police Department and are 
subject to further analysis and revision. Due to the statute‐driven, changing nature of crime classification and area boundaries over time, be advised that the figures contained may not fully coincide with 
SLCPD statistical sources. Differences are reflective of the departmental procedures or policies that were in place at the time the events occurred and the date the data was compiled. In addition, data may 
be approximate in relation to indicated areas. Additionally, they are not Uniform Crime Reporting (UCR) or "crime rate" numbers and are not intended to be used as such. Rather, they are a breakdown of 
every offense within every case that occurred during the given time periods. Although every reasonable effort is made to verify their accuracy, the accuracy of any data is subject to the constraints of the 
report generation process as well as the manner, format, and point in time of any query.  
CompStat Report…….
Council District 4 ‐ 
Breakdown of All Offenses
*The above CompStat figures were generated on Monday, 1 day(s) after the closing date, which is indicated in the title. The figures are current as of the date generated.
Last 7 Days* Last 28 Days* Previous 28 Days*
(Prior to Last 28 Days)
Year to Date (YTD)* 3‐Year YTD
Average*
5‐Year YTD
Average*
Volume 3   ‐‐  Number 50
**Averages greater than or equal to 100 are rounded to a whole digit to maintain a consistent column size.
Report Covering the Week 12/11/2017 Through 12/17/2017 (Mon‐Sun)
0
1
2
3
4
5
6
Nov 20‐Nov 26Nov 27‐Dec 03Dec 04‐Dec 10Dec 11‐Dec 17
Last 28 Day Breakdown by Week ‐ Part 1
Homicide
Sex Assault
Robbery‐Bus.
Robbery‐Other
Agg Aslt‐Family
Agg Aslt‐NonFam
Burg‐Res
Burg‐All Other
3728
4657
5099 5252 5543
5112 5031
0
1000
2000
3000
4000
5000
6000
2011 2012 2013 2014 2015 2016 2017
Year‐to‐Date Totals (Jan 1 through Dec 17)
Homicide
Sex Assault
Robbery‐Bus.
Robbery‐Other
Agg Aslt‐Family
Agg Aslt‐NonFam
Burg‐Res
Burg‐All Other
Larc‐Veh Burg
Larc‐All Other
Vehicle Theft0
5
10
15
20
25
30
35
40
45
Nov 20‐Nov 26 Nov 27‐Dec 03 Dec 04‐Dec 10 Dec 11‐Dec 17
Last 28 Day Breakdown by Week ‐ Part 2
Vehicle
Burglary
Other
Larceny
Vehicle
Theft
Page 6 of 9 
Salt Lake City Police Department
 
2017 2016 Chg % Chg 2017 2016 Chg % Chg 2017 Recent 
Chg
Recent
% Chg
2017 2016 % Chg Avg** % Chg Avg** % Chg
Criminal Homicide 0 0 0 /0 0 0 0 /0 0 0 /0 2 0 /0 0.67 200.0% 1.00 100.0%
Sexual Assault 1 1 0 0.0% 2 5 ‐3 ‐60.0% 3 ‐1 ‐33.3% 52 44 18.2% 34.00 52.9% 30.20 72.2%
Robbery ‐ Business 1 0 1 /0 1 2 ‐1 ‐50.0% 1 0 0.0% 31 32 ‐3.1% 29.67 4.5% 29.60 4.7%
Robbery ‐ All Other 1 0 1 /0 5 3 2 66.7% 1 4 400.0% 47 56 ‐16.1% 51.00 ‐7.8% 48.40 ‐2.9%
Agg. Assault ‐ Family 0 1 ‐1 ‐100.0% 0 2 ‐2 ‐100.0% 2 ‐2 ‐100.0% 17 29 ‐41.4% 31.33 ‐45.7% 31.20 ‐45.5%
Agg. Assault ‐ NonFamily 2 1 1 100.0% 9 6 3 50.0% 6 3 50.0% 99 119 ‐16.8% 89.00 11.2% 89.60 10.5%
Burglary ‐ Residential 4 3 1 33.3% 21 10 11 110.0% 14 7 50.0% 176 192 ‐8.3% 207 ‐15.0% 209 ‐15.6%
Burglary ‐ All Other 1 1 0 0.0% 6 17 ‐11 ‐64.7% 10 ‐4 ‐40.0% 151 150 0.7% 130 15.9% 131 15.6%
Larceny ‐ Vehicle Burglary 12 11 1 9.1% 63 41 22 53.7% 49 14 28.6% 683 885 ‐22.8% 822 ‐16.9% 743 ‐8.1%
Larceny ‐ All Other 26 38 ‐12 ‐31.6% 137 147 ‐10 ‐6.8% 146 ‐9 ‐6.2% 1,925 2,053 ‐6.2% 2103 ‐8.5% 1873 2.8%
Motor Vehicle Theft 2 9 ‐7 ‐77.8% 25 34 ‐9 ‐26.5% 19 6 31.6% 326 345 ‐5.5% 338 ‐3.6% 310 5.2%
TOTAL 50 65 ‐15 ‐23.1% 269 267 2 0.7% 251 18 7.2% 3,509 3,905 ‐10.1% 3836 ‐8.5% 3495 0.4%
Nov 20Nov 27 Dec 04Dec 11‐Dec 2011 2012 2013 2014 2015 2016 2017
Homicide 0 0 0 0 2 0 3 0 2 0 2
Sex Assault 0 0 1 1 24 27 22 28 30 44 52
Robbery ‐ Business 0 0 0 1 23 26 33 29 28 32 31
Robbery ‐ All Other 1 3 0 1 49 37 52 51 46 56 47
Aggravated Assault ‐ Family 0 0 0 0 32 26 36 36 29 29 17
Aggravated Assault ‐ All Other 1 3 3 2 72 88 93 66 82 119 99
Burglary ‐ Residential 7 8 2 4 199 199 223 191 238 192 176
Burglary ‐ All Other 0 4 1 1 91 132 130 109 132 150 151
Larceny ‐ Vehicle Burglary 14 20 17 12 555 687 562 717 865 885 683
Larceny ‐ All Other 32 40 39 26 996 1509 1545 1956 2300 2053 1925
Vehicle Theft 7 9 7 2 179 240 295 308 361 345 326
TOTALS 62 87 70 50 2222 2971 2994 3491 4113 3905 3509 Year‐to‐Date Totals (Jan 1 through Dec 17)
Note: Charts may erroneously show an apparent drop in the most current data due to some cases not yet having been reported and/or recorded.
The figures included in this report are preliminary figures for general situational awareness and trend purposes only. They do not represent the official figures of the Salt Lake City Police Department and are 
subject to further analysis and revision. Due to the statute‐driven, changing nature of crime classification and area boundaries over time, be advised that the figures contained may not fully coincide with 
SLCPD statistical sources. Differences are reflective of the departmental procedures or policies that were in place at the time the events occurred and the date the data was compiled. In addition, data may 
be approximate in relation to indicated areas. Additionally, they are not Uniform Crime Reporting (UCR) or "crime rate" numbers and are not intended to be used as such. Rather, they are a breakdown of 
every offense within every case that occurred during the given time periods. Although every reasonable effort is made to verify their accuracy, the accuracy of any data is subject to the constraints of the 
report generation process as well as the manner, format, and point in time of any query.  
CompStat Report…….
Council District 5 ‐ 
Breakdown of All Offenses
*The above CompStat figures were generated on Monday, 1 day(s) after the closing date, which is indicated in the title. The figures are current as of the date generated.
Last 7 Days* Last 28 Days* Previous 28 Days*
(Prior to Last 28 Days)
Year to Date (YTD)* 3‐Year YTD
Average*
5‐Year YTD
Average*
Volume 3   ‐‐  Number 50
**Averages greater than or equal to 100 are rounded to a whole digit to maintain a consistent column size.
Report Covering the Week 12/11/2017 Through 12/17/2017 (Mon‐Sun)
0
1
2
3
4
5
6
7
8
9
Nov 20‐Nov 26Nov 27‐Dec 03Dec 04‐Dec 10Dec 11‐Dec 17
Last 28 Day Breakdown by Week ‐ Part 1
Homicide
Sex Assault
Robbery‐Bus.
Robbery‐Other
Agg Aslt‐Family
Agg Aslt‐NonFam
Burg‐Res
Burg‐All Other
2222
2971 2994
3491
4113 3905
3509
0
500
1000
1500
2000
2500
3000
3500
4000
4500
2011 2012 2013 2014 2015 2016 2017
Year‐to‐Date Totals (Jan 1 through Dec 17)
Homicide
Sex Assault
Robbery‐Bus.
Robbery‐Other
Agg Aslt‐Family
Agg Aslt‐NonFam
Burg‐Res
Burg‐All Other
Larc‐Veh Burg
Larc‐All Other
Vehicle Theft0
5
10
15
20
25
30
35
40
45
Nov 20‐Nov 26 Nov 27‐Dec 03 Dec 04‐Dec 10 Dec 11‐Dec 17
Last 28 Day Breakdown by Week ‐ Part 2
Vehicle
Burglary
Other
Larceny
Vehicle
Theft
Page 7 of 9 
Salt Lake City Police Department
 
2017 2016 Chg % Chg 2017 2016 Chg % Chg 2017 Recent 
Chg
Recent
% Chg
2017 2016 % Chg Avg** % Chg Avg** % Chg
Criminal Homicide 0 0 0 /0 0 0 0 /0 0 0 /0 1 0 /0 0.00 /0 0.00 /0
Sexual Assault 0 0 0 /0 1 0 1 /0 1 0 0.0% 5 4 25.0% 6.00 ‐16.7% 6.60 ‐24.2%
Robbery ‐ Business 0 0 0 /0 1 0 1 /0 0 1 /0 6 4 50.0% 7.33 ‐18.2% 5.40 11.1%
Robbery ‐ All Other 0 0 0 /0 0 0 0 /0 1 ‐1 ‐100.0% 3 2 50.0% 3.00 0.0% 3.40 ‐11.8%
Agg. Assault ‐ Family 0 0 0 /0 0 1 ‐1 ‐100.0% 0 0 /0 5 4 25.0% 2.67 87.5% 2.20 127.3%
Agg. Assault ‐ NonFamily 0 0 0 /0 1 0 1 /0 0 1 /0 10 4 150.0% 5.00 100.0% 8.40 19.0%
Burglary ‐ Residential 1 1 0 0.0% 5 9 ‐4 ‐44.4% 8 ‐3 ‐37.5% 82 82 0.0% 87.67 ‐6.5% 87.00 ‐5.7%
Burglary ‐ All Other 2 0 2 /0 5 1 4 400.0% 4 1 25.0% 46 23 100.0% 27.67 66.3% 30.00 53.3%
Larceny ‐ Vehicle Burglary 8 5 3 60.0% 21 20 1 5.0% 24 ‐3 ‐12.5% 328 330 ‐0.6% 350 ‐6.2% 339 ‐3.2%
Larceny ‐ All Other 0 5 ‐5 ‐100.0% 12 22 ‐10 ‐45.5% 12 0 0.0% 208 202 3.0% 211 ‐1.4% 199 4.6%
Motor Vehicle Theft 0 0 0 /0 3 4 ‐1 ‐25.0% 5 ‐2 ‐40.0% 67 57 17.5% 77.33 ‐13.4% 81.20 ‐17.5%
TOTAL 11 11 0 0.0% 49 57 ‐8 ‐14.0% 55 ‐6 ‐10.9% 761 712 6.9% 777 ‐2.1% 762 ‐0.1%
Nov 20Nov 27 Dec 04Dec 11‐Dec 2011 2012 2013 2014 2015 2016 2017
Homicide 0 0 0 0 0 0 0 0 0 0 1
Sex Assault 0 1 0 0 6 10 5 8 6 4 5
Robbery ‐ Business 0 1 0 0 3 2 3 10 8 4 6
Robbery ‐ All Other 0 0 0 0 6 5 3 2 5 2 3
Aggravated Assault ‐ Family 0 0 0 0 6 1 2 2 2 4 5
Aggravated Assault ‐ All Other 0 1 0 0 7 18 9 4 7 4 10
Burglary ‐ Residential 3 1 0 1 83 76 96 84 97 82 82
Burglary ‐ All Other 1 0 2 2 30 26 41 27 33 23 46
Larceny ‐ Vehicle Burglary 5 4 4 8 413 339 307 311 408 330 328
Larceny ‐ All Other 6 2 4 0 192 195 166 220 211 202 208
Vehicle Theft 1 2 0 0 89 96 78 84 91 57 67
TOTALS 16 12 10 11 835 768 710 752 868 712 761 Year‐to‐Date Totals (Jan 1 through Dec 17)
Note: Charts may erroneously show an apparent drop in the most current data due to some cases not yet having been reported and/or recorded.
The figures included in this report are preliminary figures for general situational awareness and trend purposes only. They do not represent the official figures of the Salt Lake City Police Department and are 
subject to further analysis and revision. Due to the statute‐driven, changing nature of crime classification and area boundaries over time, be advised that the figures contained may not fully coincide with 
SLCPD statistical sources. Differences are reflective of the departmental procedures or policies that were in place at the time the events occurred and the date the data was compiled. In addition, data may 
be approximate in relation to indicated areas. Additionally, they are not Uniform Crime Reporting (UCR) or "crime rate" numbers and are not intended to be used as such. Rather, they are a breakdown of 
every offense within every case that occurred during the given time periods. Although every reasonable effort is made to verify their accuracy, the accuracy of any data is subject to the constraints of the 
report generation process as well as the manner, format, and point in time of any query.  
CompStat Report…….
Council District 6 ‐ 
Breakdown of All Offenses
*The above CompStat figures were generated on Monday, 1 day(s) after the closing date, which is indicated in the title. The figures are current as of the date generated.
Last 7 Days* Last 28 Days* Previous 28 Days*
(Prior to Last 28 Days)
Year to Date (YTD)* 3‐Year YTD
Average*
5‐Year YTD
Average*
Volume 3   ‐‐  Number 50
**Averages greater than or equal to 100 are rounded to a whole digit to maintain a consistent column size.
Report Covering the Week 12/11/2017 Through 12/17/2017 (Mon‐Sun)
0
1
2
3
4
Nov 20‐Nov 26Nov 27‐Dec 03Dec 04‐Dec 10Dec 11‐Dec 17
Last 28 Day Breakdown by Week ‐ Part 1
Homicide
Sex Assault
Robbery‐Bus.
Robbery‐Other
Agg Aslt‐Family
Agg Aslt‐NonFam
Burg‐Res
Burg‐All Other
835
768
710
752
868
712
761
0
100
200
300
400
500
600
700
800
900
1000
2011 2012 2013 2014 2015 2016 2017
Year‐to‐Date Totals (Jan 1 through Dec 17)
Homicide
Sex Assault
Robbery‐Bus.
Robbery‐Other
Agg Aslt‐Family
Agg Aslt‐NonFam
Burg‐Res
Burg‐All Other
Larc‐Veh Burg
Larc‐All Other
Vehicle Theft0
1
2
3
4
5
6
7
8
9
Nov 20‐Nov 26 Nov 27‐Dec 03 Dec 04‐Dec 10 Dec 11‐Dec 17
Last 28 Day Breakdown by Week ‐ Part 2
Vehicle
Burglary
Other
Larceny
Vehicle
Theft
Page 8 of 9 
Salt Lake City Police Department
 
2017 2016 Chg % Chg 2017 2016 Chg % Chg 2017 Recent 
Chg
Recent
% Chg
2017 2016 % Chg Avg** % Chg Avg** % Chg
Criminal Homicide 0 0 0 /0 0 0 0 /0 0 0 /0 0 0 /0 0.33 ‐100.0% 0.40 ‐100.0%
Sexual Assault 0 1 ‐1 ‐100.0% 0 2 ‐2 ‐100.0% 3 ‐3 ‐100.0% 24 12 100.0% 10.67 125.0% 13.40 79.1%
Robbery ‐ Business 1 0 1 /0 2 0 2 /0 1 1 100.0% 13 27 ‐51.9% 26.33 ‐50.6% 21.80 ‐40.4%
Robbery ‐ All Other 0 1 ‐1 ‐100.0% 0 1 ‐1 ‐100.0% 2 ‐2 ‐100.0% 13 21 ‐38.1% 14.33 ‐9.3% 15.80 ‐17.7%
Agg. Assault ‐ Family 1 0 1 /0 1 2 ‐1 ‐50.0% 1 0 0.0% 8 11 ‐27.3% 12.67 ‐36.8% 14.20 ‐43.7%
Agg. Assault ‐ NonFamily 1 0 1 /0 2 0 2 /0 1 1 100.0% 15 36 ‐58.3% 36.00 ‐58.3% 39.00 ‐61.5%
Burglary ‐ Residential 0 2 ‐2 ‐100.0% 3 6 ‐3 ‐50.0% 6 ‐3 ‐50.0% 112 116 ‐3.4% 134 ‐16.2% 143 ‐21.5%
Burglary ‐ All Other 2 1 1 100.0% 8 10 ‐2 ‐20.0% 9 ‐1 ‐11.1% 103 99 4.0% 88.67 16.2% 91.80 12.2%
Larceny ‐ Vehicle Burglary 18 20 ‐2 ‐10.0% 67 77 ‐10 ‐13.0% 51 16 31.4% 596 707 ‐15.7% 710 ‐16.1% 651 ‐8.5%
Larceny ‐ All Other 9 22 ‐13 ‐59.1% 53 82 ‐29 ‐35.4% 69 ‐16 ‐23.2% 938 1,016 ‐7.7% 1002 ‐6.4% 937 0.1%
Motor Vehicle Theft 6 3 3 100.0% 16 18 ‐2 ‐11.1% 14 2 14.3% 177 181 ‐2.2% 190 ‐6.8% 186 ‐4.6%
TOTAL 38 50 ‐12 ‐24.0% 152 198 ‐46 ‐23.2% 157 ‐5 ‐3.2% 1,999 2,226 ‐10.2% 2225 ‐10.2% 2113 ‐5.4%
Nov 20Nov 27 Dec 04Dec 11‐Dec 2011 2012 2013 2014 2015 2016 2017
Homicide 0 0 0 0 1 1 0 0 1 0 0
Sex Assault 0 0 0 0 7 17 18 10 10 12 24
Robbery ‐ Business 1 0 0 1 14 7 23 25 27 27 13
Robbery ‐ All Other 0 0 0 0 19 21 15 10 12 21 13
Aggravated Assault ‐ Family 0 0 0 1 8 18 15 8 19 11 8
Aggravated Assault ‐ All Other 1 0 0 1 37 43 44 32 40 36 15
Burglary ‐ Residential 0 1 2 0 124 138 174 126 159 116 112
Burglary ‐ All Other 1 2 3 2 56 128 65 73 94 99 103
Larceny ‐ Vehicle Burglary 13 24 12 18 513 602 524 617 807 707 596
Larceny ‐ All Other 16 18 10 9 720 755 925 989 1002 1016 938
Vehicle Theft 4 1 5 6 124 161 197 170 219 181 177
TOTALS 36 46 32 38 1623 1891 2000 2060 2390 2226 1999 Year‐to‐Date Totals (Jan 1 through Dec 17)
Note: Charts may erroneously show an apparent drop in the most current data due to some cases not yet having been reported and/or recorded.
The figures included in this report are preliminary figures for general situational awareness and trend purposes only. They do not represent the official figures of the Salt Lake City Police Department and are 
subject to further analysis and revision. Due to the statute‐driven, changing nature of crime classification and area boundaries over time, be advised that the figures contained may not fully coincide with 
SLCPD statistical sources. Differences are reflective of the departmental procedures or policies that were in place at the time the events occurred and the date the data was compiled. In addition, data may 
be approximate in relation to indicated areas. Additionally, they are not Uniform Crime Reporting (UCR) or "crime rate" numbers and are not intended to be used as such. Rather, they are a breakdown of 
every offense within every case that occurred during the given time periods. Although every reasonable effort is made to verify their accuracy, the accuracy of any data is subject to the constraints of the 
report generation process as well as the manner, format, and point in time of any query.  
*The above CompStat figures were generated on Monday, 1 day(s) after the closing date, which is indicated in the title. The figures are current as of the date generated.
CompStat Report…….
Council District 7 ‐ 
Breakdown of All Offenses
Volume 3   ‐‐  Number 50
Last 7 Days* Last 28 Days* Previous 28 Days*
(Prior to Last 28 Days)
Year to Date (YTD)* 3‐Year YTD
Average*
5‐Year YTD
Average*
**Averages greater than or equal to 100 are rounded to a whole digit to maintain a consistent column size.
Report Covering the Week 12/11/2017 Through 12/17/2017 (Mon‐Sun)
0
1
2
3
4
Nov 20‐Nov 26Nov 27‐Dec 03Dec 04‐Dec 10Dec 11‐Dec 17
Last 28 Day Breakdown by Week ‐ Part 1
Homicide
Sex Assault
Robbery‐Bus.
Robbery‐Other
Agg Aslt‐Family
Agg Aslt‐NonFam
Burg‐Res
Burg‐All Other
1623
1891 2000 2060
2390
2226
1999
0
500
1000
1500
2000
2500
3000
2011 2012 2013 2014 2015 2016 2017
Year‐to‐Date Totals (Jan 1 through Dec 17)
Homicide
Sex Assault
Robbery‐Bus.
Robbery‐Other
Agg Aslt‐Family
Agg Aslt‐NonFam
Burg‐Res
Burg‐All Other
Larc‐Veh Burg
Larc‐All Other
Vehicle Theft0
5
10
15
20
25
30
Nov 20‐Nov 26 Nov 27‐Dec 03 Dec 04‐Dec 10 Dec 11‐Dec 17
Last 28 Day Breakdown by Week ‐ Part 2
Vehicle
Burglary
Other
Larceny
Vehicle
Theft
Page 9 of 9 

More Related Content

What's hot

2014 Chicago Crime Data Analysis
2014 Chicago Crime Data Analysis 2014 Chicago Crime Data Analysis
2014 Chicago Crime Data Analysis Yawen Li
 
Loudoun Housing Fulton End 2008
Loudoun Housing Fulton End 2008Loudoun Housing Fulton End 2008
Loudoun Housing Fulton End 2008Betty Plashal
 
Fairfax Housing Report 2008
Fairfax Housing Report 2008Fairfax Housing Report 2008
Fairfax Housing Report 2008Betty Plashal
 
Amárach Economic Recovery Index July 2014
Amárach Economic Recovery Index July 2014Amárach Economic Recovery Index July 2014
Amárach Economic Recovery Index July 2014Amarach Research
 
Hasil nilai-seleksi-pppk-kab-tangerang
Hasil nilai-seleksi-pppk-kab-tangerangHasil nilai-seleksi-pppk-kab-tangerang
Hasil nilai-seleksi-pppk-kab-tangerangpowerrangers2
 
The Woodlands Demographics 2015
The Woodlands Demographics 2015The Woodlands Demographics 2015
The Woodlands Demographics 2015Ken Brand
 
Market Watch APRIL 2015
Market Watch APRIL 2015Market Watch APRIL 2015
Market Watch APRIL 2015Chaba Tamasi
 
Bdm presentation template girbban
Bdm presentation template   girbbanBdm presentation template   girbban
Bdm presentation template girbbanGirbban Paul
 
Votos precidenciales
Votos precidencialesVotos precidenciales
Votos precidencialesvalenbalet97
 
Tx -demo_stat_fy12_414977_7
Tx  -demo_stat_fy12_414977_7Tx  -demo_stat_fy12_414977_7
Tx -demo_stat_fy12_414977_7satoriwatersfl
 
Amárach Economic Recovery Index November 2013
Amárach Economic Recovery Index November 2013Amárach Economic Recovery Index November 2013
Amárach Economic Recovery Index November 2013Amarach Research
 
Market Watch TORONTO 2015 JANUARY
Market Watch TORONTO 2015 JANUARYMarket Watch TORONTO 2015 JANUARY
Market Watch TORONTO 2015 JANUARYChaba Tamasi
 
Road safety presentation
Road safety presentationRoad safety presentation
Road safety presentationSafaricom PLC
 
June Market Report 2014
June Market Report 2014June Market Report 2014
June Market Report 2014Michelle Makos
 
ECO303- Introduction to Econometrics- term paper
ECO303- Introduction to Econometrics- term paperECO303- Introduction to Econometrics- term paper
ECO303- Introduction to Econometrics- term paperSamiya Yesmin
 
Transportation Planning work samples
Transportation Planning work samplesTransportation Planning work samples
Transportation Planning work samplesEmma Hu
 

What's hot (18)

2014 Chicago Crime Data Analysis
2014 Chicago Crime Data Analysis 2014 Chicago Crime Data Analysis
2014 Chicago Crime Data Analysis
 
Crimes by Children by Ages 2001 to 2014
Crimes by Children by Ages 2001  to  2014Crimes by Children by Ages 2001  to  2014
Crimes by Children by Ages 2001 to 2014
 
Loudoun Housing Fulton End 2008
Loudoun Housing Fulton End 2008Loudoun Housing Fulton End 2008
Loudoun Housing Fulton End 2008
 
Fairfax Housing Report 2008
Fairfax Housing Report 2008Fairfax Housing Report 2008
Fairfax Housing Report 2008
 
Amárach Economic Recovery Index July 2014
Amárach Economic Recovery Index July 2014Amárach Economic Recovery Index July 2014
Amárach Economic Recovery Index July 2014
 
Hasil nilai-seleksi-pppk-kab-tangerang
Hasil nilai-seleksi-pppk-kab-tangerangHasil nilai-seleksi-pppk-kab-tangerang
Hasil nilai-seleksi-pppk-kab-tangerang
 
The Woodlands Demographics 2015
The Woodlands Demographics 2015The Woodlands Demographics 2015
The Woodlands Demographics 2015
 
Market Watch APRIL 2015
Market Watch APRIL 2015Market Watch APRIL 2015
Market Watch APRIL 2015
 
Bdm presentation template girbban
Bdm presentation template   girbbanBdm presentation template   girbban
Bdm presentation template girbban
 
Votos precidenciales
Votos precidencialesVotos precidenciales
Votos precidenciales
 
Tx -demo_stat_fy12_414977_7
Tx  -demo_stat_fy12_414977_7Tx  -demo_stat_fy12_414977_7
Tx -demo_stat_fy12_414977_7
 
Amárach Economic Recovery Index November 2013
Amárach Economic Recovery Index November 2013Amárach Economic Recovery Index November 2013
Amárach Economic Recovery Index November 2013
 
Market Watch TORONTO 2015 JANUARY
Market Watch TORONTO 2015 JANUARYMarket Watch TORONTO 2015 JANUARY
Market Watch TORONTO 2015 JANUARY
 
Road safety presentation
Road safety presentationRoad safety presentation
Road safety presentation
 
June Market Report 2014
June Market Report 2014June Market Report 2014
June Market Report 2014
 
ECO303- Introduction to Econometrics- term paper
ECO303- Introduction to Econometrics- term paperECO303- Introduction to Econometrics- term paper
ECO303- Introduction to Econometrics- term paper
 
2019 sotc data book 2up for slideshare
2019 sotc data book 2up for slideshare2019 sotc data book 2up for slideshare
2019 sotc data book 2up for slideshare
 
Transportation Planning work samples
Transportation Planning work samplesTransportation Planning work samples
Transportation Planning work samples
 

Similar to SLCPD CompStat no.50 (week ending 12 17-17)

Analytics at Atlanta Police Foundation
Analytics at Atlanta Police FoundationAnalytics at Atlanta Police Foundation
Analytics at Atlanta Police FoundationPeter Molnar
 
2015 crime states for Ward 6 Stittsville
2015 crime states for Ward 6 Stittsville2015 crime states for Ward 6 Stittsville
2015 crime states for Ward 6 StittsvilleDevyn Barrie
 
City of Ottawa crime trends 2014-15
City of Ottawa crime trends 2014-15City of Ottawa crime trends 2014-15
City of Ottawa crime trends 2014-15Devyn Barrie
 
crime statistic Bangladesh.pdf
crime statistic Bangladesh.pdfcrime statistic Bangladesh.pdf
crime statistic Bangladesh.pdfSajid Hasan Sifat
 
Police annual report 2017 w speaker notes
Police annual report 2017 w speaker notesPolice annual report 2017 w speaker notes
Police annual report 2017 w speaker notesDouglasBrinkley
 
Valuation of Indian hospitality industry
Valuation of Indian hospitality industryValuation of Indian hospitality industry
Valuation of Indian hospitality industryShivani Chaluvadi
 
MTBPS 2020 – a realistic look at South Africa’s fiscal position
MTBPS 2020 – a realistic look at South Africa’s fiscal positionMTBPS 2020 – a realistic look at South Africa’s fiscal position
MTBPS 2020 – a realistic look at South Africa’s fiscal positionSTANLIB
 
Effort Report KPI's for salesman efficiency
Effort Report KPI's for salesman efficiencyEffort Report KPI's for salesman efficiency
Effort Report KPI's for salesman efficiencyEric Smith
 
Sheriff presentation to Saratoga City Council December 6th
Sheriff presentation to Saratoga City Council December 6thSheriff presentation to Saratoga City Council December 6th
Sheriff presentation to Saratoga City Council December 6thRishi Kumar
 
BroadcastYear04-05
BroadcastYear04-05BroadcastYear04-05
BroadcastYear04-05Sandy Zwyer
 
.2002200101 to 02.$ of Sale.docx
.2002200101 to 02.$ of Sale.docx.2002200101 to 02.$ of Sale.docx
.2002200101 to 02.$ of Sale.docxtienmixon
 
Stats Final-Traffic Fatalities
Stats Final-Traffic FatalitiesStats Final-Traffic Fatalities
Stats Final-Traffic FatalitiesBetty Trinh
 

Similar to SLCPD CompStat no.50 (week ending 12 17-17) (19)

Analytics at Atlanta Police Foundation
Analytics at Atlanta Police FoundationAnalytics at Atlanta Police Foundation
Analytics at Atlanta Police Foundation
 
2015 crime states for Ward 6 Stittsville
2015 crime states for Ward 6 Stittsville2015 crime states for Ward 6 Stittsville
2015 crime states for Ward 6 Stittsville
 
City of Ottawa crime trends 2014-15
City of Ottawa crime trends 2014-15City of Ottawa crime trends 2014-15
City of Ottawa crime trends 2014-15
 
HR analytics report
HR analytics reportHR analytics report
HR analytics report
 
crime statistic Bangladesh.pdf
crime statistic Bangladesh.pdfcrime statistic Bangladesh.pdf
crime statistic Bangladesh.pdf
 
Police annual report 2017 w speaker notes
Police annual report 2017 w speaker notesPolice annual report 2017 w speaker notes
Police annual report 2017 w speaker notes
 
Ram sir PPT
Ram sir PPTRam sir PPT
Ram sir PPT
 
Calculo de esal
Calculo de esalCalculo de esal
Calculo de esal
 
SHSP_all_20121127_PDForder
SHSP_all_20121127_PDForderSHSP_all_20121127_PDForder
SHSP_all_20121127_PDForder
 
2009 01 07 2008 Year End Report
2009 01 07 2008 Year End Report2009 01 07 2008 Year End Report
2009 01 07 2008 Year End Report
 
Valuation of Indian hospitality industry
Valuation of Indian hospitality industryValuation of Indian hospitality industry
Valuation of Indian hospitality industry
 
Using Data to Combat Impaired Driving
Using Data to Combat Impaired DrivingUsing Data to Combat Impaired Driving
Using Data to Combat Impaired Driving
 
MTBPS 2020 – a realistic look at South Africa’s fiscal position
MTBPS 2020 – a realistic look at South Africa’s fiscal positionMTBPS 2020 – a realistic look at South Africa’s fiscal position
MTBPS 2020 – a realistic look at South Africa’s fiscal position
 
Trends in Business Environment 2012-2016
Trends in Business Environment 2012-2016 Trends in Business Environment 2012-2016
Trends in Business Environment 2012-2016
 
Effort Report KPI's for salesman efficiency
Effort Report KPI's for salesman efficiencyEffort Report KPI's for salesman efficiency
Effort Report KPI's for salesman efficiency
 
Sheriff presentation to Saratoga City Council December 6th
Sheriff presentation to Saratoga City Council December 6thSheriff presentation to Saratoga City Council December 6th
Sheriff presentation to Saratoga City Council December 6th
 
BroadcastYear04-05
BroadcastYear04-05BroadcastYear04-05
BroadcastYear04-05
 
.2002200101 to 02.$ of Sale.docx
.2002200101 to 02.$ of Sale.docx.2002200101 to 02.$ of Sale.docx
.2002200101 to 02.$ of Sale.docx
 
Stats Final-Traffic Fatalities
Stats Final-Traffic FatalitiesStats Final-Traffic Fatalities
Stats Final-Traffic Fatalities
 

More from ELPCO East Liberty Park Comm. Organization

More from ELPCO East Liberty Park Comm. Organization (20)

ELPCO Update: November 2018
ELPCO Update: November 2018ELPCO Update: November 2018
ELPCO Update: November 2018
 
Results from ELPCO’s 5-Way Intersection Survey (September 2018)
Results from ELPCO’s 5-Way Intersection Survey (September 2018)Results from ELPCO’s 5-Way Intersection Survey (September 2018)
Results from ELPCO’s 5-Way Intersection Survey (September 2018)
 
18-10-ELPCO October Community Meeting
18-10-ELPCO October Community Meeting18-10-ELPCO October Community Meeting
18-10-ELPCO October Community Meeting
 
August 2018 - ELPCO Agenda
August 2018 - ELPCO AgendaAugust 2018 - ELPCO Agenda
August 2018 - ELPCO Agenda
 
900 S Reconstruction Update (July 2018)
900 S Reconstruction Update (July 2018)900 S Reconstruction Update (July 2018)
900 S Reconstruction Update (July 2018)
 
ELPCO Community Update (July 2018)
ELPCO Community Update (July 2018)ELPCO Community Update (July 2018)
ELPCO Community Update (July 2018)
 
900 S Reconstruction and 9-Line Trail Update (April 2018)
900 S Reconstruction and 9-Line Trail Update (April 2018)900 S Reconstruction and 9-Line Trail Update (April 2018)
900 S Reconstruction and 9-Line Trail Update (April 2018)
 
2018 Salt lake City Marathon
2018 Salt lake City Marathon2018 Salt lake City Marathon
2018 Salt lake City Marathon
 
February 2018 ELPCO agenda
February 2018 ELPCO agendaFebruary 2018 ELPCO agenda
February 2018 ELPCO agenda
 
January 2018 - SLCPD Crime Stats - District #5
January 2018 - SLCPD Crime Stats - District #5January 2018 - SLCPD Crime Stats - District #5
January 2018 - SLCPD Crime Stats - District #5
 
Open House for 900 S Reconstruction & 9-Line Trail
Open House for 900 S Reconstruction & 9-Line TrailOpen House for 900 S Reconstruction & 9-Line Trail
Open House for 900 S Reconstruction & 9-Line Trail
 
SLCPD - District 5 September 2017
SLCPD - District 5   September 2017SLCPD - District 5   September 2017
SLCPD - District 5 September 2017
 
CRIME PREVENTION THROUGH ENVIRONMENTAL DESIGN
CRIME PREVENTION THROUGH ENVIRONMENTAL DESIGNCRIME PREVENTION THROUGH ENVIRONMENTAL DESIGN
CRIME PREVENTION THROUGH ENVIRONMENTAL DESIGN
 
SLC Costume Shop Dev.
SLC Costume Shop Dev.SLC Costume Shop Dev.
SLC Costume Shop Dev.
 
Salt Lake Costume Project (1701 S 1100 E)
Salt Lake Costume Project (1701 S 1100 E)Salt Lake Costume Project (1701 S 1100 E)
Salt Lake Costume Project (1701 S 1100 E)
 
Operation Rio Grande - Outline
Operation Rio Grande - OutlineOperation Rio Grande - Outline
Operation Rio Grande - Outline
 
How to Survive Fireworks Season in SLC
How to Survive Fireworks Season in SLCHow to Survive Fireworks Season in SLC
How to Survive Fireworks Season in SLC
 
May 2017 ELPCO agenda-v2
May 2017 ELPCO agenda-v2May 2017 ELPCO agenda-v2
May 2017 ELPCO agenda-v2
 
May 2017 - ELPCO Voting Bylaw Revisions (PPT presentation)
May 2017 - ELPCO Voting Bylaw Revisions (PPT presentation)May 2017 - ELPCO Voting Bylaw Revisions (PPT presentation)
May 2017 - ELPCO Voting Bylaw Revisions (PPT presentation)
 
May 2017 - ELPCO Voting Bylaw Revisions (1-pager)
May 2017 - ELPCO Voting Bylaw Revisions (1-pager)May 2017 - ELPCO Voting Bylaw Revisions (1-pager)
May 2017 - ELPCO Voting Bylaw Revisions (1-pager)
 

Recently uploaded

Climate change and safety and health at work
Climate change and safety and health at workClimate change and safety and health at work
Climate change and safety and health at workChristina Parmionova
 
(NEHA) Bhosari Call Girls Just Call 7001035870 [ Cash on Delivery ] Pune Escorts
(NEHA) Bhosari Call Girls Just Call 7001035870 [ Cash on Delivery ] Pune Escorts(NEHA) Bhosari Call Girls Just Call 7001035870 [ Cash on Delivery ] Pune Escorts
(NEHA) Bhosari Call Girls Just Call 7001035870 [ Cash on Delivery ] Pune Escortsranjana rawat
 
Call Girls Service Race Course Road Just Call 7001305949 Enjoy College Girls ...
Call Girls Service Race Course Road Just Call 7001305949 Enjoy College Girls ...Call Girls Service Race Course Road Just Call 7001305949 Enjoy College Girls ...
Call Girls Service Race Course Road Just Call 7001305949 Enjoy College Girls ...narwatsonia7
 
VIP High Class Call Girls Amravati Anushka 8250192130 Independent Escort Serv...
VIP High Class Call Girls Amravati Anushka 8250192130 Independent Escort Serv...VIP High Class Call Girls Amravati Anushka 8250192130 Independent Escort Serv...
VIP High Class Call Girls Amravati Anushka 8250192130 Independent Escort Serv...Suhani Kapoor
 
Call Girls Bangalore Saanvi 7001305949 Independent Escort Service Bangalore
Call Girls Bangalore Saanvi 7001305949 Independent Escort Service BangaloreCall Girls Bangalore Saanvi 7001305949 Independent Escort Service Bangalore
Call Girls Bangalore Saanvi 7001305949 Independent Escort Service Bangalorenarwatsonia7
 
Incident Command System xxxxxxxxxxxxxxxxxxxxxxxxx
Incident Command System xxxxxxxxxxxxxxxxxxxxxxxxxIncident Command System xxxxxxxxxxxxxxxxxxxxxxxxx
Incident Command System xxxxxxxxxxxxxxxxxxxxxxxxxPeter Miles
 
PPT Item # 4 - 231 Encino Ave (Significance Only)
PPT Item # 4 - 231 Encino Ave (Significance Only)PPT Item # 4 - 231 Encino Ave (Significance Only)
PPT Item # 4 - 231 Encino Ave (Significance Only)ahcitycouncil
 
2024: The FAR, Federal Acquisition Regulations - Part 27
2024: The FAR, Federal Acquisition Regulations - Part 272024: The FAR, Federal Acquisition Regulations - Part 27
2024: The FAR, Federal Acquisition Regulations - Part 27JSchaus & Associates
 
How the Congressional Budget Office Assists Lawmakers
How the Congressional Budget Office Assists LawmakersHow the Congressional Budget Office Assists Lawmakers
How the Congressional Budget Office Assists LawmakersCongressional Budget Office
 
2024: The FAR, Federal Acquisition Regulations - Part 28
2024: The FAR, Federal Acquisition Regulations - Part 282024: The FAR, Federal Acquisition Regulations - Part 28
2024: The FAR, Federal Acquisition Regulations - Part 28JSchaus & Associates
 
VIP Mumbai Call Girls Andheri West Just Call 9920874524 with A/C Room Cash on...
VIP Mumbai Call Girls Andheri West Just Call 9920874524 with A/C Room Cash on...VIP Mumbai Call Girls Andheri West Just Call 9920874524 with A/C Room Cash on...
VIP Mumbai Call Girls Andheri West Just Call 9920874524 with A/C Room Cash on...Garima Khatri
 
Fair Trash Reduction - West Hartford, CT
Fair Trash Reduction - West Hartford, CTFair Trash Reduction - West Hartford, CT
Fair Trash Reduction - West Hartford, CTaccounts329278
 
Powering Britain: Can we decarbonise electricity without disadvantaging poore...
Powering Britain: Can we decarbonise electricity without disadvantaging poore...Powering Britain: Can we decarbonise electricity without disadvantaging poore...
Powering Britain: Can we decarbonise electricity without disadvantaging poore...ResolutionFoundation
 
Lucknow 💋 Russian Call Girls Lucknow ₹7.5k Pick Up & Drop With Cash Payment 8...
Lucknow 💋 Russian Call Girls Lucknow ₹7.5k Pick Up & Drop With Cash Payment 8...Lucknow 💋 Russian Call Girls Lucknow ₹7.5k Pick Up & Drop With Cash Payment 8...
Lucknow 💋 Russian Call Girls Lucknow ₹7.5k Pick Up & Drop With Cash Payment 8...anilsa9823
 
Call Girls Service AECS Layout Just Call 7001305949 Enjoy College Girls Service
Call Girls Service AECS Layout Just Call 7001305949 Enjoy College Girls ServiceCall Girls Service AECS Layout Just Call 7001305949 Enjoy College Girls Service
Call Girls Service AECS Layout Just Call 7001305949 Enjoy College Girls Servicenarwatsonia7
 
CBO’s Recent Appeals for New Research on Health-Related Topics
CBO’s Recent Appeals for New Research on Health-Related TopicsCBO’s Recent Appeals for New Research on Health-Related Topics
CBO’s Recent Appeals for New Research on Health-Related TopicsCongressional Budget Office
 
##9711199012 Call Girls Delhi Rs-5000 UpTo 10 K Hauz Khas Whats Up Number
##9711199012 Call Girls Delhi Rs-5000 UpTo 10 K Hauz Khas  Whats Up Number##9711199012 Call Girls Delhi Rs-5000 UpTo 10 K Hauz Khas  Whats Up Number
##9711199012 Call Girls Delhi Rs-5000 UpTo 10 K Hauz Khas Whats Up NumberMs Riya
 
Club of Rome: Eco-nomics for an Ecological Civilization
Club of Rome: Eco-nomics for an Ecological CivilizationClub of Rome: Eco-nomics for an Ecological Civilization
Club of Rome: Eco-nomics for an Ecological CivilizationEnergy for One World
 

Recently uploaded (20)

Climate change and safety and health at work
Climate change and safety and health at workClimate change and safety and health at work
Climate change and safety and health at work
 
(NEHA) Bhosari Call Girls Just Call 7001035870 [ Cash on Delivery ] Pune Escorts
(NEHA) Bhosari Call Girls Just Call 7001035870 [ Cash on Delivery ] Pune Escorts(NEHA) Bhosari Call Girls Just Call 7001035870 [ Cash on Delivery ] Pune Escorts
(NEHA) Bhosari Call Girls Just Call 7001035870 [ Cash on Delivery ] Pune Escorts
 
Call Girls Service Race Course Road Just Call 7001305949 Enjoy College Girls ...
Call Girls Service Race Course Road Just Call 7001305949 Enjoy College Girls ...Call Girls Service Race Course Road Just Call 7001305949 Enjoy College Girls ...
Call Girls Service Race Course Road Just Call 7001305949 Enjoy College Girls ...
 
VIP High Class Call Girls Amravati Anushka 8250192130 Independent Escort Serv...
VIP High Class Call Girls Amravati Anushka 8250192130 Independent Escort Serv...VIP High Class Call Girls Amravati Anushka 8250192130 Independent Escort Serv...
VIP High Class Call Girls Amravati Anushka 8250192130 Independent Escort Serv...
 
Call Girls Bangalore Saanvi 7001305949 Independent Escort Service Bangalore
Call Girls Bangalore Saanvi 7001305949 Independent Escort Service BangaloreCall Girls Bangalore Saanvi 7001305949 Independent Escort Service Bangalore
Call Girls Bangalore Saanvi 7001305949 Independent Escort Service Bangalore
 
Incident Command System xxxxxxxxxxxxxxxxxxxxxxxxx
Incident Command System xxxxxxxxxxxxxxxxxxxxxxxxxIncident Command System xxxxxxxxxxxxxxxxxxxxxxxxx
Incident Command System xxxxxxxxxxxxxxxxxxxxxxxxx
 
PPT Item # 4 - 231 Encino Ave (Significance Only)
PPT Item # 4 - 231 Encino Ave (Significance Only)PPT Item # 4 - 231 Encino Ave (Significance Only)
PPT Item # 4 - 231 Encino Ave (Significance Only)
 
2024: The FAR, Federal Acquisition Regulations - Part 27
2024: The FAR, Federal Acquisition Regulations - Part 272024: The FAR, Federal Acquisition Regulations - Part 27
2024: The FAR, Federal Acquisition Regulations - Part 27
 
How the Congressional Budget Office Assists Lawmakers
How the Congressional Budget Office Assists LawmakersHow the Congressional Budget Office Assists Lawmakers
How the Congressional Budget Office Assists Lawmakers
 
2024: The FAR, Federal Acquisition Regulations - Part 28
2024: The FAR, Federal Acquisition Regulations - Part 282024: The FAR, Federal Acquisition Regulations - Part 28
2024: The FAR, Federal Acquisition Regulations - Part 28
 
VIP Mumbai Call Girls Andheri West Just Call 9920874524 with A/C Room Cash on...
VIP Mumbai Call Girls Andheri West Just Call 9920874524 with A/C Room Cash on...VIP Mumbai Call Girls Andheri West Just Call 9920874524 with A/C Room Cash on...
VIP Mumbai Call Girls Andheri West Just Call 9920874524 with A/C Room Cash on...
 
Fair Trash Reduction - West Hartford, CT
Fair Trash Reduction - West Hartford, CTFair Trash Reduction - West Hartford, CT
Fair Trash Reduction - West Hartford, CT
 
Powering Britain: Can we decarbonise electricity without disadvantaging poore...
Powering Britain: Can we decarbonise electricity without disadvantaging poore...Powering Britain: Can we decarbonise electricity without disadvantaging poore...
Powering Britain: Can we decarbonise electricity without disadvantaging poore...
 
Lucknow 💋 Russian Call Girls Lucknow ₹7.5k Pick Up & Drop With Cash Payment 8...
Lucknow 💋 Russian Call Girls Lucknow ₹7.5k Pick Up & Drop With Cash Payment 8...Lucknow 💋 Russian Call Girls Lucknow ₹7.5k Pick Up & Drop With Cash Payment 8...
Lucknow 💋 Russian Call Girls Lucknow ₹7.5k Pick Up & Drop With Cash Payment 8...
 
Call Girls Service AECS Layout Just Call 7001305949 Enjoy College Girls Service
Call Girls Service AECS Layout Just Call 7001305949 Enjoy College Girls ServiceCall Girls Service AECS Layout Just Call 7001305949 Enjoy College Girls Service
Call Girls Service AECS Layout Just Call 7001305949 Enjoy College Girls Service
 
Delhi Russian Call Girls In Connaught Place ➡️9999965857 India's Finest Model...
Delhi Russian Call Girls In Connaught Place ➡️9999965857 India's Finest Model...Delhi Russian Call Girls In Connaught Place ➡️9999965857 India's Finest Model...
Delhi Russian Call Girls In Connaught Place ➡️9999965857 India's Finest Model...
 
9953330565 Low Rate Call Girls In Adarsh Nagar Delhi NCR
9953330565 Low Rate Call Girls In Adarsh Nagar Delhi NCR9953330565 Low Rate Call Girls In Adarsh Nagar Delhi NCR
9953330565 Low Rate Call Girls In Adarsh Nagar Delhi NCR
 
CBO’s Recent Appeals for New Research on Health-Related Topics
CBO’s Recent Appeals for New Research on Health-Related TopicsCBO’s Recent Appeals for New Research on Health-Related Topics
CBO’s Recent Appeals for New Research on Health-Related Topics
 
##9711199012 Call Girls Delhi Rs-5000 UpTo 10 K Hauz Khas Whats Up Number
##9711199012 Call Girls Delhi Rs-5000 UpTo 10 K Hauz Khas  Whats Up Number##9711199012 Call Girls Delhi Rs-5000 UpTo 10 K Hauz Khas  Whats Up Number
##9711199012 Call Girls Delhi Rs-5000 UpTo 10 K Hauz Khas Whats Up Number
 
Club of Rome: Eco-nomics for an Ecological Civilization
Club of Rome: Eco-nomics for an Ecological CivilizationClub of Rome: Eco-nomics for an Ecological Civilization
Club of Rome: Eco-nomics for an Ecological Civilization
 

SLCPD CompStat no.50 (week ending 12 17-17)

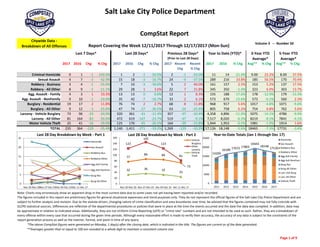
  • 1. Salt Lake City Police Department   2017 2016 Chg % Chg 2017 2016 Chg % Chg 2017 Recent  Chg Recent % Chg 2017 2016 % Chg Avg** % Chg Avg** % Chg Criminal Homicide 0 1 ‐1 ‐100.0% 1 2 ‐1 ‐50.0% 2 ‐1 ‐50.0% 11 14 ‐21.4% 9.00 22.2% 8.00 37.5% Sexual Assault 4 7 ‐3 ‐42.9% 15 18 ‐3 ‐16.7% 24 ‐9 ‐37.5% 289 216 33.8% 185 56.5% 170 70.4% Robbery ‐ Business 3 4 ‐1 ‐25.0% 7 10 ‐3 ‐30.0% 5 2 40.0% 161 157 2.5% 153 5.2% 137 17.5% Robbery ‐ All Other 8 9 ‐1 ‐11.1% 29 28 1 3.6% 22 7 31.8% 345 350 ‐1.4% 323 6.9% 303 13.7% Agg. Assault ‐ Family 4 3 1 33.3% 13 13 0 0.0% 12 1 8.3% 155 188 ‐17.6% 178 ‐12.9% 179 ‐13.3% Agg. Assault ‐ NonFamily 9 10 ‐1 ‐10.0% 35 42 ‐7 ‐16.7% 33 2 6.1% 573 679 ‐15.6% 573 ‐0.1% 560 2.3% Burglary ‐ Residential 19 17 2 11.8% 76 74 2 2.7% 68 8 11.8% 968 917 5.6% 1017 ‐4.8% 1071 ‐9.6% Burglary ‐ All Other 9 12 ‐3 ‐25.0% 47 74 ‐27 ‐36.5% 63 ‐16 ‐25.4% 805 758 6.2% 754 6.8% 762 5.6% Larceny ‐ Vehicle Burglary 73 96 ‐23 ‐24.0% 320 361 ‐41 ‐11.4% 357 ‐37 ‐10.4% 4,358 4,896 ‐11.0% 5075 ‐14.1% 4786 ‐9.0% Larceny ‐ All Other 81 164 ‐83 ‐50.6% 472 619 ‐147 ‐23.7% 519 ‐47 ‐9.1% 7,517 8,020 ‐6.3% 8219 ‐8.5% 7841 ‐4.1% Motor Vehicle Theft 25 41 ‐16 ‐39.0% 125 170 ‐45 ‐26.5% 164 ‐39 ‐23.8% 1,944 1,953 ‐0.5% 1981 ‐1.9% 1914 1.6% TOTAL 235 364 ‐129 ‐35.4% 1,140 1,411 ‐271 ‐19.2% 1,269 ‐129 ‐10.2% 17,126 18,148 ‐5.6% 18465 ‐7.3% 17731 ‐3.4% Nov 20Nov 27 Dec 04Dec 11‐Dec 2011 2012 2013 2014 2015 2016 2017 Homicide 0 1 0 0 8 6 7 7 6 14 11 Sex Assault 2 3 6 4 152 158 136 158 180 216 289 Robbery ‐ Business 1 1 2 3 116 91 135 143 159 157 161 Robbery ‐ All Other 6 10 5 8 256 253 296 309 309 350 345 Aggravated Assault ‐ Family 5 3 1 4 151 164 196 154 192 188 155 Aggravated Assault ‐ All Other 12 8 6 9 478 559 522 500 541 679 573 Burglary ‐ Residential 23 21 13 19 1046 989 1316 987 1146 917 968 Burglary ‐ All Other 13 11 14 9 571 819 730 691 812 758 805 Larceny ‐ Vehicle Burglary 77 86 84 73 3995 4585 4123 4895 5433 4896 4358 Larceny ‐ All Other 123 145 123 81 5934 6848 7702 8176 8461 8020 7517 Vehicle Theft 32 36 32 25 1502 1717 1909 1785 2204 1953 1944 TOTALS 294 325 286 235 14209 16189 17072 17805 19443 18148 17126 Year‐to‐Date Totals (Jan 1 through Dec 17) Note: Charts may erroneously show an apparent drop in the most current data due to some cases not yet having been reported and/or recorded. The figures included in this report are preliminary figures for general situational awareness and trend purposes only. They do not represent the official figures of the Salt Lake City Police Department and are  subject to further analysis and revision. Due to the statute‐driven, changing nature of crime classification and area boundaries over time, be advised that the figures contained may not fully coincide with  SLCPD statistical sources. Differences are reflective of the departmental procedures or policies that were in place at the time the events occurred and the date the data was compiled. In addition, data may  be approximate in relation to indicated areas. Additionally, they are not Uniform Crime Reporting (UCR) or "crime rate" numbers and are not intended to be used as such. Rather, they are a breakdown of  every offense within every case that occurred during the given time periods. Although every reasonable effort is made to verify their accuracy, the accuracy of any data is subject to the constraints of the  report generation process as well as the manner, format, and point in time of any query.   *The above CompStat figures were generated on Monday, 1 day(s) after the closing date, which is indicated in the title. The figures are current as of the date generated. CompStat Report……. Citywide Data ‐  Breakdown of All Offenses Volume 3   ‐‐  Number 50 Last 7 Days* Last 28 Days* Previous 28 Days* (Prior to Last 28 Days) Year to Date (YTD)* 3‐Year YTD Average* 5‐Year YTD Average* **Averages greater than or equal to 100 are rounded to a whole digit to maintain a consistent column size. Report Covering the Week 12/11/2017 Through 12/17/2017 (Mon‐Sun) 0 5 10 15 20 25 Nov 20‐Nov 26Nov 27‐Dec 03Dec 04‐Dec 10Dec 11‐Dec 17 Last 28 Day Breakdown by Week ‐ Part 1 Homicide Sex Assault Robbery‐Bus. Robbery‐Other Agg Aslt‐Family Agg Aslt‐NonFam Burg‐Res Burg‐All Other 14209 16189 17072 17805 19443 18148 17126 0 5000 10000 15000 20000 25000 2011 2012 2013 2014 2015 2016 2017 Year‐to‐Date Totals (Jan 1 through Dec 17) Homicide Sex Assault Robbery‐Bus. Robbery‐Other Agg Aslt‐Family Agg Aslt‐NonFam Burg‐Res Burg‐All Other Larc‐Veh Burg Larc‐All Other Vehicle Theft 77 86 84 73 123 145 123 81 32 36 32 25 0 20 40 60 80 100 120 140 160 Nov 20‐Nov 26 Nov 27‐Dec 03 Dec 04‐Dec 10 Dec 11‐Dec 17 Last 28 Day Breakdown by Week ‐ Part 2 Vehicle Burglary Other Larceny Vehicle Theft Page 1 of 9 
  • 2. Salt Lake City Police Department   2017 2016 Chg % Chg 2017 2016 Chg % Chg 2017 Recent  Chg Recent % Chg 2017 2016 % Chg Avg** % Chg Avg** % Chg Criminal Homicide 0 0 0 /0 0 0 0 /0 0 0 /0 3 1 200.0% 1.00 200.0% 1.00 200.0% Sexual Assault 1 1 0 0.0% 5 2 3 150.0% 6 ‐1 ‐16.7% 54 44 22.7% 42.33 27.6% 32.60 65.6% Robbery ‐ Business 0 1 ‐1 ‐100.0% 0 1 ‐1 ‐100.0% 0 0 /0 20 20 0.0% 18.67 7.1% 16.20 23.5% Robbery ‐ All Other 2 4 ‐2 ‐50.0% 8 11 ‐3 ‐27.3% 6 2 33.3% 122 139 ‐12.2% 131 ‐6.9% 113 8.0% Agg. Assault ‐ Family 1 0 1 /0 2 0 2 /0 1 1 100.0% 14 11 27.3% 13.00 7.7% 11.20 25.0% Agg. Assault ‐ NonFamily 0 4 ‐4 ‐100.0% 4 12 ‐8 ‐66.7% 7 ‐3 ‐42.9% 166 195 ‐14.9% 175 ‐5.1% 162 2.3% Burglary ‐ Residential 0 0 0 /0 2 0 2 /0 4 ‐2 ‐50.0% 45 28 60.7% 26.33 70.9% 25.00 80.0% Burglary ‐ All Other 3 0 3 /0 5 3 2 66.7% 3 2 66.7% 84 87 ‐3.4% 72.67 15.6% 73.60 14.1% Larceny ‐ Vehicle Burglary 7 17 ‐10 ‐58.8% 36 76 ‐40 ‐52.6% 55 ‐19 ‐34.5% 635 771 ‐17.6% 769 ‐17.4% 821 ‐22.6% Larceny ‐ All Other 8 21 ‐13 ‐61.9% 68 95 ‐27 ‐28.4% 66 2 3.0% 1,207 1,360 ‐11.3% 1351 ‐10.7% 1270 ‐4.9% Motor Vehicle Theft 1 3 ‐2 ‐66.7% 10 10 0 0.0% 11 ‐1 ‐9.1% 175 167 4.8% 176 ‐0.4% 160 9.5% TOTAL 23 51 ‐28 ‐54.9% 140 210 ‐70 ‐33.3% 159 ‐19 ‐11.9% 2,525 2,823 ‐10.6% 2776 ‐9.0% 2685 ‐6.0% Nov 20Nov 27 Dec 04Dec 11‐Dec 2011 2012 2013 2014 2015 2016 2017 Homicide 0 0 0 0 2 1 1 2 0 1 3 Sex Assault 1 0 3 1 25 18 18 41 42 44 54 Robbery ‐ Business 0 0 0 0 15 10 15 14 22 20 20 Robbery ‐ All Other 2 2 2 2 62 68 104 118 136 139 122 Aggravated Assault ‐ Family 0 1 0 1 6 9 8 13 15 11 14 Aggravated Assault ‐ All Other 3 0 1 0 128 134 152 158 172 195 166 Burglary ‐ Residential 2 0 0 0 24 26 20 21 30 28 45 Burglary ‐ All Other 1 1 0 3 40 78 72 66 65 87 84 Larceny ‐ Vehicle Burglary 13 5 11 7 756 1037 760 684 852 771 635 Larceny ‐ All Other 16 20 24 8 799 997 1299 1311 1382 1360 1207 Vehicle Theft 6 1 2 1 142 124 148 149 211 167 175 TOTALS 44 30 43 23 1999 2502 2597 2577 2927 2823 2525 Year‐to‐Date Totals (Jan 1 through Dec 17) Note: Charts may erroneously show an apparent drop in the most current data due to some cases not yet having been reported and/or recorded. The figures included in this report are preliminary figures for general situational awareness and trend purposes only. They do not represent the official figures of the Salt Lake City Police Department and are  subject to further analysis and revision. Due to the statute‐driven, changing nature of crime classification and area boundaries over time, be advised that the figures contained may not fully coincide with  SLCPD statistical sources. Differences are reflective of the departmental procedures or policies that were in place at the time the events occurred and the date the data was compiled. In addition, data may  be approximate in relation to indicated areas. Additionally, they are not Uniform Crime Reporting (UCR) or "crime rate" numbers and are not intended to be used as such. Rather, they are a breakdown of  every offense within every case that occurred during the given time periods. Although every reasonable effort is made to verify their accuracy, the accuracy of any data is subject to the constraints of the  report generation process as well as the manner, format, and point in time of any query.   *The above CompStat figures were generated on Monday, 1 day(s) after the closing date, which is indicated in the title. The figures are current as of the date generated. **Averages greater than or equal to 100 are rounded to a whole digit to maintain a consistent column size. ***The Rio Grande District is defined as the area from North Temple to 700 South and State Street to I‐15. However, this area overlaps other districts covered with the SLCPD CompStat Report, namely  parts of Districts 3 & 4. As a result, the data contained within the Rio Grande District may also be listed in the data for other areas. CompStat Report……. Rio Grande District*** Breakdown of All Offenses Report Covering the Week 12/11/2017 Through 12/17/2017 (Mon‐Sun) Volume 3   ‐‐  Number 50 Last 7 Days* Last 28 Days* Previous 28 Days* (Prior to Last 28 Days) Year to Date (YTD)* 3‐Year YTD Average* 5‐Year YTD Average* 0 1 2 3 4 Nov 20‐Nov 26Nov 27‐Dec 03Dec 04‐Dec 10Dec 11‐Dec 17 Last 28 Day Breakdown by Week ‐ Part 1 Homicide Sex Assault Robbery‐Bus. Robbery‐Other Agg Aslt‐Family Agg Aslt‐NonFam Burg‐Res Burg‐All Other 1999 2502 2597 2577 2927 2823 2525 0 500 1000 1500 2000 2500 3000 3500 2011 2012 2013 2014 2015 2016 2017 Year‐to‐Date Totals (Jan 1 through Dec 17) Homicide Sex Assault Robbery‐Bus. Robbery‐Other Agg Aslt‐Family Agg Aslt‐NonFam Burg‐Res Burg‐All Other Larc‐Veh Burg Larc‐All Other Vehicle Theft 0 5 10 15 20 25 30 Nov 20‐Nov 26 Nov 27‐Dec 03 Dec 04‐Dec 10 Dec 11‐Dec 17 Last 28 Day Breakdown by Week ‐ Part 2 Vehicle Burglary Other Larceny Vehicle Theft Page 2 of 9 
  • 3. Salt Lake City Police Department   2017 2016 Chg % Chg 2017 2016 Chg % Chg 2017 Recent  Chg Recent % Chg 2017 2016 % Chg Avg** % Chg Avg** % Chg Criminal Homicide 0 0 0 /0 0 1 ‐1 ‐100.0% 0 0 /0 0 5 ‐100.0% 2.33 ‐100.0% 1.60 ‐100.0% Sexual Assault 1 0 1 /0 4 2 2 100.0% 0 4 /0 31 17 82.4% 15.67 97.9% 15.00 106.7% Robbery ‐ Business 0 1 ‐1 ‐100.0% 0 2 ‐2 ‐100.0% 0 0 /0 11 14 ‐21.4% 12.00 ‐8.3% 9.40 17.0% Robbery ‐ All Other 1 1 0 0.0% 5 6 ‐1 ‐16.7% 2 3 150.0% 30 32 ‐6.3% 32.33 ‐7.2% 29.40 2.0% Agg. Assault ‐ Family 0 0 0 /0 1 3 ‐2 ‐66.7% 2 ‐1 ‐50.0% 28 48 ‐41.7% 40.33 ‐30.6% 38.80 ‐27.8% Agg. Assault ‐ NonFamily 0 1 ‐1 ‐100.0% 5 4 1 25.0% 4 1 25.0% 57 69 ‐17.4% 58.67 ‐2.8% 63.80 ‐10.7% Burglary ‐ Residential 4 3 1 33.3% 8 16 ‐8 ‐50.0% 10 ‐2 ‐20.0% 110 104 5.8% 133 ‐17.3% 157 ‐29.8% Burglary ‐ All Other 1 1 0 0.0% 5 6 ‐1 ‐16.7% 5 0 0.0% 51 47 8.5% 50.67 0.7% 55.40 ‐7.9% Larceny ‐ Vehicle Burglary 2 9 ‐7 ‐77.8% 12 25 ‐13 ‐52.0% 26 ‐14 ‐53.8% 332 362 ‐8.3% 404 ‐17.9% 377 ‐12.0% Larceny ‐ All Other 5 8 ‐3 ‐37.5% 26 37 ‐11 ‐29.7% 16 10 62.5% 370 444 ‐16.7% 474 ‐21.9% 483 ‐23.5% Motor Vehicle Theft 6 5 1 20.0% 18 27 ‐9 ‐33.3% 32 ‐14 ‐43.8% 264 272 ‐2.9% 292 ‐9.7% 302 ‐12.7% TOTAL 20 29 ‐9 ‐31.0% 84 129 ‐45 ‐34.9% 97 ‐13 ‐13.4% 1,284 1,414 ‐9.2% 1515 ‐15.3% 1533 ‐16.3% Nov 20Nov 27 Dec 04Dec 11‐Dec 2011 2012 2013 2014 2015 2016 2017 Homicide 0 0 0 0 1 0 1 0 2 5 0 Sex Assault 1 1 1 1 15 14 14 11 19 17 31 Robbery ‐ Business 0 0 0 0 3 4 7 8 14 14 11 Robbery ‐ All Other 1 2 1 1 21 26 24 36 29 32 30 Aggravated Assault ‐ Family 1 0 0 0 38 31 42 30 43 48 28 Aggravated Assault ‐ All Other 2 2 1 0 54 72 71 51 56 69 57 Burglary ‐ Residential 0 2 2 4 122 142 243 139 156 104 110 Burglary ‐ All Other 1 1 2 1 39 55 70 42 63 47 51 Larceny ‐ Vehicle Burglary 4 4 2 2 301 334 339 431 420 362 332 Larceny ‐ All Other 9 7 5 5 483 513 483 470 507 444 370 Vehicle Theft 3 5 4 6 273 277 358 300 305 272 264 TOTALS 22 24 18 20 1350 1468 1652 1518 1614 1414 1284 Year‐to‐Date Totals (Jan 1 through Dec 17) Note: Charts may erroneously show an apparent drop in the most current data due to some cases not yet having been reported and/or recorded. The figures included in this report are preliminary figures for general situational awareness and trend purposes only. They do not represent the official figures of the Salt Lake City Police Department and are  subject to further analysis and revision. Due to the statute‐driven, changing nature of crime classification and area boundaries over time, be advised that the figures contained may not fully coincide with  SLCPD statistical sources. Differences are reflective of the departmental procedures or policies that were in place at the time the events occurred and the date the data was compiled. In addition, data may  be approximate in relation to indicated areas. Additionally, they are not Uniform Crime Reporting (UCR) or "crime rate" numbers and are not intended to be used as such. Rather, they are a breakdown of  every offense within every case that occurred during the given time periods. Although every reasonable effort is made to verify their accuracy, the accuracy of any data is subject to the constraints of the  report generation process as well as the manner, format, and point in time of any query.   CompStat Report……. Council District 1 ‐  Breakdown of All Offenses *The above CompStat figures were generated on Monday, 1 day(s) after the closing date, which is indicated in the title. The figures are current as of the date generated. Last 7 Days* Last 28 Days* Previous 28 Days* (Prior to Last 28 Days) Year to Date (YTD)* 3‐Year YTD Average* 5‐Year YTD Average* Volume 3   ‐‐  Number 50 **Averages greater than or equal to 100 are rounded to a whole digit to maintain a consistent column size. Report Covering the Week 12/11/2017 Through 12/17/2017 (Mon‐Sun) 0 1 2 3 4 5 Nov 20‐Nov 26Nov 27‐Dec 03Dec 04‐Dec 10Dec 11‐Dec 17 Last 28 Day Breakdown by Week ‐ Part 1 Homicide Sex Assault Robbery‐Bus. Robbery‐Other Agg Aslt‐Family Agg Aslt‐NonFam Burg‐Res Burg‐All Other 1350 1468 1652 1518 1614 1414 1284 0 200 400 600 800 1000 1200 1400 1600 1800 2011 2012 2013 2014 2015 2016 2017 Year‐to‐Date Totals (Jan 1 through Dec 17) Homicide Sex Assault Robbery‐Bus. Robbery‐Other Agg Aslt‐Family Agg Aslt‐NonFam Burg‐Res Burg‐All Other Larc‐Veh Burg Larc‐All Other Vehicle Theft 0 1 2 3 4 5 6 7 8 9 10 Nov 20‐Nov 26 Nov 27‐Dec 03 Dec 04‐Dec 10 Dec 11‐Dec 17 Last 28 Day Breakdown by Week ‐ Part 2 Vehicle Burglary Other Larceny Vehicle Theft Page 3 of 9 
  • 4. Salt Lake City Police Department   2017 2016 Chg % Chg 2017 2016 Chg % Chg 2017 Recent  Chg Recent % Chg 2017 2016 % Chg Avg** % Chg Avg** % Chg Criminal Homicide 0 0 0 /0 1 0 1 /0 2 ‐1 ‐50.0% 3 4 ‐25.0% 3.00 0.0% 2.60 15.4% Sexual Assault 1 1 0 0.0% 2 1 1 100.0% 1 1 100.0% 36 30 20.0% 23.33 54.3% 21.80 65.1% Robbery ‐ Business 1 1 0 0.0% 1 2 ‐1 ‐50.0% 2 ‐1 ‐50.0% 29 25 16.0% 26.67 8.7% 24.80 16.9% Robbery ‐ All Other 1 1 0 0.0% 4 1 3 300.0% 8 ‐4 ‐50.0% 77 50 54.0% 48.33 59.3% 48.40 59.1% Agg. Assault ‐ Family 2 1 1 100.0% 5 2 3 150.0% 3 2 66.7% 50 49 2.0% 47.33 5.6% 46.20 8.2% Agg. Assault ‐ NonFamily 3 0 3 /0 5 4 1 25.0% 6 ‐1 ‐16.7% 116 125 ‐7.2% 104 11.9% 93.80 23.7% Burglary ‐ Residential 4 3 1 33.3% 12 14 ‐2 ‐14.3% 11 1 9.1% 145 108 34.3% 131 10.4% 154 ‐6.0% Burglary ‐ All Other 0 4 ‐4 ‐100.0% 12 18 ‐6 ‐33.3% 8 4 50.0% 152 171 ‐11.1% 185 ‐18.0% 176 ‐13.7% Larceny ‐ Vehicle Burglary 5 8 ‐3 ‐37.5% 30 37 ‐7 ‐18.9% 44 ‐14 ‐31.8% 493 605 ‐18.5% 565 ‐12.8% 536 ‐8.0% Larceny ‐ All Other 10 30 ‐20 ‐66.7% 73 81 ‐8 ‐9.9% 96 ‐23 ‐24.0% 1,088 1,103 ‐1.4% 1162 ‐6.4% 1156 ‐5.8% Motor Vehicle Theft 9 9 0 0.0% 24 44 ‐20 ‐45.5% 41 ‐17 ‐41.5% 418 440 ‐5.0% 417 0.2% 409 2.3% TOTAL 36 58 ‐22 ‐37.9% 169 204 ‐35 ‐17.2% 222 ‐53 ‐23.9% 2,607 2,710 ‐3.8% 2714 ‐3.9% 2668 ‐2.3% Nov 20Nov 27 Dec 04Dec 11‐Dec 2011 2012 2013 2014 2015 2016 2017 Homicide 0 1 0 0 1 3 1 4 1 4 3 Sex Assault 0 1 0 1 18 26 13 20 20 30 36 Robbery ‐ Business 0 0 0 1 26 16 28 25 30 25 29 Robbery ‐ All Other 1 2 0 1 48 47 50 51 44 50 77 Aggravated Assault ‐ Family 0 2 1 2 34 46 43 38 55 49 50 Aggravated Assault ‐ All Other 2 0 0 3 76 90 68 96 90 125 116 Burglary ‐ Residential 2 2 4 4 199 152 225 145 141 108 145 Burglary ‐ All Other 5 2 5 0 179 172 153 163 222 171 152 Larceny ‐ Vehicle Burglary 8 9 8 5 549 452 531 509 582 605 493 Larceny ‐ All Other 20 25 18 10 1272 1130 1162 1202 1181 1103 1088 Vehicle Theft 3 8 4 9 351 393 399 351 461 440 418 TOTALS 41 52 40 36 2753 2527 2673 2604 2827 2710 2607 Year‐to‐Date Totals (Jan 1 through Dec 17) Note: Charts may erroneously show an apparent drop in the most current data due to some cases not yet having been reported and/or recorded. The figures included in this report are preliminary figures for general situational awareness and trend purposes only. They do not represent the official figures of the Salt Lake City Police Department and are  subject to further analysis and revision. Due to the statute‐driven, changing nature of crime classification and area boundaries over time, be advised that the figures contained may not fully coincide with  SLCPD statistical sources. Differences are reflective of the departmental procedures or policies that were in place at the time the events occurred and the date the data was compiled. In addition, data may  be approximate in relation to indicated areas. Additionally, they are not Uniform Crime Reporting (UCR) or "crime rate" numbers and are not intended to be used as such. Rather, they are a breakdown of  every offense within every case that occurred during the given time periods. Although every reasonable effort is made to verify their accuracy, the accuracy of any data is subject to the constraints of the  report generation process as well as the manner, format, and point in time of any query.   CompStat Report……. Council District 2 ‐  Breakdown of All Offenses *The above CompStat figures were generated on Monday, 1 day(s) after the closing date, which is indicated in the title. The figures are current as of the date generated. Last 7 Days* Last 28 Days* Previous 28 Days* (Prior to Last 28 Days) Year to Date (YTD)* 3‐Year YTD Average* 5‐Year YTD Average* Volume 3   ‐‐  Number 50 **Averages greater than or equal to 100 are rounded to a whole digit to maintain a consistent column size. Report Covering the Week 12/11/2017 Through 12/17/2017 (Mon‐Sun) 0 1 2 3 4 5 6 Nov 20‐Nov 26Nov 27‐Dec 03Dec 04‐Dec 10Dec 11‐Dec 17 Last 28 Day Breakdown by Week ‐ Part 1 Homicide Sex Assault Robbery‐Bus. Robbery‐Other Agg Aslt‐Family Agg Aslt‐NonFam Burg‐Res Burg‐All Other 2753 2527 2673 2604 2827 2710 2607 0 500 1000 1500 2000 2500 3000 2011 2012 2013 2014 2015 2016 2017 Year‐to‐Date Totals (Jan 1 through Dec 17) Homicide Sex Assault Robbery‐Bus. Robbery‐Other Agg Aslt‐Family Agg Aslt‐NonFam Burg‐Res Burg‐All Other Larc‐Veh Burg Larc‐All Other Vehicle Theft 0 5 10 15 20 25 30 Nov 20‐Nov 26 Nov 27‐Dec 03 Dec 04‐Dec 10 Dec 11‐Dec 17 Last 28 Day Breakdown by Week ‐ Part 2 Vehicle Burglary Other Larceny Vehicle Theft Page 4 of 9 
  • 5. Salt Lake City Police Department   2017 2016 Chg % Chg 2017 2016 Chg % Chg 2017 Recent  Chg Recent % Chg 2017 2016 % Chg Avg** % Chg Avg** % Chg Criminal Homicide 0 1 ‐1 ‐100.0% 0 1 ‐1 ‐100.0% 0 0 /0 0 3 ‐100.0% 1.00 ‐100.0% 0.80 ‐100.0% Sexual Assault 0 1 ‐1 ‐100.0% 2 2 0 0.0% 3 ‐1 ‐33.3% 26 15 73.3% 14.67 77.3% 14.80 75.7% Robbery ‐ Business 0 0 0 /0 0 0 0 /0 0 0 /0 8 4 100.0% 5.00 60.0% 4.80 66.7% Robbery ‐ All Other 1 0 1 /0 3 0 3 /0 0 3 /0 23 17 35.3% 15.00 53.3% 14.00 64.3% Agg. Assault ‐ Family 0 1 ‐1 ‐100.0% 2 3 ‐1 ‐33.3% 3 ‐1 ‐33.3% 15 24 ‐37.5% 13.33 12.5% 12.60 19.0% Agg. Assault ‐ NonFamily 0 3 ‐3 ‐100.0% 3 5 ‐2 ‐40.0% 3 0 0.0% 44 47 ‐6.4% 34.67 26.9% 30.80 42.9% Burglary ‐ Residential 5 2 3 150.0% 12 9 3 33.3% 7 5 71.4% 156 137 13.9% 151 3.3% 147 6.0% Burglary ‐ All Other 0 4 ‐4 ‐100.0% 3 10 ‐7 ‐70.0% 8 ‐5 ‐62.5% 91 93 ‐2.2% 80.33 13.3% 77.80 17.0% Larceny ‐ Vehicle Burglary 14 19 ‐5 ‐26.3% 52 63 ‐11 ‐17.5% 53 ‐1 ‐1.9% 611 687 ‐11.1% 730 ‐16.3% 636 ‐3.9% Larceny ‐ All Other 5 20 ‐15 ‐75.0% 24 48 ‐24 ‐50.0% 26 ‐2 ‐7.7% 400 433 ‐7.6% 460 ‐13.0% 441 ‐9.2% Motor Vehicle Theft 1 4 ‐3 ‐75.0% 5 8 ‐3 ‐37.5% 13 ‐8 ‐61.5% 211 201 5.0% 193 9.3% 187 12.7% TOTAL 26 55 ‐29 ‐52.7% 106 149 ‐43 ‐28.9% 116 ‐10 ‐8.6% 1,585 1,661 ‐4.6% 1698 ‐6.7% 1566 1.2% Nov 20Nov 27 Dec 04Dec 11‐Dec 2011 2012 2013 2014 2015 2016 2017 Homicide 0 0 0 0 1 1 0 0 0 3 0 Sex Assault 0 0 2 0 24 16 14 11 18 15 26 Robbery ‐ Business 0 0 0 0 13 5 4 9 2 4 8 Robbery ‐ All Other 0 0 2 1 17 6 19 14 14 17 23 Aggravated Assault ‐ Family 2 0 0 0 9 9 14 8 8 24 15 Aggravated Assault ‐ All Other 2 1 0 0 30 30 20 24 33 47 44 Burglary ‐ Residential 6 1 0 5 140 122 161 142 174 137 156 Burglary ‐ All Other 1 1 1 0 53 66 82 85 63 93 91 Larceny ‐ Vehicle Burglary 8 11 19 14 426 472 515 785 719 687 611 Larceny ‐ All Other 4 11 4 5 394 402 422 491 455 433 400 Vehicle Theft 1 0 3 1 167 184 173 164 214 201 211 TOTALS 24 25 31 26 1274 1313 1424 1733 1700 1661 1585 Year‐to‐Date Totals (Jan 1 through Dec 17) Note: Charts may erroneously show an apparent drop in the most current data due to some cases not yet having been reported and/or recorded. The figures included in this report are preliminary figures for general situational awareness and trend purposes only. They do not represent the official figures of the Salt Lake City Police Department and are  subject to further analysis and revision. Due to the statute‐driven, changing nature of crime classification and area boundaries over time, be advised that the figures contained may not fully coincide with  SLCPD statistical sources. Differences are reflective of the departmental procedures or policies that were in place at the time the events occurred and the date the data was compiled. In addition, data may  be approximate in relation to indicated areas. Additionally, they are not Uniform Crime Reporting (UCR) or "crime rate" numbers and are not intended to be used as such. Rather, they are a breakdown of  every offense within every case that occurred during the given time periods. Although every reasonable effort is made to verify their accuracy, the accuracy of any data is subject to the constraints of the  report generation process as well as the manner, format, and point in time of any query.   CompStat Report……. Council District 3 ‐  Breakdown of All Offenses *The above CompStat figures were generated on Monday, 1 day(s) after the closing date, which is indicated in the title. The figures are current as of the date generated. Last 7 Days* Last 28 Days* Previous 28 Days* (Prior to Last 28 Days) Year to Date (YTD)* 3‐Year YTD Average* 5‐Year YTD Average* Volume 3   ‐‐  Number 50 **Averages greater than or equal to 100 are rounded to a whole digit to maintain a consistent column size. Report Covering the Week 12/11/2017 Through 12/17/2017 (Mon‐Sun) 0 1 2 3 4 5 6 7 Nov 20‐Nov 26Nov 27‐Dec 03Dec 04‐Dec 10Dec 11‐Dec 17 Last 28 Day Breakdown by Week ‐ Part 1 Homicide Sex Assault Robbery‐Bus. Robbery‐Other Agg Aslt‐Family Agg Aslt‐NonFam Burg‐Res Burg‐All Other 1274 1313 1424 1733 1700 1661 1585 0 200 400 600 800 1000 1200 1400 1600 1800 2000 2011 2012 2013 2014 2015 2016 2017 Year‐to‐Date Totals (Jan 1 through Dec 17) Homicide Sex Assault Robbery‐Bus. Robbery‐Other Agg Aslt‐Family Agg Aslt‐NonFam Burg‐Res Burg‐All Other Larc‐Veh Burg Larc‐All Other Vehicle Theft0 2 4 6 8 10 12 14 16 18 20 Nov 20‐Nov 26 Nov 27‐Dec 03 Dec 04‐Dec 10 Dec 11‐Dec 17 Last 28 Day Breakdown by Week ‐ Part 2 Vehicle Burglary Other Larceny Vehicle Theft Page 5 of 9 
  • 6. Salt Lake City Police Department   2017 2016 Chg % Chg 2017 2016 Chg % Chg 2017 Recent  Chg Recent % Chg 2017 2016 % Chg Avg** % Chg Avg** % Chg Criminal Homicide 0 0 0 /0 0 0 0 /0 0 0 /0 5 2 150.0% 1.67 200.0% 1.40 257.1% Sexual Assault 1 3 ‐2 ‐66.7% 4 6 ‐2 ‐33.3% 11 ‐7 ‐63.6% 110 90 22.2% 76.00 44.7% 63.60 73.0% Robbery ‐ Business 0 2 ‐2 ‐100.0% 2 4 ‐2 ‐50.0% 1 1 100.0% 62 49 26.5% 44.67 38.8% 39.20 58.2% Robbery ‐ All Other 4 6 ‐2 ‐33.3% 11 16 ‐5 ‐31.3% 8 3 37.5% 149 166 ‐10.2% 155 ‐3.9% 140 6.7% Agg. Assault ‐ Family 1 0 1 /0 4 0 4 /0 1 3 300.0% 31 22 40.9% 27.67 12.0% 31.40 ‐1.3% Agg. Assault ‐ NonFamily 3 5 ‐2 ‐40.0% 10 23 ‐13 ‐56.5% 13 ‐3 ‐23.1% 227 275 ‐17.5% 240 ‐5.4% 225 1.0% Burglary ‐ Residential 1 2 ‐1 ‐50.0% 13 9 4 44.4% 12 1 8.3% 183 170 7.6% 166 10.2% 167 9.8% Burglary ‐ All Other 3 1 2 200.0% 8 10 ‐2 ‐20.0% 19 ‐11 ‐57.9% 201 165 21.8% 175 14.6% 183 9.7% Larceny ‐ Vehicle Burglary 13 23 ‐10 ‐43.5% 69 93 ‐24 ‐25.8% 105 ‐36 ‐34.3% 1,246 1,228 1.5% 1392 ‐10.5% 1379 ‐9.6% Larceny ‐ All Other 24 41 ‐17 ‐41.5% 134 187 ‐53 ‐28.3% 137 ‐3 ‐2.2% 2,398 2,558 ‐6.3% 2617 ‐8.4% 2535 ‐5.4% Motor Vehicle Theft 1 8 ‐7 ‐87.5% 32 28 4 14.3% 38 ‐6 ‐15.8% 419 387 8.3% 406 3.1% 369 13.5% TOTAL 51 91 ‐40 ‐44.0% 287 376 ‐89 ‐23.7% 345 ‐58 ‐16.8% 5,031 5,112 ‐1.6% 5302 ‐5.1% 5133 ‐2.0% Nov 20Nov 27 Dec 04Dec 11‐Dec 2011 2012 2013 2014 2015 2016 2017 Homicide 0 0 0 0 2 1 1 3 0 2 5 Sex Assault 1 0 2 1 50 45 45 67 71 90 110 Robbery ‐ Business 0 0 2 0 30 26 36 36 49 49 62 Robbery ‐ All Other 2 3 2 4 90 106 127 140 159 166 149 Aggravated Assault ‐ Family 2 1 0 1 23 32 42 30 31 22 31 Aggravated Assault ‐ All Other 4 1 2 3 192 201 203 219 226 275 227 Burglary ‐ Residential 5 5 2 1 169 148 187 153 175 170 183 Burglary ‐ All Other 4 1 0 3 110 219 171 173 188 165 201 Larceny ‐ Vehicle Burglary 22 14 20 13 1134 1513 1205 1416 1533 1228 1246 Larceny ‐ All Other 34 34 42 24 1661 2086 2735 2669 2625 2558 2398 Vehicle Theft 12 11 8 1 267 280 347 346 486 387 419 TOTALS 86 70 80 51 3728 4657 5099 5252 5543 5112 5031 Year‐to‐Date Totals (Jan 1 through Dec 17) Note: Charts may erroneously show an apparent drop in the most current data due to some cases not yet having been reported and/or recorded. The figures included in this report are preliminary figures for general situational awareness and trend purposes only. They do not represent the official figures of the Salt Lake City Police Department and are  subject to further analysis and revision. Due to the statute‐driven, changing nature of crime classification and area boundaries over time, be advised that the figures contained may not fully coincide with  SLCPD statistical sources. Differences are reflective of the departmental procedures or policies that were in place at the time the events occurred and the date the data was compiled. In addition, data may  be approximate in relation to indicated areas. Additionally, they are not Uniform Crime Reporting (UCR) or "crime rate" numbers and are not intended to be used as such. Rather, they are a breakdown of  every offense within every case that occurred during the given time periods. Although every reasonable effort is made to verify their accuracy, the accuracy of any data is subject to the constraints of the  report generation process as well as the manner, format, and point in time of any query.   CompStat Report……. Council District 4 ‐  Breakdown of All Offenses *The above CompStat figures were generated on Monday, 1 day(s) after the closing date, which is indicated in the title. The figures are current as of the date generated. Last 7 Days* Last 28 Days* Previous 28 Days* (Prior to Last 28 Days) Year to Date (YTD)* 3‐Year YTD Average* 5‐Year YTD Average* Volume 3   ‐‐  Number 50 **Averages greater than or equal to 100 are rounded to a whole digit to maintain a consistent column size. Report Covering the Week 12/11/2017 Through 12/17/2017 (Mon‐Sun) 0 1 2 3 4 5 6 Nov 20‐Nov 26Nov 27‐Dec 03Dec 04‐Dec 10Dec 11‐Dec 17 Last 28 Day Breakdown by Week ‐ Part 1 Homicide Sex Assault Robbery‐Bus. Robbery‐Other Agg Aslt‐Family Agg Aslt‐NonFam Burg‐Res Burg‐All Other 3728 4657 5099 5252 5543 5112 5031 0 1000 2000 3000 4000 5000 6000 2011 2012 2013 2014 2015 2016 2017 Year‐to‐Date Totals (Jan 1 through Dec 17) Homicide Sex Assault Robbery‐Bus. Robbery‐Other Agg Aslt‐Family Agg Aslt‐NonFam Burg‐Res Burg‐All Other Larc‐Veh Burg Larc‐All Other Vehicle Theft0 5 10 15 20 25 30 35 40 45 Nov 20‐Nov 26 Nov 27‐Dec 03 Dec 04‐Dec 10 Dec 11‐Dec 17 Last 28 Day Breakdown by Week ‐ Part 2 Vehicle Burglary Other Larceny Vehicle Theft Page 6 of 9 
  • 7. Salt Lake City Police Department   2017 2016 Chg % Chg 2017 2016 Chg % Chg 2017 Recent  Chg Recent % Chg 2017 2016 % Chg Avg** % Chg Avg** % Chg Criminal Homicide 0 0 0 /0 0 0 0 /0 0 0 /0 2 0 /0 0.67 200.0% 1.00 100.0% Sexual Assault 1 1 0 0.0% 2 5 ‐3 ‐60.0% 3 ‐1 ‐33.3% 52 44 18.2% 34.00 52.9% 30.20 72.2% Robbery ‐ Business 1 0 1 /0 1 2 ‐1 ‐50.0% 1 0 0.0% 31 32 ‐3.1% 29.67 4.5% 29.60 4.7% Robbery ‐ All Other 1 0 1 /0 5 3 2 66.7% 1 4 400.0% 47 56 ‐16.1% 51.00 ‐7.8% 48.40 ‐2.9% Agg. Assault ‐ Family 0 1 ‐1 ‐100.0% 0 2 ‐2 ‐100.0% 2 ‐2 ‐100.0% 17 29 ‐41.4% 31.33 ‐45.7% 31.20 ‐45.5% Agg. Assault ‐ NonFamily 2 1 1 100.0% 9 6 3 50.0% 6 3 50.0% 99 119 ‐16.8% 89.00 11.2% 89.60 10.5% Burglary ‐ Residential 4 3 1 33.3% 21 10 11 110.0% 14 7 50.0% 176 192 ‐8.3% 207 ‐15.0% 209 ‐15.6% Burglary ‐ All Other 1 1 0 0.0% 6 17 ‐11 ‐64.7% 10 ‐4 ‐40.0% 151 150 0.7% 130 15.9% 131 15.6% Larceny ‐ Vehicle Burglary 12 11 1 9.1% 63 41 22 53.7% 49 14 28.6% 683 885 ‐22.8% 822 ‐16.9% 743 ‐8.1% Larceny ‐ All Other 26 38 ‐12 ‐31.6% 137 147 ‐10 ‐6.8% 146 ‐9 ‐6.2% 1,925 2,053 ‐6.2% 2103 ‐8.5% 1873 2.8% Motor Vehicle Theft 2 9 ‐7 ‐77.8% 25 34 ‐9 ‐26.5% 19 6 31.6% 326 345 ‐5.5% 338 ‐3.6% 310 5.2% TOTAL 50 65 ‐15 ‐23.1% 269 267 2 0.7% 251 18 7.2% 3,509 3,905 ‐10.1% 3836 ‐8.5% 3495 0.4% Nov 20Nov 27 Dec 04Dec 11‐Dec 2011 2012 2013 2014 2015 2016 2017 Homicide 0 0 0 0 2 0 3 0 2 0 2 Sex Assault 0 0 1 1 24 27 22 28 30 44 52 Robbery ‐ Business 0 0 0 1 23 26 33 29 28 32 31 Robbery ‐ All Other 1 3 0 1 49 37 52 51 46 56 47 Aggravated Assault ‐ Family 0 0 0 0 32 26 36 36 29 29 17 Aggravated Assault ‐ All Other 1 3 3 2 72 88 93 66 82 119 99 Burglary ‐ Residential 7 8 2 4 199 199 223 191 238 192 176 Burglary ‐ All Other 0 4 1 1 91 132 130 109 132 150 151 Larceny ‐ Vehicle Burglary 14 20 17 12 555 687 562 717 865 885 683 Larceny ‐ All Other 32 40 39 26 996 1509 1545 1956 2300 2053 1925 Vehicle Theft 7 9 7 2 179 240 295 308 361 345 326 TOTALS 62 87 70 50 2222 2971 2994 3491 4113 3905 3509 Year‐to‐Date Totals (Jan 1 through Dec 17) Note: Charts may erroneously show an apparent drop in the most current data due to some cases not yet having been reported and/or recorded. The figures included in this report are preliminary figures for general situational awareness and trend purposes only. They do not represent the official figures of the Salt Lake City Police Department and are  subject to further analysis and revision. Due to the statute‐driven, changing nature of crime classification and area boundaries over time, be advised that the figures contained may not fully coincide with  SLCPD statistical sources. Differences are reflective of the departmental procedures or policies that were in place at the time the events occurred and the date the data was compiled. In addition, data may  be approximate in relation to indicated areas. Additionally, they are not Uniform Crime Reporting (UCR) or "crime rate" numbers and are not intended to be used as such. Rather, they are a breakdown of  every offense within every case that occurred during the given time periods. Although every reasonable effort is made to verify their accuracy, the accuracy of any data is subject to the constraints of the  report generation process as well as the manner, format, and point in time of any query.   CompStat Report……. Council District 5 ‐  Breakdown of All Offenses *The above CompStat figures were generated on Monday, 1 day(s) after the closing date, which is indicated in the title. The figures are current as of the date generated. Last 7 Days* Last 28 Days* Previous 28 Days* (Prior to Last 28 Days) Year to Date (YTD)* 3‐Year YTD Average* 5‐Year YTD Average* Volume 3   ‐‐  Number 50 **Averages greater than or equal to 100 are rounded to a whole digit to maintain a consistent column size. Report Covering the Week 12/11/2017 Through 12/17/2017 (Mon‐Sun) 0 1 2 3 4 5 6 7 8 9 Nov 20‐Nov 26Nov 27‐Dec 03Dec 04‐Dec 10Dec 11‐Dec 17 Last 28 Day Breakdown by Week ‐ Part 1 Homicide Sex Assault Robbery‐Bus. Robbery‐Other Agg Aslt‐Family Agg Aslt‐NonFam Burg‐Res Burg‐All Other 2222 2971 2994 3491 4113 3905 3509 0 500 1000 1500 2000 2500 3000 3500 4000 4500 2011 2012 2013 2014 2015 2016 2017 Year‐to‐Date Totals (Jan 1 through Dec 17) Homicide Sex Assault Robbery‐Bus. Robbery‐Other Agg Aslt‐Family Agg Aslt‐NonFam Burg‐Res Burg‐All Other Larc‐Veh Burg Larc‐All Other Vehicle Theft0 5 10 15 20 25 30 35 40 45 Nov 20‐Nov 26 Nov 27‐Dec 03 Dec 04‐Dec 10 Dec 11‐Dec 17 Last 28 Day Breakdown by Week ‐ Part 2 Vehicle Burglary Other Larceny Vehicle Theft Page 7 of 9 
  • 8. Salt Lake City Police Department   2017 2016 Chg % Chg 2017 2016 Chg % Chg 2017 Recent  Chg Recent % Chg 2017 2016 % Chg Avg** % Chg Avg** % Chg Criminal Homicide 0 0 0 /0 0 0 0 /0 0 0 /0 1 0 /0 0.00 /0 0.00 /0 Sexual Assault 0 0 0 /0 1 0 1 /0 1 0 0.0% 5 4 25.0% 6.00 ‐16.7% 6.60 ‐24.2% Robbery ‐ Business 0 0 0 /0 1 0 1 /0 0 1 /0 6 4 50.0% 7.33 ‐18.2% 5.40 11.1% Robbery ‐ All Other 0 0 0 /0 0 0 0 /0 1 ‐1 ‐100.0% 3 2 50.0% 3.00 0.0% 3.40 ‐11.8% Agg. Assault ‐ Family 0 0 0 /0 0 1 ‐1 ‐100.0% 0 0 /0 5 4 25.0% 2.67 87.5% 2.20 127.3% Agg. Assault ‐ NonFamily 0 0 0 /0 1 0 1 /0 0 1 /0 10 4 150.0% 5.00 100.0% 8.40 19.0% Burglary ‐ Residential 1 1 0 0.0% 5 9 ‐4 ‐44.4% 8 ‐3 ‐37.5% 82 82 0.0% 87.67 ‐6.5% 87.00 ‐5.7% Burglary ‐ All Other 2 0 2 /0 5 1 4 400.0% 4 1 25.0% 46 23 100.0% 27.67 66.3% 30.00 53.3% Larceny ‐ Vehicle Burglary 8 5 3 60.0% 21 20 1 5.0% 24 ‐3 ‐12.5% 328 330 ‐0.6% 350 ‐6.2% 339 ‐3.2% Larceny ‐ All Other 0 5 ‐5 ‐100.0% 12 22 ‐10 ‐45.5% 12 0 0.0% 208 202 3.0% 211 ‐1.4% 199 4.6% Motor Vehicle Theft 0 0 0 /0 3 4 ‐1 ‐25.0% 5 ‐2 ‐40.0% 67 57 17.5% 77.33 ‐13.4% 81.20 ‐17.5% TOTAL 11 11 0 0.0% 49 57 ‐8 ‐14.0% 55 ‐6 ‐10.9% 761 712 6.9% 777 ‐2.1% 762 ‐0.1% Nov 20Nov 27 Dec 04Dec 11‐Dec 2011 2012 2013 2014 2015 2016 2017 Homicide 0 0 0 0 0 0 0 0 0 0 1 Sex Assault 0 1 0 0 6 10 5 8 6 4 5 Robbery ‐ Business 0 1 0 0 3 2 3 10 8 4 6 Robbery ‐ All Other 0 0 0 0 6 5 3 2 5 2 3 Aggravated Assault ‐ Family 0 0 0 0 6 1 2 2 2 4 5 Aggravated Assault ‐ All Other 0 1 0 0 7 18 9 4 7 4 10 Burglary ‐ Residential 3 1 0 1 83 76 96 84 97 82 82 Burglary ‐ All Other 1 0 2 2 30 26 41 27 33 23 46 Larceny ‐ Vehicle Burglary 5 4 4 8 413 339 307 311 408 330 328 Larceny ‐ All Other 6 2 4 0 192 195 166 220 211 202 208 Vehicle Theft 1 2 0 0 89 96 78 84 91 57 67 TOTALS 16 12 10 11 835 768 710 752 868 712 761 Year‐to‐Date Totals (Jan 1 through Dec 17) Note: Charts may erroneously show an apparent drop in the most current data due to some cases not yet having been reported and/or recorded. The figures included in this report are preliminary figures for general situational awareness and trend purposes only. They do not represent the official figures of the Salt Lake City Police Department and are  subject to further analysis and revision. Due to the statute‐driven, changing nature of crime classification and area boundaries over time, be advised that the figures contained may not fully coincide with  SLCPD statistical sources. Differences are reflective of the departmental procedures or policies that were in place at the time the events occurred and the date the data was compiled. In addition, data may  be approximate in relation to indicated areas. Additionally, they are not Uniform Crime Reporting (UCR) or "crime rate" numbers and are not intended to be used as such. Rather, they are a breakdown of  every offense within every case that occurred during the given time periods. Although every reasonable effort is made to verify their accuracy, the accuracy of any data is subject to the constraints of the  report generation process as well as the manner, format, and point in time of any query.   CompStat Report……. Council District 6 ‐  Breakdown of All Offenses *The above CompStat figures were generated on Monday, 1 day(s) after the closing date, which is indicated in the title. The figures are current as of the date generated. Last 7 Days* Last 28 Days* Previous 28 Days* (Prior to Last 28 Days) Year to Date (YTD)* 3‐Year YTD Average* 5‐Year YTD Average* Volume 3   ‐‐  Number 50 **Averages greater than or equal to 100 are rounded to a whole digit to maintain a consistent column size. Report Covering the Week 12/11/2017 Through 12/17/2017 (Mon‐Sun) 0 1 2 3 4 Nov 20‐Nov 26Nov 27‐Dec 03Dec 04‐Dec 10Dec 11‐Dec 17 Last 28 Day Breakdown by Week ‐ Part 1 Homicide Sex Assault Robbery‐Bus. Robbery‐Other Agg Aslt‐Family Agg Aslt‐NonFam Burg‐Res Burg‐All Other 835 768 710 752 868 712 761 0 100 200 300 400 500 600 700 800 900 1000 2011 2012 2013 2014 2015 2016 2017 Year‐to‐Date Totals (Jan 1 through Dec 17) Homicide Sex Assault Robbery‐Bus. Robbery‐Other Agg Aslt‐Family Agg Aslt‐NonFam Burg‐Res Burg‐All Other Larc‐Veh Burg Larc‐All Other Vehicle Theft0 1 2 3 4 5 6 7 8 9 Nov 20‐Nov 26 Nov 27‐Dec 03 Dec 04‐Dec 10 Dec 11‐Dec 17 Last 28 Day Breakdown by Week ‐ Part 2 Vehicle Burglary Other Larceny Vehicle Theft Page 8 of 9 
  • 9. Salt Lake City Police Department   2017 2016 Chg % Chg 2017 2016 Chg % Chg 2017 Recent  Chg Recent % Chg 2017 2016 % Chg Avg** % Chg Avg** % Chg Criminal Homicide 0 0 0 /0 0 0 0 /0 0 0 /0 0 0 /0 0.33 ‐100.0% 0.40 ‐100.0% Sexual Assault 0 1 ‐1 ‐100.0% 0 2 ‐2 ‐100.0% 3 ‐3 ‐100.0% 24 12 100.0% 10.67 125.0% 13.40 79.1% Robbery ‐ Business 1 0 1 /0 2 0 2 /0 1 1 100.0% 13 27 ‐51.9% 26.33 ‐50.6% 21.80 ‐40.4% Robbery ‐ All Other 0 1 ‐1 ‐100.0% 0 1 ‐1 ‐100.0% 2 ‐2 ‐100.0% 13 21 ‐38.1% 14.33 ‐9.3% 15.80 ‐17.7% Agg. Assault ‐ Family 1 0 1 /0 1 2 ‐1 ‐50.0% 1 0 0.0% 8 11 ‐27.3% 12.67 ‐36.8% 14.20 ‐43.7% Agg. Assault ‐ NonFamily 1 0 1 /0 2 0 2 /0 1 1 100.0% 15 36 ‐58.3% 36.00 ‐58.3% 39.00 ‐61.5% Burglary ‐ Residential 0 2 ‐2 ‐100.0% 3 6 ‐3 ‐50.0% 6 ‐3 ‐50.0% 112 116 ‐3.4% 134 ‐16.2% 143 ‐21.5% Burglary ‐ All Other 2 1 1 100.0% 8 10 ‐2 ‐20.0% 9 ‐1 ‐11.1% 103 99 4.0% 88.67 16.2% 91.80 12.2% Larceny ‐ Vehicle Burglary 18 20 ‐2 ‐10.0% 67 77 ‐10 ‐13.0% 51 16 31.4% 596 707 ‐15.7% 710 ‐16.1% 651 ‐8.5% Larceny ‐ All Other 9 22 ‐13 ‐59.1% 53 82 ‐29 ‐35.4% 69 ‐16 ‐23.2% 938 1,016 ‐7.7% 1002 ‐6.4% 937 0.1% Motor Vehicle Theft 6 3 3 100.0% 16 18 ‐2 ‐11.1% 14 2 14.3% 177 181 ‐2.2% 190 ‐6.8% 186 ‐4.6% TOTAL 38 50 ‐12 ‐24.0% 152 198 ‐46 ‐23.2% 157 ‐5 ‐3.2% 1,999 2,226 ‐10.2% 2225 ‐10.2% 2113 ‐5.4% Nov 20Nov 27 Dec 04Dec 11‐Dec 2011 2012 2013 2014 2015 2016 2017 Homicide 0 0 0 0 1 1 0 0 1 0 0 Sex Assault 0 0 0 0 7 17 18 10 10 12 24 Robbery ‐ Business 1 0 0 1 14 7 23 25 27 27 13 Robbery ‐ All Other 0 0 0 0 19 21 15 10 12 21 13 Aggravated Assault ‐ Family 0 0 0 1 8 18 15 8 19 11 8 Aggravated Assault ‐ All Other 1 0 0 1 37 43 44 32 40 36 15 Burglary ‐ Residential 0 1 2 0 124 138 174 126 159 116 112 Burglary ‐ All Other 1 2 3 2 56 128 65 73 94 99 103 Larceny ‐ Vehicle Burglary 13 24 12 18 513 602 524 617 807 707 596 Larceny ‐ All Other 16 18 10 9 720 755 925 989 1002 1016 938 Vehicle Theft 4 1 5 6 124 161 197 170 219 181 177 TOTALS 36 46 32 38 1623 1891 2000 2060 2390 2226 1999 Year‐to‐Date Totals (Jan 1 through Dec 17) Note: Charts may erroneously show an apparent drop in the most current data due to some cases not yet having been reported and/or recorded. The figures included in this report are preliminary figures for general situational awareness and trend purposes only. They do not represent the official figures of the Salt Lake City Police Department and are  subject to further analysis and revision. Due to the statute‐driven, changing nature of crime classification and area boundaries over time, be advised that the figures contained may not fully coincide with  SLCPD statistical sources. Differences are reflective of the departmental procedures or policies that were in place at the time the events occurred and the date the data was compiled. In addition, data may  be approximate in relation to indicated areas. Additionally, they are not Uniform Crime Reporting (UCR) or "crime rate" numbers and are not intended to be used as such. Rather, they are a breakdown of  every offense within every case that occurred during the given time periods. Although every reasonable effort is made to verify their accuracy, the accuracy of any data is subject to the constraints of the  report generation process as well as the manner, format, and point in time of any query.   *The above CompStat figures were generated on Monday, 1 day(s) after the closing date, which is indicated in the title. The figures are current as of the date generated. CompStat Report……. Council District 7 ‐  Breakdown of All Offenses Volume 3   ‐‐  Number 50 Last 7 Days* Last 28 Days* Previous 28 Days* (Prior to Last 28 Days) Year to Date (YTD)* 3‐Year YTD Average* 5‐Year YTD Average* **Averages greater than or equal to 100 are rounded to a whole digit to maintain a consistent column size. Report Covering the Week 12/11/2017 Through 12/17/2017 (Mon‐Sun) 0 1 2 3 4 Nov 20‐Nov 26Nov 27‐Dec 03Dec 04‐Dec 10Dec 11‐Dec 17 Last 28 Day Breakdown by Week ‐ Part 1 Homicide Sex Assault Robbery‐Bus. Robbery‐Other Agg Aslt‐Family Agg Aslt‐NonFam Burg‐Res Burg‐All Other 1623 1891 2000 2060 2390 2226 1999 0 500 1000 1500 2000 2500 3000 2011 2012 2013 2014 2015 2016 2017 Year‐to‐Date Totals (Jan 1 through Dec 17) Homicide Sex Assault Robbery‐Bus. Robbery‐Other Agg Aslt‐Family Agg Aslt‐NonFam Burg‐Res Burg‐All Other Larc‐Veh Burg Larc‐All Other Vehicle Theft0 5 10 15 20 25 30 Nov 20‐Nov 26 Nov 27‐Dec 03 Dec 04‐Dec 10 Dec 11‐Dec 17 Last 28 Day Breakdown by Week ‐ Part 2 Vehicle Burglary Other Larceny Vehicle Theft Page 9 of 9