SLCPD - District 5 October 2017
•
0 likes•128 views

Car burglaries and home burglaries and car thefts are still among the most frequently occurring crime in D5.

Recommended
More Related Content
What's hot
What's hot (16)
Similar to SLCPD - District 5 October 2017
Similar to SLCPD - District 5 October 2017 (20)
More from ELPCO East Liberty Park Comm. Organization
More from ELPCO East Liberty Park Comm. Organization (20)
Recently uploaded
Recently uploaded (20)
SLCPD - District 5 October 2017
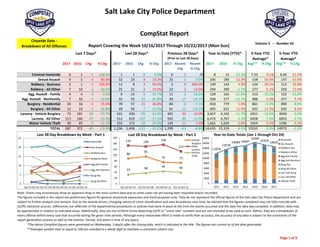
- 1. Salt Lake City Police Department 2017 2016 Chg % Chg 2017 2016 Chg % Chg 2017 Recent Chg Recent % Chg 2017 2016 % Chg Avg** % Chg Avg** % Chg Criminal Homicide 0 1 ‐1 ‐100.0% 1 1 0 0.0% 0 1 /0 8 12 ‐33.3% 7.33 9.1% 6.60 21.2% Sexual Assault 9 5 4 80.0% 32 24 8 33.3% 32 0 0.0% 246 186 32.3% 158 56.0% 147 67.6% Robbery ‐ Business 2 1 1 100.0% 12 8 4 50.0% 3 9 300.0% 149 142 4.9% 124 20.5% 112 32.8% Robbery ‐ All Other 7 10 ‐3 ‐30.0% 25 21 4 19.0% 22 3 13.6% 294 299 ‐1.7% 277 6.1% 259 13.4% Agg. Assault ‐ Family 4 4 0 0.0% 9 14 ‐5 ‐35.7% 11 ‐2 ‐18.2% 129 165 ‐21.8% 153 ‐15.5% 152 ‐15.0% Agg. Assault ‐ NonFamily 7 10 ‐3 ‐30.0% 32 55 ‐23 ‐41.8% 49 ‐17 ‐34.7% 504 577 ‐12.7% 488 3.3% 477 5.7% Burglary ‐ Residential 20 16 4 25.0% 78 57 21 36.8% 84 ‐6 ‐7.1% 818 779 5.0% 861 ‐5.0% 890 ‐8.0% Burglary ‐ All Other 12 19 ‐7 ‐36.8% 49 56 ‐7 ‐12.5% 61 ‐12 ‐19.7% 695 621 11.9% 625 11.3% 642 8.2% Larceny ‐ Vehicle Burglary 73 101 ‐28 ‐27.7% 331 430 ‐99 ‐23.0% 301 30 10.0% 3,657 4,142 ‐11.7% 4251 ‐14.0% 4040 ‐9.5% Larceny ‐ All Other 113 160 ‐47 ‐29.4% 512 619 ‐107 ‐17.3% 592 ‐80 ‐13.5% 6,474 6,767 ‐4.3% 6958 ‐7.0% 6653 ‐2.7% Motor Vehicle Theft 40 45 ‐5 ‐11.1% 155 173 ‐18 ‐10.4% 144 11 7.6% 1,661 1,629 2.0% 1654 0.4% 1596 4.1% TOTAL 287 372 ‐85 ‐22.9% 1,236 1,458 ‐222 ‐15.2% 1,299 ‐63 ‐4.8% 14,635 15,319 ‐4.5% 15555 ‐5.9% 14973 ‐2.3% Sep 25Oct 02‐Oct 09 Oct 16‐Oct 2011 2012 2013 2014 2015 2016 2017 Homicide 1 0 0 0 8 5 6 4 6 12 8 Sex Assault 7 11 5 9 120 140 121 143 144 186 246 Robbery ‐ Business 7 2 1 2 103 76 114 110 119 142 149 Robbery ‐ All Other 6 7 5 7 229 206 259 267 265 299 294 Aggravated Assault ‐ Family 1 2 2 4 123 134 167 129 164 165 129 Aggravated Assault ‐ All Other 9 10 6 7 405 469 451 421 465 577 504 Burglary ‐ Residential 20 21 17 20 890 770 1095 819 985 779 818 Burglary ‐ All Other 15 11 11 12 500 683 654 577 676 621 695 Larceny ‐ Vehicle Burglary 88 95 75 73 3292 3855 3590 4077 4534 4142 3657 Larceny ‐ All Other 133 130 136 113 5100 5758 6631 6902 7206 6767 6474 Vehicle Theft 33 38 44 40 1206 1422 1596 1498 1835 1629 1661 TOTALS 320 327 302 287 11976 13518 14684 14947 16399 15319 14635 Year‐to‐Date Totals (Jan 1 through Oct 24) Note: Charts may erroneously show an apparent drop in the most current data due to some cases not yet having been reported and/or recorded. The figures included in this report are preliminary figures for general situational awareness and trend purposes only. They do not represent the official figures of the Salt Lake City Police Department and are subject to further analysis and revision. Due to the statute‐driven, changing nature of crime classification and area boundaries over time, be advised that the figures contained may not fully coincide with SLCPD statistical sources. Differences are reflective of the departmental procedures or policies that were in place at the time the events occurred and the date the data was compiled. In addition, data may be approximate in relation to indicated areas. Additionally, they are not Uniform Crime Reporting (UCR) or "crime rate" numbers and are not intended to be used as such. Rather, they are a breakdown of every offense within every case that occurred during the given time periods. Although every reasonable effort is made to verify their accuracy, the accuracy of any data is subject to the constraints of the report generation process as well as the manner, format, and point in time of any query. *The above CompStat figures were generated on Wednesday, 3 day(s) after the closing date, which is indicated in the title. The figures are current as of the date generated. CompStat Report……. Citywide Data ‐ Breakdown of All Offenses Volume 3 ‐‐ Number 42 Last 7 Days* Last 28 Days* Previous 28 Days* (Prior to Last 28 Days) Year to Date (YTD)* 3‐Year YTD Average* 5‐Year YTD Average* **Averages greater than or equal to 100 are rounded to a whole digit to maintain a consistent column size. Report Covering the Week 10/16/2017 Through 10/22/2017 (Mon‐Sun) 0 5 10 15 20 25 Sep 25‐Oct 01 Oct 02‐Oct 08 Oct 09‐Oct 15 Oct 16‐Oct 22 Last 28 Day Breakdown by Week ‐ Part 1 Homicide Sex Assault Robbery‐Bus. Robbery‐Other Agg Aslt‐Family Agg Aslt‐NonFam Burg‐Res Burg‐All Other 11976 13518 14684 14947 16399 15319 14635 0 2000 4000 6000 8000 10000 12000 14000 16000 18000 2011 2012 2013 2014 2015 2016 2017 Year‐to‐Date Totals (Jan 1 through Oct 24) Homicide Sex Assault Robbery‐Bus. Robbery‐Other Agg Aslt‐Family Agg Aslt‐NonFam Burg‐Res Burg‐All Other Larc‐Veh Burg Larc‐All Other Vehicle Theft 88 95 75 73 133 130 136 113 33 38 44 40 0 20 40 60 80 100 120 140 160 Sep 25‐Oct 01 Oct 02‐Oct 08 Oct 09‐Oct 15 Oct 16‐Oct 22 Last 28 Day Breakdown by Week ‐ Part 2 Vehicle Burglary Other Larceny Vehicle Theft Page 1 of 9
- 2. Salt Lake City Police Department 2017 2016 Chg % Chg 2017 2016 Chg % Chg 2017 Recent Chg Recent % Chg 2017 2016 % Chg Avg** % Chg Avg** % Chg Criminal Homicide 0 0 0 /0 0 0 0 /0 0 0 /0 3 1 200.0% 1.00 200.0% 0.80 275.0% Sexual Assault 2 1 1 100.0% 7 8 ‐1 ‐12.5% 5 2 40.0% 44 42 4.8% 38.67 13.8% 29.80 47.7% Robbery ‐ Business 1 0 1 /0 1 0 1 /0 1 0 0.0% 20 18 11.1% 15.33 30.4% 13.60 47.1% Robbery ‐ All Other 1 2 ‐1 ‐50.0% 4 5 ‐1 ‐20.0% 7 ‐3 ‐42.9% 108 120 ‐10.0% 112 ‐3.6% 96.20 12.3% Agg. Assault ‐ Family 0 1 ‐1 ‐100.0% 0 4 ‐4 ‐100.0% 2 ‐2 ‐100.0% 11 11 0.0% 10.67 3.1% 9.80 12.2% Agg. Assault ‐ NonFamily 2 4 ‐2 ‐50.0% 6 14 ‐8 ‐57.1% 13 ‐7 ‐53.8% 155 163 ‐4.9% 146 6.2% 135 14.6% Burglary ‐ Residential 0 0 0 /0 1 0 1 /0 2 ‐1 ‐50.0% 38 22 72.7% 21.33 78.1% 21.00 81.0% Burglary ‐ All Other 1 1 0 0.0% 4 7 ‐3 ‐42.9% 5 ‐1 ‐20.0% 75 73 2.7% 60.00 25.0% 62.20 20.6% Larceny ‐ Vehicle Burglary 8 9 ‐1 ‐11.1% 40 38 2 5.3% 37 3 8.1% 543 629 ‐13.7% 645 ‐15.9% 713 ‐23.9% Larceny ‐ All Other 12 35 ‐23 ‐65.7% 73 111 ‐38 ‐34.2% 75 ‐2 ‐2.7% 1,065 1,168 ‐8.8% 1151 ‐7.5% 1080 ‐1.4% Motor Vehicle Theft 4 3 1 33.3% 11 13 ‐2 ‐15.4% 11 0 0.0% 155 145 6.9% 145 6.9% 134 15.8% TOTAL 31 56 ‐25 ‐44.6% 147 200 ‐53 ‐26.5% 158 ‐11 ‐7.0% 2,217 2,392 ‐7.3% 2346 ‐5.5% 2296 ‐3.4% Sep 25Oct 02‐Oct 09 Oct 16‐Oct 2011 2012 2013 2014 2015 2016 2017 Homicide 0 0 0 0 2 1 0 2 0 1 3 Sex Assault 2 2 1 2 18 16 17 38 36 42 44 Robbery ‐ Business 0 0 0 1 15 8 14 9 19 18 20 Robbery ‐ All Other 1 1 1 1 55 54 91 100 116 120 108 Aggravated Assault ‐ Family 0 0 0 0 5 9 8 11 10 11 11 Aggravated Assault ‐ All Other 1 1 2 2 105 106 132 130 145 163 155 Burglary ‐ Residential 0 0 1 0 23 22 19 18 24 22 38 Burglary ‐ All Other 1 2 0 1 33 67 64 52 55 73 75 Larceny ‐ Vehicle Burglary 9 14 9 8 510 941 690 569 738 629 543 Larceny ‐ All Other 23 14 24 12 695 848 1101 1105 1180 1168 1065 Vehicle Theft 2 3 2 4 112 105 129 113 177 145 155 TOTALS 39 37 40 31 1573 2177 2265 2147 2500 2392 2217 Year‐to‐Date Totals (Jan 1 through Oct 24) Note: Charts may erroneously show an apparent drop in the most current data due to some cases not yet having been reported and/or recorded. The figures included in this report are preliminary figures for general situational awareness and trend purposes only. They do not represent the official figures of the Salt Lake City Police Department and are subject to further analysis and revision. Due to the statute‐driven, changing nature of crime classification and area boundaries over time, be advised that the figures contained may not fully coincide with SLCPD statistical sources. Differences are reflective of the departmental procedures or policies that were in place at the time the events occurred and the date the data was compiled. In addition, data may be approximate in relation to indicated areas. Additionally, they are not Uniform Crime Reporting (UCR) or "crime rate" numbers and are not intended to be used as such. Rather, they are a breakdown of every offense within every case that occurred during the given time periods. Although every reasonable effort is made to verify their accuracy, the accuracy of any data is subject to the constraints of the report generation process as well as the manner, format, and point in time of any query. *The above CompStat figures were generated on Wednesday, 3 day(s) after the closing date, which is indicated in the title. The figures are current as of the date generated. **Averages greater than or equal to 100 are rounded to a whole digit to maintain a consistent column size. ***The Rio Grande District is defined as the area from North Temple to 700 South and State Street to I‐15. However, this area overlaps other districts covered with the SLCPD CompStat Report, namely parts of Districts 3 & 4. As a result, the data contained within the Rio Grande District may also be listed in the data for other areas. CompStat Report……. Rio Grande District*** Breakdown of All Offenses Report Covering the Week 10/16/2017 Through 10/22/2017 (Mon‐Sun) Volume 3 ‐‐ Number 42 Last 7 Days* Last 28 Days* Previous 28 Days* (Prior to Last 28 Days) Year to Date (YTD)* 3‐Year YTD Average* 5‐Year YTD Average* 0 1 2 3 Sep 25‐Oct 01 Oct 02‐Oct 08 Oct 09‐Oct 15 Oct 16‐Oct 22 Last 28 Day Breakdown by Week ‐ Part 1 Homicide Sex Assault Robbery‐Bus. Robbery‐Other Agg Aslt‐Family Agg Aslt‐NonFam Burg‐Res Burg‐All Other 1573 2177 2265 2147 2500 2392 2217 0 500 1000 1500 2000 2500 3000 2011 2012 2013 2014 2015 2016 2017 Year‐to‐Date Totals (Jan 1 through Oct 24) Homicide Sex Assault Robbery‐Bus. Robbery‐Other Agg Aslt‐Family Agg Aslt‐NonFam Burg‐Res Burg‐All Other Larc‐Veh Burg Larc‐All Other Vehicle Theft 0 5 10 15 20 25 30 Sep 25‐Oct 01 Oct 02‐Oct 08 Oct 09‐Oct 15 Oct 16‐Oct 22 Last 28 Day Breakdown by Week ‐ Part 2 Vehicle Burglary Other Larceny Vehicle Theft Page 2 of 9
- 3. Salt Lake City Police Department 2017 2016 Chg % Chg 2017 2016 Chg % Chg 2017 Recent Chg Recent % Chg 2017 2016 % Chg Avg** % Chg Avg** % Chg Criminal Homicide 0 0 0 /0 0 0 0 /0 0 0 /0 0 4 ‐100.0% 2.00 ‐100.0% 1.40 ‐100.0% Sexual Assault 3 0 3 /0 3 4 ‐1 ‐25.0% 3 0 0.0% 27 14 92.9% 13.33 102.5% 13.40 101.5% Robbery ‐ Business 0 0 0 /0 0 2 ‐2 ‐100.0% 0 0 /0 11 12 ‐8.3% 9.67 13.8% 7.80 41.0% Robbery ‐ All Other 1 0 1 /0 3 1 2 200.0% 1 2 200.0% 23 24 ‐4.2% 26.33 ‐12.7% 24.60 ‐6.5% Agg. Assault ‐ Family 0 2 ‐2 ‐100.0% 1 3 ‐2 ‐66.7% 2 ‐1 ‐50.0% 25 44 ‐43.2% 34.33 ‐27.2% 33.40 ‐25.1% Agg. Assault ‐ NonFamily 0 0 0 /0 2 3 ‐1 ‐33.3% 3 ‐1 ‐33.3% 48 59 ‐18.6% 51.00 ‐5.9% 55.80 ‐14.0% Burglary ‐ Residential 1 3 ‐2 ‐66.7% 6 8 ‐2 ‐25.0% 10 ‐4 ‐40.0% 92 83 10.8% 115 ‐20.2% 130 ‐29.4% Burglary ‐ All Other 0 2 ‐2 ‐100.0% 3 5 ‐2 ‐40.0% 5 ‐2 ‐40.0% 41 38 7.9% 43.00 ‐4.7% 48.00 ‐14.6% Larceny ‐ Vehicle Burglary 5 6 ‐1 ‐16.7% 25 27 ‐2 ‐7.4% 28 ‐3 ‐10.7% 292 307 ‐4.9% 339 ‐13.9% 316 ‐7.5% Larceny ‐ All Other 3 7 ‐4 ‐57.1% 24 27 ‐3 ‐11.1% 36 ‐12 ‐33.3% 321 376 ‐14.6% 407 ‐21.2% 416 ‐22.8% Motor Vehicle Theft 5 9 ‐4 ‐44.4% 20 19 1 5.3% 14 6 42.9% 210 225 ‐6.7% 244 ‐13.9% 250 ‐15.9% TOTAL 18 29 ‐11 ‐37.9% 87 99 ‐12 ‐12.1% 102 ‐15 ‐14.7% 1,090 1,186 ‐8.1% 1286 ‐15.2% 1296 ‐15.9% Sep 25Oct 02‐Oct 09 Oct 16‐Oct 2011 2012 2013 2014 2015 2016 2017 Homicide 0 0 0 0 1 0 1 0 2 4 0 Sex Assault 0 0 0 3 13 13 14 11 15 14 27 Robbery ‐ Business 0 0 0 0 2 4 6 7 10 12 11 Robbery ‐ All Other 0 2 0 1 18 23 21 29 26 24 23 Aggravated Assault ‐ Family 0 0 1 0 35 27 37 24 35 44 25 Aggravated Assault ‐ All Other 0 2 0 0 47 62 64 46 48 59 48 Burglary ‐ Residential 4 1 0 1 101 104 202 120 143 83 92 Burglary ‐ All Other 1 1 1 0 32 44 67 34 57 38 41 Larceny ‐ Vehicle Burglary 10 9 1 5 257 261 300 360 351 307 292 Larceny ‐ All Other 4 4 13 3 419 430 428 405 441 376 321 Vehicle Theft 4 8 3 5 220 218 299 255 252 225 210 TOTALS 23 27 19 18 1145 1186 1439 1291 1380 1186 1090 Year‐to‐Date Totals (Jan 1 through Oct 24) Note: Charts may erroneously show an apparent drop in the most current data due to some cases not yet having been reported and/or recorded. The figures included in this report are preliminary figures for general situational awareness and trend purposes only. They do not represent the official figures of the Salt Lake City Police Department and are subject to further analysis and revision. Due to the statute‐driven, changing nature of crime classification and area boundaries over time, be advised that the figures contained may not fully coincide with SLCPD statistical sources. Differences are reflective of the departmental procedures or policies that were in place at the time the events occurred and the date the data was compiled. In addition, data may be approximate in relation to indicated areas. Additionally, they are not Uniform Crime Reporting (UCR) or "crime rate" numbers and are not intended to be used as such. Rather, they are a breakdown of every offense within every case that occurred during the given time periods. Although every reasonable effort is made to verify their accuracy, the accuracy of any data is subject to the constraints of the report generation process as well as the manner, format, and point in time of any query. CompStat Report……. Council District 1 ‐ Breakdown of All Offenses *The above CompStat figures were generated on Wednesday, 3 day(s) after the closing date, which is indicated in the title. The figures are current as of the date generated. Last 7 Days* Last 28 Days* Previous 28 Days* (Prior to Last 28 Days) Year to Date (YTD)* 3‐Year YTD Average* 5‐Year YTD Average* Volume 3 ‐‐ Number 42 **Averages greater than or equal to 100 are rounded to a whole digit to maintain a consistent column size. Report Covering the Week 10/16/2017 Through 10/22/2017 (Mon‐Sun) 0 1 2 3 4 5 Sep 25‐Oct 01 Oct 02‐Oct 08 Oct 09‐Oct 15 Oct 16‐Oct 22 Last 28 Day Breakdown by Week ‐ Part 1 Homicide Sex Assault Robbery‐Bus. Robbery‐Other Agg Aslt‐Family Agg Aslt‐NonFam Burg‐Res Burg‐All Other 1145 1186 1439 1291 1380 1186 1090 0 200 400 600 800 1000 1200 1400 1600 2011 2012 2013 2014 2015 2016 2017 Year‐to‐Date Totals (Jan 1 through Oct 24) Homicide Sex Assault Robbery‐Bus. Robbery‐Other Agg Aslt‐Family Agg Aslt‐NonFam Burg‐Res Burg‐All Other Larc‐Veh Burg Larc‐All Other Vehicle Theft 0 2 4 6 8 10 12 14 Sep 25‐Oct 01 Oct 02‐Oct 08 Oct 09‐Oct 15 Oct 16‐Oct 22 Last 28 Day Breakdown by Week ‐ Part 2 Vehicle Burglary Other Larceny Vehicle Theft Page 3 of 9
- 4. Salt Lake City Police Department 2017 2016 Chg % Chg 2017 2016 Chg % Chg 2017 Recent Chg Recent % Chg 2017 2016 % Chg Avg** % Chg Avg** % Chg Criminal Homicide 0 1 ‐1 ‐100.0% 0 1 ‐1 ‐100.0% 0 0 /0 0 4 ‐100.0% 2.00 ‐100.0% 1.80 ‐100.0% Sexual Assault 1 1 0 0.0% 4 2 2 100.0% 8 ‐4 ‐50.0% 32 24 33.3% 19.67 62.7% 19.00 68.4% Robbery ‐ Business 0 0 0 /0 3 2 1 50.0% 0 3 /0 26 23 13.0% 21.33 21.9% 20.00 30.0% Robbery ‐ All Other 2 2 0 0.0% 9 4 5 125.0% 5 4 80.0% 65 45 44.4% 42.00 54.8% 42.00 54.8% Agg. Assault ‐ Family 3 0 3 /0 5 2 3 150.0% 3 2 66.7% 42 42 0.0% 41.00 2.4% 40.60 3.4% Agg. Assault ‐ NonFamily 1 1 0 0.0% 7 8 ‐1 ‐12.5% 13 ‐6 ‐46.2% 105 112 ‐6.3% 90.00 16.7% 81.80 28.4% Burglary ‐ Residential 2 2 0 0.0% 6 7 ‐1 ‐14.3% 15 ‐9 ‐60.0% 120 91 31.9% 114 5.6% 129 ‐6.8% Burglary ‐ All Other 4 7 ‐3 ‐42.9% 14 14 0 0.0% 16 ‐2 ‐12.5% 133 145 ‐8.3% 152 ‐12.5% 146 ‐9.0% Larceny ‐ Vehicle Burglary 4 17 ‐13 ‐76.5% 27 67 ‐40 ‐59.7% 38 ‐11 ‐28.9% 416 509 ‐18.3% 477 ‐12.8% 458 ‐9.1% Larceny ‐ All Other 20 23 ‐3 ‐13.0% 86 87 ‐1 ‐1.1% 99 ‐13 ‐13.1% 914 937 ‐2.5% 995 ‐8.2% 988 ‐7.5% Motor Vehicle Theft 6 16 ‐10 ‐62.5% 29 39 ‐10 ‐25.6% 33 ‐4 ‐12.1% 356 356 0.0% 346 2.8% 340 4.6% TOTAL 43 70 ‐27 ‐38.6% 190 233 ‐43 ‐18.5% 230 ‐40 ‐17.4% 2,209 2,288 ‐3.5% 2301 ‐4.0% 2266 ‐2.5% Sep 25Oct 02‐Oct 09 Oct 16‐Oct 2011 2012 2013 2014 2015 2016 2017 Homicide 0 0 0 0 1 2 1 1 1 4 0 Sex Assault 1 1 1 1 15 23 13 19 16 24 32 Robbery ‐ Business 3 0 0 0 24 15 21 20 21 23 26 Robbery ‐ All Other 3 0 4 2 42 41 43 43 38 45 65 Aggravated Assault ‐ Family 0 1 1 3 28 39 41 32 49 42 42 Aggravated Assault ‐ All Other 2 3 1 1 65 80 59 80 78 112 105 Burglary ‐ Residential 0 3 1 2 171 110 193 124 126 91 120 Burglary ‐ All Other 7 1 2 4 155 139 136 136 175 145 133 Larceny ‐ Vehicle Burglary 10 5 8 4 477 388 468 451 472 509 416 Larceny ‐ All Other 22 31 13 20 1101 962 990 1036 1013 937 914 Vehicle Theft 6 7 10 6 279 325 338 294 389 356 356 TOTALS 54 52 41 43 2358 2124 2303 2236 2378 2288 2209 Year‐to‐Date Totals (Jan 1 through Oct 24) Note: Charts may erroneously show an apparent drop in the most current data due to some cases not yet having been reported and/or recorded. The figures included in this report are preliminary figures for general situational awareness and trend purposes only. They do not represent the official figures of the Salt Lake City Police Department and are subject to further analysis and revision. Due to the statute‐driven, changing nature of crime classification and area boundaries over time, be advised that the figures contained may not fully coincide with SLCPD statistical sources. Differences are reflective of the departmental procedures or policies that were in place at the time the events occurred and the date the data was compiled. In addition, data may be approximate in relation to indicated areas. Additionally, they are not Uniform Crime Reporting (UCR) or "crime rate" numbers and are not intended to be used as such. Rather, they are a breakdown of every offense within every case that occurred during the given time periods. Although every reasonable effort is made to verify their accuracy, the accuracy of any data is subject to the constraints of the report generation process as well as the manner, format, and point in time of any query. CompStat Report……. Council District 2 ‐ Breakdown of All Offenses *The above CompStat figures were generated on Wednesday, 3 day(s) after the closing date, which is indicated in the title. The figures are current as of the date generated. Last 7 Days* Last 28 Days* Previous 28 Days* (Prior to Last 28 Days) Year to Date (YTD)* 3‐Year YTD Average* 5‐Year YTD Average* Volume 3 ‐‐ Number 42 **Averages greater than or equal to 100 are rounded to a whole digit to maintain a consistent column size. Report Covering the Week 10/16/2017 Through 10/22/2017 (Mon‐Sun) 0 1 2 3 4 5 6 7 8 Sep 25‐Oct 01 Oct 02‐Oct 08 Oct 09‐Oct 15 Oct 16‐Oct 22 Last 28 Day Breakdown by Week ‐ Part 1 Homicide Sex Assault Robbery‐Bus. Robbery‐Other Agg Aslt‐Family Agg Aslt‐NonFam Burg‐Res Burg‐All Other 2358 2124 2303 2236 2378 2288 2209 0 500 1000 1500 2000 2500 2011 2012 2013 2014 2015 2016 2017 Year‐to‐Date Totals (Jan 1 through Oct 24) Homicide Sex Assault Robbery‐Bus. Robbery‐Other Agg Aslt‐Family Agg Aslt‐NonFam Burg‐Res Burg‐All Other Larc‐Veh Burg Larc‐All Other Vehicle Theft 0 5 10 15 20 25 30 35 Sep 25‐Oct 01 Oct 02‐Oct 08 Oct 09‐Oct 15 Oct 16‐Oct 22 Last 28 Day Breakdown by Week ‐ Part 2 Vehicle Burglary Other Larceny Vehicle Theft Page 4 of 9
- 5. Salt Lake City Police Department 2017 2016 Chg % Chg 2017 2016 Chg % Chg 2017 Recent Chg Recent % Chg 2017 2016 % Chg Avg** % Chg Avg** % Chg Criminal Homicide 0 0 0 /0 0 0 0 /0 0 0 /0 0 2 ‐100.0% 0.67 ‐100.0% 0.60 ‐100.0% Sexual Assault 1 1 0 0.0% 4 1 3 300.0% 1 3 300.0% 22 12 83.3% 11.00 100.0% 12.00 83.3% Robbery ‐ Business 0 0 0 /0 0 0 0 /0 0 0 /0 8 3 166.7% 4.67 71.4% 4.20 90.5% Robbery ‐ All Other 1 0 1 /0 3 0 3 /0 3 0 0.0% 20 16 25.0% 14.33 39.5% 12.00 66.7% Agg. Assault ‐ Family 0 0 0 /0 1 2 ‐1 ‐50.0% 1 0 0.0% 10 21 ‐52.4% 11.67 ‐14.3% 10.80 ‐7.4% Agg. Assault ‐ NonFamily 0 0 0 /0 5 3 2 66.7% 6 ‐1 ‐16.7% 38 39 ‐2.6% 28.00 35.7% 24.40 55.7% Burglary ‐ Residential 6 2 4 200.0% 19 9 10 111.1% 13 6 46.2% 134 114 17.5% 125 7.5% 123 8.6% Burglary ‐ All Other 0 0 0 /0 3 8 ‐5 ‐62.5% 8 ‐5 ‐62.5% 79 72 9.7% 65.67 20.3% 66.20 19.3% Larceny ‐ Vehicle Burglary 5 17 ‐12 ‐70.6% 26 62 ‐36 ‐58.1% 40 ‐14 ‐35.0% 499 562 ‐11.2% 611 ‐18.4% 531 ‐6.0% Larceny ‐ All Other 7 10 ‐3 ‐30.0% 29 41 ‐12 ‐29.3% 34 ‐5 ‐14.7% 346 334 3.6% 377 ‐8.2% 366 ‐5.5% Motor Vehicle Theft 5 4 1 25.0% 15 14 1 7.1% 19 ‐4 ‐21.1% 193 170 13.5% 165 16.7% 159 21.2% TOTAL 25 34 ‐9 ‐26.5% 105 140 ‐35 ‐25.0% 125 ‐20 ‐16.0% 1,349 1,345 0.3% 1414 ‐4.6% 1310 3.0% Sep 25Oct 02‐Oct 09 Oct 16‐Oct 2011 2012 2013 2014 2015 2016 2017 Homicide 0 0 0 0 1 1 0 0 0 2 0 Sex Assault 1 2 0 1 18 14 13 9 12 12 22 Robbery ‐ Business 0 0 0 0 11 3 4 9 2 3 8 Robbery ‐ All Other 0 2 0 1 16 3 14 14 13 16 20 Aggravated Assault ‐ Family 0 1 0 0 6 7 12 6 8 21 10 Aggravated Assault ‐ All Other 1 2 2 0 26 24 14 18 27 39 38 Burglary ‐ Residential 4 7 2 6 121 103 140 111 149 114 134 Burglary ‐ All Other 0 1 2 0 49 56 78 71 54 72 79 Larceny ‐ Vehicle Burglary 4 13 4 5 377 376 444 666 606 562 499 Larceny ‐ All Other 9 8 5 7 340 336 363 414 383 334 346 Vehicle Theft 2 3 5 5 138 153 147 135 191 170 193 TOTALS 21 39 20 25 1103 1076 1229 1453 1445 1345 1349 Year‐to‐Date Totals (Jan 1 through Oct 24) Note: Charts may erroneously show an apparent drop in the most current data due to some cases not yet having been reported and/or recorded. The figures included in this report are preliminary figures for general situational awareness and trend purposes only. They do not represent the official figures of the Salt Lake City Police Department and are subject to further analysis and revision. Due to the statute‐driven, changing nature of crime classification and area boundaries over time, be advised that the figures contained may not fully coincide with SLCPD statistical sources. Differences are reflective of the departmental procedures or policies that were in place at the time the events occurred and the date the data was compiled. In addition, data may be approximate in relation to indicated areas. Additionally, they are not Uniform Crime Reporting (UCR) or "crime rate" numbers and are not intended to be used as such. Rather, they are a breakdown of every offense within every case that occurred during the given time periods. Although every reasonable effort is made to verify their accuracy, the accuracy of any data is subject to the constraints of the report generation process as well as the manner, format, and point in time of any query. CompStat Report……. Council District 3 ‐ Breakdown of All Offenses *The above CompStat figures were generated on Wednesday, 3 day(s) after the closing date, which is indicated in the title. The figures are current as of the date generated. Last 7 Days* Last 28 Days* Previous 28 Days* (Prior to Last 28 Days) Year to Date (YTD)* 3‐Year YTD Average* 5‐Year YTD Average* Volume 3 ‐‐ Number 42 **Averages greater than or equal to 100 are rounded to a whole digit to maintain a consistent column size. Report Covering the Week 10/16/2017 Through 10/22/2017 (Mon‐Sun) 0 1 2 3 4 5 6 7 8 Sep 25‐Oct 01 Oct 02‐Oct 08 Oct 09‐Oct 15 Oct 16‐Oct 22 Last 28 Day Breakdown by Week ‐ Part 1 Homicide Sex Assault Robbery‐Bus. Robbery‐Other Agg Aslt‐Family Agg Aslt‐NonFam Burg‐Res Burg‐All Other 1103 1076 1229 1453 1445 1345 1349 0 200 400 600 800 1000 1200 1400 1600 2011 2012 2013 2014 2015 2016 2017 Year‐to‐Date Totals (Jan 1 through Oct 24) Homicide Sex Assault Robbery‐Bus. Robbery‐Other Agg Aslt‐Family Agg Aslt‐NonFam Burg‐Res Burg‐All Other Larc‐Veh Burg Larc‐All Other Vehicle Theft0 2 4 6 8 10 12 14 Sep 25‐Oct 01 Oct 02‐Oct 08 Oct 09‐Oct 15 Oct 16‐Oct 22 Last 28 Day Breakdown by Week ‐ Part 2 Vehicle Burglary Other Larceny Vehicle Theft Page 5 of 9
- 6. Salt Lake City Police Department 2017 2016 Chg % Chg 2017 2016 Chg % Chg 2017 Recent Chg Recent % Chg 2017 2016 % Chg Avg** % Chg Avg** % Chg Criminal Homicide 0 0 0 /0 1 0 1 /0 0 1 /0 5 2 150.0% 1.67 200.0% 1.20 316.7% Sexual Assault 3 3 0 0.0% 13 11 2 18.2% 13 0 0.0% 94 82 14.6% 66.67 41.0% 55.40 69.7% Robbery ‐ Business 1 0 1 /0 4 0 4 /0 1 3 300.0% 59 43 37.2% 36.33 62.4% 32.20 83.2% Robbery ‐ All Other 2 5 ‐3 ‐60.0% 8 10 ‐2 ‐20.0% 8 0 0.0% 130 136 ‐4.4% 130 0.0% 117 11.3% Agg. Assault ‐ Family 0 1 ‐1 ‐100.0% 1 4 ‐3 ‐75.0% 2 ‐1 ‐50.0% 26 22 18.2% 23.67 9.9% 26.00 0.0% Agg. Assault ‐ NonFamily 2 4 ‐2 ‐50.0% 6 20 ‐14 ‐70.0% 17 ‐11 ‐64.7% 204 220 ‐7.3% 198 3.0% 187 9.0% Burglary ‐ Residential 1 6 ‐5 ‐83.3% 10 11 ‐1 ‐9.1% 10 0 0.0% 157 144 9.0% 140 12.1% 138 13.8% Burglary ‐ All Other 4 4 0 0.0% 12 14 ‐2 ‐14.3% 17 ‐5 ‐29.4% 175 144 21.5% 146 19.6% 156 12.3% Larceny ‐ Vehicle Burglary 27 31 ‐4 ‐12.9% 99 103 ‐4 ‐3.9% 89 10 11.2% 1,068 1,041 2.6% 1155 ‐7.5% 1180 ‐9.5% Larceny ‐ All Other 29 60 ‐31 ‐51.7% 148 207 ‐59 ‐28.5% 186 ‐38 ‐20.4% 2,110 2,162 ‐2.4% 2230 ‐5.4% 2162 ‐2.4% Motor Vehicle Theft 10 6 4 66.7% 32 39 ‐7 ‐17.9% 22 10 45.5% 352 330 6.7% 340 3.6% 310 13.7% TOTAL 79 120 ‐41 ‐34.2% 334 419 ‐85 ‐20.3% 365 ‐31 ‐8.5% 4,380 4,326 1.2% 4467 ‐2.0% 4364 0.4% Sep 25Oct 02‐Oct 09 Oct 16‐Oct 2011 2012 2013 2014 2015 2016 2017 Homicide 1 0 0 0 2 1 0 3 0 2 5 Sex Assault 2 4 4 3 37 40 37 62 56 82 94 Robbery ‐ Business 2 1 0 1 30 22 30 26 40 43 59 Robbery ‐ All Other 2 3 1 2 80 82 112 120 134 136 130 Aggravated Assault ‐ Family 1 0 0 0 18 24 35 24 25 22 26 Aggravated Assault ‐ All Other 2 1 1 2 156 165 177 181 193 220 204 Burglary ‐ Residential 2 4 3 1 149 114 156 131 145 144 157 Burglary ‐ All Other 2 5 1 4 92 193 147 134 161 144 175 Larceny ‐ Vehicle Burglary 14 32 26 27 831 1340 1094 1167 1257 1041 1068 Larceny ‐ All Other 41 31 47 29 1428 1761 2359 2266 2262 2162 2110 Vehicle Theft 5 8 9 10 227 233 296 285 404 330 352 TOTALS 74 89 92 79 3050 3975 4443 4399 4677 4326 4380 Year‐to‐Date Totals (Jan 1 through Oct 24) Note: Charts may erroneously show an apparent drop in the most current data due to some cases not yet having been reported and/or recorded. The figures included in this report are preliminary figures for general situational awareness and trend purposes only. They do not represent the official figures of the Salt Lake City Police Department and are subject to further analysis and revision. Due to the statute‐driven, changing nature of crime classification and area boundaries over time, be advised that the figures contained may not fully coincide with SLCPD statistical sources. Differences are reflective of the departmental procedures or policies that were in place at the time the events occurred and the date the data was compiled. In addition, data may be approximate in relation to indicated areas. Additionally, they are not Uniform Crime Reporting (UCR) or "crime rate" numbers and are not intended to be used as such. Rather, they are a breakdown of every offense within every case that occurred during the given time periods. Although every reasonable effort is made to verify their accuracy, the accuracy of any data is subject to the constraints of the report generation process as well as the manner, format, and point in time of any query. CompStat Report……. Council District 4 ‐ Breakdown of All Offenses *The above CompStat figures were generated on Wednesday, 3 day(s) after the closing date, which is indicated in the title. The figures are current as of the date generated. Last 7 Days* Last 28 Days* Previous 28 Days* (Prior to Last 28 Days) Year to Date (YTD)* 3‐Year YTD Average* 5‐Year YTD Average* Volume 3 ‐‐ Number 42 **Averages greater than or equal to 100 are rounded to a whole digit to maintain a consistent column size. Report Covering the Week 10/16/2017 Through 10/22/2017 (Mon‐Sun) 0 1 2 3 4 5 6 Sep 25‐Oct 01 Oct 02‐Oct 08 Oct 09‐Oct 15 Oct 16‐Oct 22 Last 28 Day Breakdown by Week ‐ Part 1 Homicide Sex Assault Robbery‐Bus. Robbery‐Other Agg Aslt‐Family Agg Aslt‐NonFam Burg‐Res Burg‐All Other 3050 3975 4443 4399 4677 4326 4380 0 500 1000 1500 2000 2500 3000 3500 4000 4500 5000 2011 2012 2013 2014 2015 2016 2017 Year‐to‐Date Totals (Jan 1 through Oct 24) Homicide Sex Assault Robbery‐Bus. Robbery‐Other Agg Aslt‐Family Agg Aslt‐NonFam Burg‐Res Burg‐All Other Larc‐Veh Burg Larc‐All Other Vehicle Theft0 5 10 15 20 25 30 35 40 45 50 Sep 25‐Oct 01 Oct 02‐Oct 08 Oct 09‐Oct 15 Oct 16‐Oct 22 Last 28 Day Breakdown by Week ‐ Part 2 Vehicle Burglary Other Larceny Vehicle Theft Page 6 of 9
- 7. Salt Lake City Police Department 2017 2016 Chg % Chg 2017 2016 Chg % Chg 2017 Recent Chg Recent % Chg 2017 2016 % Chg Avg** % Chg Avg** % Chg Criminal Homicide 0 0 0 /0 0 0 0 /0 0 0 /0 2 0 /0 0.67 200.0% 1.00 100.0% Sexual Assault 0 0 0 /0 4 3 1 33.3% 4 0 0.0% 44 37 18.9% 29.67 48.3% 26.80 64.2% Robbery ‐ Business 0 1 ‐1 ‐100.0% 3 3 0 0.0% 1 2 200.0% 29 30 ‐3.3% 24.33 19.2% 24.20 19.8% Robbery ‐ All Other 1 1 0 0.0% 1 4 ‐3 ‐75.0% 5 ‐4 ‐80.0% 41 52 ‐21.2% 46.33 ‐11.5% 43.00 ‐4.7% Agg. Assault ‐ Family 1 1 0 0.0% 1 2 ‐1 ‐50.0% 1 0 0.0% 15 25 ‐40.0% 25.67 ‐41.6% 25.40 ‐40.9% Agg. Assault ‐ NonFamily 3 4 ‐1 ‐25.0% 9 15 ‐6 ‐40.0% 7 2 28.6% 83 107 ‐22.4% 78.67 5.5% 77.00 7.8% Burglary ‐ Residential 5 2 3 150.0% 22 10 12 120.0% 18 4 22.2% 141 169 ‐16.6% 174 ‐19.1% 175 ‐19.3% Burglary ‐ All Other 1 5 ‐4 ‐80.0% 5 10 ‐5 ‐50.0% 7 ‐2 ‐28.6% 136 112 21.4% 109 24.8% 111 22.5% Larceny ‐ Vehicle Burglary 13 12 1 8.3% 60 75 ‐15 ‐20.0% 41 19 46.3% 569 778 ‐26.9% 697 ‐18.4% 631 ‐9.8% Larceny ‐ All Other 39 30 9 30.0% 144 127 17 13.4% 128 16 12.5% 1,633 1,773 ‐7.9% 1772 ‐7.8% 1587 2.9% Motor Vehicle Theft 6 5 1 20.0% 29 31 ‐2 ‐6.5% 23 6 26.1% 283 293 ‐3.4% 285 ‐0.8% 258 9.6% TOTAL 69 61 8 13.1% 278 280 ‐2 ‐0.7% 235 43 18.3% 2,976 3,376 ‐11.8% 3243 ‐8.2% 2959 0.6% Sep 25Oct 02‐Oct 09 Oct 16‐Oct 2011 2012 2013 2014 2015 2016 2017 Homicide 0 0 0 0 2 0 3 0 2 0 2 Sex Assault 2 2 0 0 20 25 20 25 27 37 44 Robbery ‐ Business 2 1 0 0 19 19 29 21 22 30 29 Robbery ‐ All Other 0 0 0 1 44 31 45 48 39 52 41 Aggravated Assault ‐ Family 0 0 0 1 25 22 28 31 21 25 15 Aggravated Assault ‐ All Other 3 2 1 3 63 69 80 58 71 107 83 Burglary ‐ Residential 6 5 6 5 170 162 189 156 198 169 141 Burglary ‐ All Other 1 0 3 1 84 108 120 97 118 112 136 Larceny ‐ Vehicle Burglary 22 10 15 13 468 578 485 584 729 778 569 Larceny ‐ All Other 36 35 34 39 841 1267 1350 1624 1919 1773 1633 Vehicle Theft 8 8 7 6 145 193 242 265 298 293 283 TOTALS 80 63 66 69 1881 2474 2591 2909 3444 3376 2976 Year‐to‐Date Totals (Jan 1 through Oct 24) Note: Charts may erroneously show an apparent drop in the most current data due to some cases not yet having been reported and/or recorded. The figures included in this report are preliminary figures for general situational awareness and trend purposes only. They do not represent the official figures of the Salt Lake City Police Department and are subject to further analysis and revision. Due to the statute‐driven, changing nature of crime classification and area boundaries over time, be advised that the figures contained may not fully coincide with SLCPD statistical sources. Differences are reflective of the departmental procedures or policies that were in place at the time the events occurred and the date the data was compiled. In addition, data may be approximate in relation to indicated areas. Additionally, they are not Uniform Crime Reporting (UCR) or "crime rate" numbers and are not intended to be used as such. Rather, they are a breakdown of every offense within every case that occurred during the given time periods. Although every reasonable effort is made to verify their accuracy, the accuracy of any data is subject to the constraints of the report generation process as well as the manner, format, and point in time of any query. CompStat Report……. Council District 5 ‐ Breakdown of All Offenses *The above CompStat figures were generated on Wednesday, 3 day(s) after the closing date, which is indicated in the title. The figures are current as of the date generated. Last 7 Days* Last 28 Days* Previous 28 Days* (Prior to Last 28 Days) Year to Date (YTD)* 3‐Year YTD Average* 5‐Year YTD Average* Volume 3 ‐‐ Number 42 **Averages greater than or equal to 100 are rounded to a whole digit to maintain a consistent column size. Report Covering the Week 10/16/2017 Through 10/22/2017 (Mon‐Sun) 0 1 2 3 4 5 6 7 Sep 25‐Oct 01 Oct 02‐Oct 08 Oct 09‐Oct 15 Oct 16‐Oct 22 Last 28 Day Breakdown by Week ‐ Part 1 Homicide Sex Assault Robbery‐Bus. Robbery‐Other Agg Aslt‐Family Agg Aslt‐NonFam Burg‐Res Burg‐All Other 1881 2474 2591 2909 3444 3376 2976 0 500 1000 1500 2000 2500 3000 3500 4000 2011 2012 2013 2014 2015 2016 2017 Year‐to‐Date Totals (Jan 1 through Oct 24) Homicide Sex Assault Robbery‐Bus. Robbery‐Other Agg Aslt‐Family Agg Aslt‐NonFam Burg‐Res Burg‐All Other Larc‐Veh Burg Larc‐All Other Vehicle Theft0 5 10 15 20 25 30 35 40 45 Sep 25‐Oct 01 Oct 02‐Oct 08 Oct 09‐Oct 15 Oct 16‐Oct 22 Last 28 Day Breakdown by Week ‐ Part 2 Vehicle Burglary Other Larceny Vehicle Theft Page 7 of 9
- 8. Salt Lake City Police Department 2017 2016 Chg % Chg 2017 2016 Chg % Chg 2017 Recent Chg Recent % Chg 2017 2016 % Chg Avg** % Chg Avg** % Chg Criminal Homicide 0 0 0 /0 0 0 0 /0 0 0 /0 1 0 /0 0.00 /0 0.00 /0 Sexual Assault 0 0 0 /0 0 2 ‐2 ‐100.0% 0 0 /0 3 4 ‐25.0% 4.33 ‐30.8% 5.00 ‐40.0% Robbery ‐ Business 0 0 0 /0 0 0 0 /0 0 0 /0 5 4 25.0% 5.67 ‐11.8% 4.40 13.6% Robbery ‐ All Other 0 0 0 /0 1 0 1 /0 0 1 /0 3 2 50.0% 2.00 50.0% 2.80 7.1% Agg. Assault ‐ Family 0 0 0 /0 0 0 0 /0 0 0 /0 5 2 150.0% 2.00 150.0% 1.60 212.5% Agg. Assault ‐ NonFamily 1 0 1 /0 1 0 1 /0 1 0 0.0% 9 4 125.0% 5.00 80.0% 7.60 18.4% Burglary ‐ Residential 0 0 0 /0 4 5 ‐1 ‐20.0% 4 0 0.0% 69 70 ‐1.4% 72.33 ‐4.6% 70.00 ‐1.4% Burglary ‐ All Other 0 0 0 /0 0 3 ‐3 ‐100.0% 2 ‐2 ‐100.0% 37 18 105.6% 22.67 63.2% 25.20 46.8% Larceny ‐ Vehicle Burglary 10 5 5 100.0% 39 26 13 50.0% 25 14 56.0% 283 294 ‐3.7% 300 ‐5.7% 286 ‐1.0% Larceny ‐ All Other 0 6 ‐6 ‐100.0% 9 23 ‐14 ‐60.9% 19 ‐10 ‐52.6% 183 167 9.6% 179 2.4% 166 10.5% Motor Vehicle Theft 0 2 ‐2 ‐100.0% 4 6 ‐2 ‐33.3% 7 ‐3 ‐42.9% 60 47 27.7% 64.67 ‐7.2% 69.80 ‐14.0% TOTAL 11 13 ‐2 ‐15.4% 58 65 ‐7 ‐10.8% 58 0 0.0% 658 612 7.5% 657 0.1% 638 3.1% Sep 25Oct 02‐Oct 09 Oct 16‐Oct 2011 2012 2013 2014 2015 2016 2017 Homicide 0 0 0 0 0 0 0 0 0 0 1 Sex Assault 0 0 0 0 6 7 5 5 4 4 3 Robbery ‐ Business 0 0 0 0 3 2 3 7 6 4 5 Robbery ‐ All Other 1 0 0 0 6 5 3 1 3 2 3 Aggravated Assault ‐ Family 0 0 0 0 5 0 2 2 2 2 5 Aggravated Assault ‐ All Other 0 0 0 1 7 15 8 4 7 4 9 Burglary ‐ Residential 1 1 2 0 70 58 75 69 78 70 69 Burglary ‐ All Other 0 0 0 0 28 20 38 26 24 18 37 Larceny ‐ Vehicle Burglary 12 8 9 10 370 267 263 261 345 294 283 Larceny ‐ All Other 3 3 3 0 161 154 138 188 181 167 183 Vehicle Theft 2 0 2 0 61 86 69 65 82 47 60 TOTALS 19 12 16 11 717 614 604 628 732 612 658 Year‐to‐Date Totals (Jan 1 through Oct 24) Note: Charts may erroneously show an apparent drop in the most current data due to some cases not yet having been reported and/or recorded. The figures included in this report are preliminary figures for general situational awareness and trend purposes only. They do not represent the official figures of the Salt Lake City Police Department and are subject to further analysis and revision. Due to the statute‐driven, changing nature of crime classification and area boundaries over time, be advised that the figures contained may not fully coincide with SLCPD statistical sources. Differences are reflective of the departmental procedures or policies that were in place at the time the events occurred and the date the data was compiled. In addition, data may be approximate in relation to indicated areas. Additionally, they are not Uniform Crime Reporting (UCR) or "crime rate" numbers and are not intended to be used as such. Rather, they are a breakdown of every offense within every case that occurred during the given time periods. Although every reasonable effort is made to verify their accuracy, the accuracy of any data is subject to the constraints of the report generation process as well as the manner, format, and point in time of any query. CompStat Report……. Council District 6 ‐ Breakdown of All Offenses *The above CompStat figures were generated on Wednesday, 3 day(s) after the closing date, which is indicated in the title. The figures are current as of the date generated. Last 7 Days* Last 28 Days* Previous 28 Days* (Prior to Last 28 Days) Year to Date (YTD)* 3‐Year YTD Average* 5‐Year YTD Average* Volume 3 ‐‐ Number 42 **Averages greater than or equal to 100 are rounded to a whole digit to maintain a consistent column size. Report Covering the Week 10/16/2017 Through 10/22/2017 (Mon‐Sun) 0 1 2 3 Sep 25‐Oct 01 Oct 02‐Oct 08 Oct 09‐Oct 15 Oct 16‐Oct 22 Last 28 Day Breakdown by Week ‐ Part 1 Homicide Sex Assault Robbery‐Bus. Robbery‐Other Agg Aslt‐Family Agg Aslt‐NonFam Burg‐Res Burg‐All Other 717 614 604 628 732 612 658 0 100 200 300 400 500 600 700 800 2011 2012 2013 2014 2015 2016 2017 Year‐to‐Date Totals (Jan 1 through Oct 24) Homicide Sex Assault Robbery‐Bus. Robbery‐Other Agg Aslt‐Family Agg Aslt‐NonFam Burg‐Res Burg‐All Other Larc‐Veh Burg Larc‐All Other Vehicle Theft0 2 4 6 8 10 12 14 Sep 25‐Oct 01 Oct 02‐Oct 08 Oct 09‐Oct 15 Oct 16‐Oct 22 Last 28 Day Breakdown by Week ‐ Part 2 Vehicle Burglary Other Larceny Vehicle Theft Page 8 of 9
- 9. Salt Lake City Police Department 2017 2016 Chg % Chg 2017 2016 Chg % Chg 2017 Recent Chg Recent % Chg 2017 2016 % Chg Avg** % Chg Avg** % Chg Criminal Homicide 0 0 0 /0 0 0 0 /0 0 0 /0 0 0 /0 0.33 ‐100.0% 0.40 ‐100.0% Sexual Assault 1 0 1 /0 4 1 3 300.0% 2 2 100.0% 21 10 110.0% 9.33 125.0% 11.80 78.0% Robbery ‐ Business 1 0 1 /0 2 1 1 100.0% 0 2 /0 10 25 ‐60.0% 20.67 ‐51.6% 17.60 ‐43.2% Robbery ‐ All Other 0 2 ‐2 ‐100.0% 0 2 ‐2 ‐100.0% 0 0 /0 11 19 ‐42.1% 12.67 ‐13.2% 14.00 ‐21.4% Agg. Assault ‐ Family 0 0 0 /0 0 1 ‐1 ‐100.0% 2 ‐2 ‐100.0% 5 8 ‐37.5% 11.67 ‐57.1% 11.80 ‐57.6% Agg. Assault ‐ NonFamily 0 1 ‐1 ‐100.0% 1 6 ‐5 ‐83.3% 1 0 0.0% 12 33 ‐63.6% 32.33 ‐62.9% 34.60 ‐65.3% Burglary ‐ Residential 5 1 4 400.0% 11 7 4 57.1% 13 ‐2 ‐15.4% 103 102 1.0% 115 ‐10.2% 117 ‐12.3% Burglary ‐ All Other 2 1 1 100.0% 10 2 8 400.0% 6 4 66.7% 84 85 ‐1.2% 74.00 13.5% 75.80 10.8% Larceny ‐ Vehicle Burglary 8 10 ‐2 ‐20.0% 50 62 ‐12 ‐19.4% 38 12 31.6% 475 574 ‐17.2% 589 ‐19.3% 534 ‐11.1% Larceny ‐ All Other 13 20 ‐7 ‐35.0% 62 86 ‐24 ‐27.9% 72 ‐10 ‐13.9% 810 846 ‐4.3% 841 ‐3.6% 784 3.3% Motor Vehicle Theft 7 2 5 250.0% 22 19 3 15.8% 15 7 46.7% 148 150 ‐1.3% 155 ‐4.3% 151 ‐2.2% TOTAL 37 37 0 0.0% 162 187 ‐25 ‐13.4% 149 13 8.7% 1,679 1,852 ‐9.3% 1860 ‐9.7% 1753 ‐4.2% Sep 25Oct 02‐Oct 09 Oct 16‐Oct 2011 2012 2013 2014 2015 2016 2017 Homicide 0 0 0 0 1 1 0 0 1 0 0 Sex Assault 1 2 0 1 6 16 15 9 9 10 21 Robbery ‐ Business 0 0 1 1 12 6 20 19 18 25 10 Robbery ‐ All Other 0 0 0 0 17 17 15 7 12 19 11 Aggravated Assault ‐ Family 0 0 0 0 5 14 10 8 19 8 5 Aggravated Assault ‐ All Other 1 0 0 0 32 38 38 28 36 33 12 Burglary ‐ Residential 3 0 3 5 100 110 133 102 140 102 103 Burglary ‐ All Other 4 2 2 2 49 103 54 65 72 85 84 Larceny ‐ Vehicle Burglary 14 18 10 8 427 486 420 500 692 574 475 Larceny ‐ All Other 16 15 18 13 619 622 777 821 855 846 810 Vehicle Theft 6 3 6 7 102 141 152 147 167 150 148 TOTALS 45 40 40 37 1370 1554 1634 1706 2021 1852 1679 Year‐to‐Date Totals (Jan 1 through Oct 24) Note: Charts may erroneously show an apparent drop in the most current data due to some cases not yet having been reported and/or recorded. The figures included in this report are preliminary figures for general situational awareness and trend purposes only. They do not represent the official figures of the Salt Lake City Police Department and are subject to further analysis and revision. Due to the statute‐driven, changing nature of crime classification and area boundaries over time, be advised that the figures contained may not fully coincide with SLCPD statistical sources. Differences are reflective of the departmental procedures or policies that were in place at the time the events occurred and the date the data was compiled. In addition, data may be approximate in relation to indicated areas. Additionally, they are not Uniform Crime Reporting (UCR) or "crime rate" numbers and are not intended to be used as such. Rather, they are a breakdown of every offense within every case that occurred during the given time periods. Although every reasonable effort is made to verify their accuracy, the accuracy of any data is subject to the constraints of the report generation process as well as the manner, format, and point in time of any query. *The above CompStat figures were generated on Wednesday, 3 day(s) after the closing date, which is indicated in the title. The figures are current as of the date generated. CompStat Report……. Council District 7 ‐ Breakdown of All Offenses Volume 3 ‐‐ Number 42 Last 7 Days* Last 28 Days* Previous 28 Days* (Prior to Last 28 Days) Year to Date (YTD)* 3‐Year YTD Average* 5‐Year YTD Average* **Averages greater than or equal to 100 are rounded to a whole digit to maintain a consistent column size. Report Covering the Week 10/16/2017 Through 10/22/2017 (Mon‐Sun) 0 1 2 3 4 5 6 Sep 25‐Oct 01 Oct 02‐Oct 08 Oct 09‐Oct 15 Oct 16‐Oct 22 Last 28 Day Breakdown by Week ‐ Part 1 Homicide Sex Assault Robbery‐Bus. Robbery‐Other Agg Aslt‐Family Agg Aslt‐NonFam Burg‐Res Burg‐All Other 1370 1554 1634 1706 2021 1852 1679 0 500 1000 1500 2000 2500 2011 2012 2013 2014 2015 2016 2017 Year‐to‐Date Totals (Jan 1 through Oct 24) Homicide Sex Assault Robbery‐Bus. Robbery‐Other Agg Aslt‐Family Agg Aslt‐NonFam Burg‐Res Burg‐All Other Larc‐Veh Burg Larc‐All Other Vehicle Theft0 2 4 6 8 10 12 14 16 18 20 Sep 25‐Oct 01 Oct 02‐Oct 08 Oct 09‐Oct 15 Oct 16‐Oct 22 Last 28 Day Breakdown by Week ‐ Part 2 Vehicle Burglary Other Larceny Vehicle Theft Page 9 of 9