SlideShare a Scribd company logo
1 of 7
CARRETERA: UBICACIÓN:
TRAMO: SENTIDO:
ESTACION: FECHA:
HORA
Autos Pick up C.R. Micros B2 B3 C2 C3 C4 T2S2 T2S3 T3S2 T3S3 C2R2 C2R3 C3R2 C3R3 C4R2 E7 TOTAL %
0-1 10 4 - - - - 2 - 1 1 1 - 1 1 1 - - - 22 0.66%
1-2 24 4 - - 1 1 - - 1 1 1 1 1 1 - 1 - - 37 1.10%
2-3 35 6 - - - 1 2 1 1 - 1 1 1 1 1 1 - - 52 1.55%
3-4 30 9 5 1 - 1 1 - 1 - - 1 - - 1 1 - - 51 1.52%
4-5 28 4 9 2 1 - 2 - 1 1 - - - 1 1 1 - - 51 1.52%
5-6 36 13 16 2 1 1 2 1 1 - 1 1 1 1 1 1 - - 79 2.36%
6-7 51 11 57 2 - - 1 - 1 1 1 1 1 1 1 1 - - 130 3.88%
7-8 56 19 106 1 1 1 1 1 - 1 1 1 1 1 - - - - 191 5.70%
8-9 51 18 109 2 1 1 1 - 1 1 1 1 1 1 1 1 - - 191 5.70%
9-10 49 24 104 3 1 - - - 1 1 - 1 1 - 1 - - - 186 5.55%
10-11 57 21 83 3 - - 1 1 1 1 1 - 1 1 - 1 - - 172 5.13%
11-12 76 27 116 1 1 1 2 1 - 1 - 1 1 1 1 - - - 230 6.86%
12-13 65 23 123 1 - 1 1 1 - 1 1 1 1 - 1 1 - - 221 6.60%
13-14 76 5 129 1 - 1 - 1 1 1 - - - - - 1 - - 216 6.45%
14-15 66 7 121 1 1 1 1 - - 1 - 1 1 1 - 1 - - 203 6.06%
15-16 52 17 134 3 - 1 2 1 1 1 1 1 - - 1 1 - - 216 6.45%
16-17 51 13 110 3 1 1 - 1 - 1 1 1 - 1 1 1 - - 186 5.55%
17-18 70 15 110 1 1 1 - 1 1 1 1 - 1 1 - 1 - - 205 6.12%
18-19 42 16 93 1 - - 2 1 1 1 1 - 1 1 1 1 - - 162 4.83%
19-20 61 17 80 2 1 1 2 1 1 1 1 1 1 - - - - - 170 5.07%
20-21 54 12 75 2 1 - 1 1 - - 1 - 1 1 1 1 - - 151 4.51%
21-22 41 8 52 1 1 - - 1 - 1 1 1 1 1 1 1 - - 111 3.31%
22-23 26 7 24 1 1 1 - 1 - - 1 1 1 1 - 1 - - 66 1.97%
23-24 29 7 9 - 1 - 1 - 1 - 1 1 - 1 - 1 - - 52 1.55%
TOTAL 1,136 307 1,665 34 15 15 25 15 16 18 18 17 18 18 15 19 - - - 3,351 100.00%
% 33.90% 9.16% 49.69% 1.01% 0.45% 0.45% 0.75% 0.45% 0.48% 0.54% 0.54% 0.51% #### 0.54% 0.45% 0.57% 0.00% 0.00% 0.00% 100.00%
CONTEO Y CLASIFICACION DEL TRAFICO
VEHICULOS LIGEROS BUS CAMIONES UNITARIOS CAMIONES ACOPLADOS
CARRETERA: UBICACIÓN:
TRAMO: SENTIDO:
ESTACION: FECHA:
HORA
Autos Pick up C.R. Micros B2 B3 C2 C3 C4 T2S2 T2S3 T3S2 T3S3 C2R2 C2R3 C3R2 C3R3 C4R2 E7 TOTAL %
0-1 15 4 1 - - 1 2 1 1 1 1 1 - - - 1 - - 29 0.85%
1-2 30 4 - - 1 1 2 1 1 - 1 1 1 - - 1 - - 44 1.29%
2-3 36 7 1 - 1 1 2 1 1 - 1 1 - - - - - - 52 1.53%
3-4 31 7 - - - 1 2 1 1 - 1 1 1 1 1 1 - - 49 1.44%
4-5 32 1 9 - - 1 2 1 - 1 1 1 - - 1 1 - - 51 1.50%
5-6 40 9 42 - 1 1 1 1 1 - 1 1 1 1 1 1 - - 102 3.00%
6-7 56 13 68 - 1 1 1 1 - - 1 1 - 1 - 1 - - 145 4.26%
7-8 57 18 101 2 1 1 2 1 1 1 1 1 1 - 1 1 - - 190 5.59%
8-9 54 16 106 - 1 1 1 1 1 1 - - - - - 1 - - 183 5.38%
9-10 53 24 103 - 1 1 1 - 1 1 1 - 1 1 1 1 - - 190 5.59%
10-11 60 19 83 3 1 1 1 1 - - 1 1 - 1 1 1 - - 174 5.12%
11-12 82 25 125 2 - - 1 1 1 1 1 1 1 - 1 - - - 242 7.12%
12-13 71 19 123 1 1 1 1 1 1 1 - - 1 - 1 1 - - 223 6.56%
13-14 70 9 122 2 - - - 1 1 - - 1 - 1 1 - - - 208 6.12%
14-15 67 11 135 3 1 1 1 - 1 1 1 1 1 - - - - - 224 6.59%
15-16 62 12 130 1 1 1 1 1 1 1 1 - 1 1 1 - - - 215 6.32%
16-17 56 9 114 4 1 1 1 1 1 1 1 1 1 1 1 - - - 194 5.70%
17-18 65 11 113 1 - - 1 1 1 1 1 1 1 1 1 1 - - 200 5.88%
18-19 54 16 94 2 1 1 1 1 - 1 - - 1 1 - - - - 173 5.09%
19-20 60 13 80 - 1 1 1 - 1 1 1 - 1 1 - 1 - - 162 4.76%
20-21 57 9 72 1 - - 1 - - - 1 - - 1 1 1 - - 144 4.23%
21-22 39 8 48 - 1 1 - 1 1 1 - 1 - 1 1 1 - - 104 3.06%
22-23 22 5 19 1 1 1 1 - 1 - 1 1 - 1 1 1 - - 56 1.65%
23-24 22 7 6 - 1 1 2 1 1 1 1 - 1 1 1 1 - - 47 1.38%
TOTAL 1,191 276 1,695 23 17 20 29 19 19 15 19 16 14 15 16 17 - - - 3,401 100.00%
% 35.02% 8.12% 49.84% 0.68% 0.50% 0.59% 0.85% 0.56% 0.56% 0.44% 0.56% 0.47% 0.41% 0.44% 0.47% 0.50% 0.00% 0.00% 0.00% 100.00%
CONTEO Y CLASIFICACION DEL TRAFICO
VEHICULOS LIGEROS BUS CAMIONES
######################
SEMI TRAILER TRAILER
CARRETERA:CARRETERA: UBICACIÓN:
TRAMO:TRAMO: SENTIDO:
ESTACION:ESTACION: FECHA:
HORA
Autos Autos Pick up C.R. Micros B2 B3 C2 C3 C4 T2S2 T2S3 T3S2 T3S3 C2R2 C2R3 C3R2 C3R3 C4R2 TOTAL %
0-1 40 7 3 - - 1 - - 1 - 1 1 1 - - 1 - - 56 1.61%
1-2 34 9 2 1 - - 2 - 1 - - 1 - - - - - - • 50 1.44%
2-3 41 6 1 - 1 1 2 3 1 1 - - - 3 - 1 - - 61 1.75%
3-4 58 7 2 - - 1 5 2 - 1 - - - - - - - - 76 2.18%
4-5 40 6 6 - 4 - 7 2 2 1 2 - - - 1 - - - 71 2.04%
5-6 46 9 15 1 2 - 3 2 1 - 1 - - - 1 - - - 81 2.33%
6-7 57 9 57 1 1 - 26 3 1 1 - - 1 1 2 - - - 160 4.60%
7-8 67 6 82 2 2 1 14 5 2 2 1 - 1 - 3 - - - 188 5.40%
8-9 67 5 85 1 3 1 18 4 2 1 1 2 1 1 2 - - - 194 5.57%
9-10 70 9 90 - 3 1 18 6 2 3 - 1 1 - 1 - - - 205 5.89%
10-11 59 11 87 - 2 1 16 4 2 1 1 2 1 - 2 - - - 189 5.43%
11-12 60 11 92 - 2 1 20 7 5 1 2 1 2 - 4 - - - 208 5.97%
12-13 70 6 67 2 2 2 24 4 4 1 2 - 2 1 3 - - 1 191 5.49%
13-14 70 8 94 - 2 2 25 5 4 2 3 2 1 2 2 1 - - 1 224 6.43%
14-15 62 4 99 1 3 1 32 4 4 2 1 2 1 1 3 - - - 1 221 6.35%
15-16 60 5 95 1 4 2 26 4 4 2 2 1 1 - 2 - - 1 1 211 6.06%
16-17 62 10 88 2 3 - 21 5 2 - 2 - - 1 2 - - - 198 5.69%
17-18 66 6 81 1 2 2 23 6 4 2 - 3 1 1 3 - - - 201 5.77%
18-19 67 7 55 2 - 2 26 4 6 2 1 1 2 1 4 - 1 - 181 5.20%
19-20 41 8 38 - - 2 20 5 4 1 2 1 2 1 3 1 1 1 131 3.76%
20-21 52 5 33 - 2 - 11 3 3 - 2 1 1 - 3 1 - - 117 3.36%
21-22 61 5 28 - 2 1 7 3 1 1 2 - 2 1 3 - 1 - 118 3.39%
22-23 38 4 26 - 2 1 4 1 1 1 1 1 1 1 1 - 1 1 85 2.44%
23-24 31 4 18 - 1 1 5 - 1 1 1 1 - - 1 - - - 65 1.87%
TOTAL 1,319 167 1,244 15 43 24 355 82 58 27 28 21 22 15 46 5 4 4 3 3,482 100.00%
% 37.88% 4.80% 35.73% 0.43% 1.23% 0.69% 10.20% 2.35% 1.67% 0.78% 0.80% 0.60% 0.63% 0.43% 1.32% 0.14% 0.11% 0.11% 0.09% 100.00%
CONTEO Y CLASIFICACION DEL TRAFICO
VEHICULOS LIGEROS BUS CAMIONES
################
SEMI TRAILER TRAILER
CARRETERA: UBICACIÓN:
TRAMO: SENTIDO:
ESTACION: FECHA:
HORA
Autos Pick up C.R. Micros B2 B3 C2 C3 C4 T2S2 T2S3 T3S2 T3S3 C2R2 C2R3 C3R2 C3R3 C4R2 E7 TOTAL %
0-1 39 10 3 - - 1 1 1 1 1 - - 1 - - 1 - - 59 2.21%
1-2 38 8 2 1 1 1 2 1 1 1 1 1 1 1 1 1 - - 62 2.32%
2-3 36 7 1 - 1 1 2 1 1 1 1 - - 1 - 1 - - 54 2.02%
3-4 45 5 1 - - 1 1 1 1 - - 1 1 1 - - - - 58 2.17%
4-5 44 4 6 - 1 1 2 1 1 1 - 1 1 1 1 - - - 65 2.44%
5-6 45 7 18 1 1 - 2 - 1 1 - 1 1 - - - - - 78 2.92%
6-7 52 6 52 2 1 1 1 1 - 1 1 - 1 - - 1 - - 120 4.50%
7-8 61 7 55 4 1 1 1 1 1 1 1 1 1 1 1 1 - - 139 5.21%
8-9 61 7 72 2 1 - 1 - - - 1 1 - - 1 1 - - 148 5.55%
9-10 68 11 71 2 1 1 1 1 - 1 1 - 1 1 1 - - - 161 6.04%
10-11 52 10 76 4 1 1 2 - 1 - 1 1 1 1 1 1 - - 153 5.74%
11-12 48 7 73 2 1 - - 1 1 1 1 1 1 1 1 1 - - 140 5.25%
12-13 60 5 81 1 1 - 1 - 1 1 - - 1 - - 1 - - 153 5.74%
13-14 63 9 83 2 - 1 2 1 - - - - 1 1 - 1 - - 164 6.15%
14-15 55 4 76 5 - 1 1 1 1 1 - 1 1 1 1 1 - - 150 5.62%
15-16 55 5 79 3 1 - 2 1 1 - - - - - 1 1 - - 149 5.59%
16-17 52 6 74 3 1 1 - - - - - - 1 1 1 1 - - 141 5.29%
17-18 61 6 68 2 1 1 1 1 1 1 - 1 1 1 - 1 - - 147 5.51%
18-19 60 7 46 1 - 1 1 - 1 1 1 - - 1 1 - - - 121 4.54%
19-20 55 8 35 1 - - - 1 1 1 - - 1 1 1 - - - 105 3.94%
20-21 40 5 22 1 1 1 2 1 1 - 1 - 1 - 1 1 - - 78 2.92%
21-22 44 7 21 1 - 1 1 1 1 1 1 1 1 - - - - - 81 3.04%
22-23 51 4 20 2 - - 2 1 1 1 1 - 1 - 1 - - - 85 3.19%
23-24 27 1 18 2 1 - - 1 - 1 1 1 1 1 1 - - - 56 2.10%
TOTAL 1,212 156 1,053 42 16 16 29 18 18 17 13 12 20 15 15 15 - - - 2,667 100.00%
% 45.44% 5.85% 39.48% 1.57% 0.60% 0.60% 1.09% 0.67% 0.67% 0.64% 0.49% 0.45% 0.75% 0.56% 0.56% 0.56% 0.00% 0.00% 0.00% 100.00%
CONTEO Y CLASIFICACION DEL TRAFICO
VEHICULOS LIGEROS BUS CAMIONES
#####################
SEMI TRAILER TRAILER
CARRETERA: UBICACIÓN:
TRAMO: SENTIDO:
ESTACION: FECHA:
HORA
Autos Pick up C.R. Micros B2 B3 C2 C3 C4 T2S2 T2S3 T3S2 T3S3 C2R2 C2R3 C3R2 C3R3 C4R2 E7 TOTAL %
0-1 34 11 3 - - 1 2 - - 1 - 1 1 1 - - - - 55 2.05%
1-2 30 9 2 - 1 1 1 - - 1 1 1 - - 1 1 - - 49 1.83%
2-3 35 8 1 - 1 - 2 1 1 1 1 1 - 1 1 1 - - 55 2.05%
3-4 42 7 2 - 1 - - - 1 1 - 1 - - 1 1 - - 57 2.13%
4-5 39 6 13 1 1 - 2 - - 1 - 1 1 1 1 - - - 67 2.50%
5-6 40 9 12 1 - - - 1 1 1 - 1 1 1 1 1 - - 70 2.61%
6-7 51 6 54 1 - - 1 - - - 1 1 1 1 - 1 - - 118 4.40%
7-8 57 10 55 5 1 1 1 1 - 1 - 1 - - - 1 - - 134 5.00%
8-9 66 9 72 2 1 - - - 1 - - - - 1 1 - - - 153 5.71%
9-10 67 12 72 3 1 1 - 1 1 - - 1 - - - - - - 159 5.93%
10-11 65 12 81 3 1 - 2 1 1 - - - 1 1 1 1 - - 170 6.34%
11-12 48 7 67 2 1 1 2 1 - 1 - 1 1 1 1 1 - - 135 5.04%
12-13 60 6 85 2 - 1 2 - - - 1 - 1 1 - 1 - - 160 5.97%
13-14 69 8 85 2 - 1 1 - 1 1 - 1 1 1 1 - - - 172 6.42%
14-15 56 5 75 4 - 1 1 - 1 1 1 1 1 1 - 1 - - 149 5.56%
15-16 51 4 76 2 1 1 1 1 1 - - 1 1 1 1 1 - - 143 5.34%
16-17 49 6 75 2 1 1 1 1 1 1 1 - 1 - 1 - - - 141 5.26%
17-18 67 6 71 2 1 1 2 1 1 1 1 1 - - 1 - - - 156 5.82%
18-19 55 8 44 1 1 1 - - - 1 - 1 - 1 - 1 - - 114 4.25%
19-20 49 7 35 2 - 1 - 1 - 1 - 1 1 - - 1 - - 99 3.69%
20-21 43 6 30 1 1 1 2 1 1 1 1 1 - - 1 1 - - 91 3.40%
21-22 41 7 25 2 1 1 1 1 1 - 1 - 1 - - - - - 82 3.06%
22-23 51 5 23 1 - 1 1 - - 1 1 1 - 1 - - - - 86 3.21%
23-24 30 2 21 1 1 1 1 1 1 1 1 1 - 1 1 1 - - 65 2.43%
TOTAL ### 176 1,079 40 16 17 26 13 14 17 11 19 13 15 14 15 - - - 2,680 100.00%
% #### 6.57% 40.26% 1.49% 0.60% 0.63% 0.97% 0.49% 0.52% 0.63% 0.41% 0.71% 0.49% 0.56% 0.52% 0.56% 0.00% 0.00% #### 100.00%
CONTEO Y CLASIFICACION DEL TRAFICO
VEHICULOS LIGEROS BUS CAMIONES
#################
SEMI TRAILER TRAILER
CARRETERA: UBICACIÓN:
TRAMO: SENTIDO:
ESTACION: FECHA:
HORA
Autos Pick up C.R. Micros B2 B3 C2 C3 C4 T2S2 T2S3 T3S2 T3S3 C2R2 C2R3 C3R2 C3R3 C4R2 E7 TOTAL %
0-1 28 6 1 - 1 - - 1 1 - - - - 1 - - - - 39 1.43%
1-2 38 7 2 1 1 - 2 1 1 1 1 1 - - 1 1 - - 58 2.13%
2-3 40 8 2 - 1 1 - 1 1 1 - 1 - 1 - 1 - - 58 2.13%
3-4 49 11 3 - - 1 2 1 1 1 1 - 1 1 1 1 - - 74 2.71%
4-5 40 8 6 - 1 1 2 - - - 1 1 1 - - - - - 61 2.24%
5-6 45 10 11 - - - 1 1 1 1 - 1 1 - 1 1 - - 74 2.71%
6-7 53 8 23 1 - - 1 1 1 1 1 1 1 - 1 - - - 93 3.41%
7-8 65 7 75 3 - 1 2 1 - 1 - - 1 - 1 1 - - 158 5.79%
8-9 61 5 80 - 1 1 1 - - 1 1 - 1 - 1 1 - - 154 5.65%
9-10 58 8 76 - 1 - 2 - 1 1 1 1 1 1 - - - - 151 5.54%
10-11 59 9 78 - 1 1 - 1 1 1 1 - 1 - 1 1 - - 155 5.68%
11-12 59 11 86 - - - 2 1 1 1 - - 1 1 1 1 - - 165 6.05%
12-13 65 6 66 2 1 1 - - 1 1 1 1 - 1 1 1 - - 148 5.43%
13-14 65 7 82 - - - 1 1 - - 1 - - 1 1 1 - - 160 5.87%
14-15 56 3 82 - 1 1 1 1 1 - 1 - - - 1 1 - - 149 5.46%
15-16 62 10 90 1 1 1 2 1 1 1 - - 1 - 1 1 - - 173 6.34%
16-17 56 9 78 2 - 1 1 - 1 1 - 1 1 1 - 1 - - 153 5.61%
17-18 64 6 69 1 1 - 2 1 - 1 1 - 1 1 1 1 - - 150 5.50%
18-19 34 7 54 2 1 1 1 - - - - 1 - 1 - 1 - - 103 3.78%
19-20 38 8 40 - - 1 1 1 - 1 1 1 1 - 1 1 - - 95 3.48%
20-21 50 9 40 - - 1 1 - - 1 1 1 1 - 1 - - - 106 3.89%
21-22 65 3 36 - 1 - 1 - 1 1 1 1 1 1 1 - - - 113 4.14%
22-23 41 5 29 1 - 1 1 - 1 - - - 1 - - 1 - - 81 2.97%
23-24 30 2 18 - 1 1 1 - 1 - - - 1 - 1 1 - - 57 2.09%
TOTAL 1,221 173 1,127 14 14 15 28 14 16 17 14 12 17 11 17 18 - - - 2,728 100.00%
% 44.76% 6.34% 41.31% 0.51% 0.51% 0.55% 1.03% 0.51% 0.59% 0.62% 0.51% 0.44% 0.62% 0.40% 0.62% 0.66% 0.00% 0.00% #### 100.00%
CONTEO Y CLASIFICACION DEL TRAFICO
VEHICULOS LIGEROS BUS CAMIONES
#################
SEMI TRAILER TRAILER
CARRETERA: UBICACIÓN:
TRAMO: SENTIDO:
ESTACION: FECHA:
HORA
Autos Pick up C.R. Micros B2 B3 C2 C3 C4 T2S2 T2S3 T3S2 T3S3 C2R2 C2R3 C3R2 C3R3 C4R2 E7 TOTAL %
0-1 42 7 2 - - 1 - 1 1 1 - 1 1 - 1 1 - - 59 1.97%
1-2 32 8 2 - 1 1 1 1 1 1 1 1 1 1 1 1 - - 54 1.80%
2-3 41 7 2 - - - 1 - 1 - - 1 1 1 1 1 - - 57 1.90%
3-4 55 8 2 1 1 1 1 1 - - 1 1 - - 1 1 - - 74 2.47%
4-5 39 5 7 - 1 - 2 1 1 - 1 1 - - 1 1 - - 60 2.00%
5-6 43 10 21 1 1 1 - - - 1 1 - 1 1 1 1 - - 83 2.77%
6-7 47 12 63 - 1 1 2 1 - - 1 1 1 1 1 1 - - 133 4.44%
7-8 69 8 80 1 - - 2 1 1 1 1 1 1 1 1 1 - - 169 5.64%
8-9 78 7 88 - - 1 - 1 1 1 1 1 1 1 1 1 - - 183 6.11%
9-10 58 12 92 1 1 - 2 - - 1 - 1 1 - 1 - - - 170 5.67%
10-11 62 15 89 1 1 - 1 - 1 - 1 1 1 1 1 1 - - 176 5.87%
11-12 64 9 92 - 1 - - 1 - 1 - 1 1 1 - - - - 171 5.71%
12-13 56 8 69 2 1 1 2 1 - 1 1 - 1 1 1 1 - - 146 4.87%
13-14 71 6 91 1 - 1 - 1 - 1 - - 1 1 - 1 - - 175 5.84%
14-15 60 5 94 1 1 - 1 1 1 - - 1 1 1 1 1 - - 169 5.64%
15-16 61 6 107 1 1 1 - 1 1 1 1 - 1 1 1 1 - - 185 6.17%
16-17 70 12 78 - 1 - 2 1 1 1 1 1 1 - 1 1 - - 171 5.71%
17-18 60 7 68 1 1 - 2 - 1 1 1 1 - - 1 1 - - 145 4.84%
18-19 63 10 46 1 1 1 2 1 1 1 1 - 1 1 1 1 - - 132 4.40%
19-20 43 8 49 - 1 1 1 - 1 1 1 1 1 1 1 1 - - 111 3.70%
20-21 54 6 36 1 - - 1 1 1 1 1 1 1 - - 1 - - 105 3.50%
21-22 64 6 38 1 1 1 2 1 1 1 1 1 - - 1 1 - - 120 4.00%
22-23 39 5 28 - - 1 2 - 1 1 1 1 - 1 1 - - - 81 2.70%
23-24 36 3 21 - - 1 1 - - 1 1 1 - 1 1 1 - - 68 2.27%
TOTAL 1,307 190 1,265 14 16 14 28 16 16 18 18 19 18 16 21 21 - - - 2,997 100.00%
% 43.61% 6.34% 42.21% 0.47% 0.53% 0.47% 0.93% 0.53% 0.53% 0.60% 0.60% 0.63% 0.60% 0.53% 0.70% 0.70% 0.00% 0.00% 0.00% 100.00%
CONTEO Y CLASIFICACION DEL TRAFICO
VEHICULOS LIGEROS BUS CAMIONES SEMI TRAILER TRAILER
AutosPick up C.R. Micros B2 B3 C2 C3 C4 T2S2 T2S3 T3S2 T3S3 C2R2 C2R3 C3R2 C3R3 C4R2 E7
JUEVES 1136 307 1665 34 15 15 25 15 16 18 18 17 18 18 15 19 0 0 0 3351 VEH/DIA
VIERNES 1191 276 1695 23 17 20 29 19 19 15 19 16 14 15 16 17 0 0 0 3401 VEH/DIA
SÁBADO 1319 167 1244 15 43 24 355 82 58 27 28 21 22 15 46 5 4 4 3 3482 VEH/DIA
DOMINGO 1212 156 1053 42 16 16 29 18 18 17 13 12 20 15 15 15 0 0 0 2667 VEH/DIA
LUNES 1195 176 1079 40 16 17 26 13 14 17 11 19 13 15 14 15 0 0 0 2680 VEH/DIA
MARTES 1221 173 1127 14 14 15 28 14 16 17 14 12 17 11 17 18 0 0 0 2728 VEH/DIA
MIÉRCOLES 1307 190 1265 14 16 14 28 16 16 18 18 19 18 16 21 21 0 0 0 2997 VEH/DIA
VEHICULOS LIGEROS BUS CAMIONES UNITARIOS CAMIONES ACOPLADOS
DIA
Vi
Enero Febrero Marzo Abril Mayo Junio Julio Agosto Setiembre Octubre Noviembre Diciembre
Pesados Pesados Pesados Pesados Pesados Pesados Pesados Pesados Pesados Pesados Pesados Pesados
FCEP CARRETERA CENTRAL PESADOS 1.052056 1.083990 1.113858 1.217953 1.132323 0.854640 0.786445 0.916331 1.153447 1.125440 0.964453 0.856343
FCEP CARRETERA CENTRAL LIJEROS 1.034344 1.045466 1.145678 1.134795 1.140000 0.754640 0.675759 0.905677 1.124556 1.134500 0.923456 0.887654
Enero Febrero Marzo Abril Mayo Junio Julio Agosto Setiembre Octubre Noviembre Diciembre
0.95051946 0.92251764 0.89778015 0.82104962 0.88314 1.17008331 1.27154474 1.09130917 0.86696658 0.88854137 1.03685716 1.16775638
0.966797 0.956512 0.872846 0.881216 0.877193 1.325135 1.479818 1.104147 0.889240 0.881446 1.082889 1.126565
Factores de corrección promedio para vehículos (2010-2014)
Código Peaje
0.4
0.9
1.4
1.9
2.4
2.9
Ene ro Fe bre ro Marzo A bri l Mayo Juni o Jul i o A gosto Se ti e mbre Octubre N ovi e mbre Di ci e mbre
FACTOR DE ESTACIONALIDAD
IMDS 1226 206 1304 26 20 17 74 25 22 18 17 17 17 15 21 16 1 1 0 3044 VEH/DIA
Fe 1.125 1.125 1.125 1.125 1.153 1.153 1.153 1.153 1.153 1.153 1.153 1.153 1.153 1.153 1.153 1.153 1.153 1.153 1.153
IMDA 1379 232 1466 29 23 20 86 29 26 21 20 19 20 17 24 18 1 1 0 3431 VEH/DIA
VEHICULO IMDA EJE (TN) f IMDA.f Dd DL r N fc
VL 3667 1 0.0005 1.93 0.5 1 2.8 20 26.33 9286.56
3667 1 0.0005 1.93 0.5 1 2.8 20 26.33 9,286.56
B2 27 7 1.265 34.16 0.5 1 3.2 20 27.42 170,989.78
27 10 2.212 59.72 0.5 1 3.2 20 27.42 298,881.01
B3 24 7 1.265 30.37 0.5 1 3.2 20 27.42 151,990.91
24 16 1.261 30.25 0.5 1 3.2 20 27.42 151,416.55
C2 101 7 1.265 127.80 0.5 1 2.7 20 26.07 607,942.60
101 10 2.212 223.39 0.5 1 2.7 20 26.07 1,062,651.22
C3 34 7 1.265 43.02 0.5 1 2.7 20 26.07 204,653.94
34 16 1.261 42.86 0.5 1 2.7 20 26.07 203,880.57
C4 30 7 1.265 37.96 0.5 1 2.7 20 26.07 180,577.01
30 21 1.058 31.73 0.5 1 2.7 20 26.07 150,944.38
T2S2 25 7 1.265 31.63 0.5 1 2.7 20 26.07 150,480.84
25 10 2.212 55.29 0.5 1 2.7 20 26.07 263,032.48
25 16 1.261 31.51 0.5 1 2.7 20 26.07 149,912.18
T2S3 23 7 1.265 29.10 0.5 1 2.7 20 26.07 138,442.37
23 10 2.212 50.87 0.5 1 2.7 20 26.07 241,989.88
23 23 1.232 28.35 0.5 1 2.7 20 26.07 134,837.55
T3S2 22 7 1.265 27.84 0.5 1 2.7 20 26.07 132,423.14
22 16 1.261 27.73 0.5 1 2.7 20 26.07 131,922.72
22 16 1.261 27.73 0.5 1 2.7 20 26.07 131,922.72
T3S3 24 7 1.265 30.37 0.5 1 2.7 20 26.07 144,461.61
24 16 1.261 30.25 0.5 1 2.7 20 26.07 143,915.70
24 23 1.232 29.58 0.5 1 2.7 20 26.07 140,700.05
C2R2 20 7 1.265 25.31 0.5 1 2.7 20 26.07 120,384.67
20 10 2.212 44.24 0.5 1 2.7 20 26.07 210,425.99
20 10 2.212 44.24 0.5 1 2.7 20 26.07 210,425.99
20 10 2.212 44.24 0.5 1 2.7 20 26.07 210,425.99
C2R3 28 7 1.265 35.43 0.5 1 2.7 20 26.07 168,538.54
28 10 2.212 61.93 0.5 1 2.7 20 26.07 294,596.38
28 10 2.212 61.93 0.5 1 2.7 20 26.07 294,596.38
28 16 1.261 35.30 0.5 1 2.7 20 26.07 167,901.65
C3R2 21 7 1.265 26.57 0.5 1 2.7 20 26.07 126,403.91
21 16 1.261 26.47 0.5 1 2.7 20 26.07 125,926.24
21 10 2.212 46.45 0.5 1 2.7 20 26.07 220,947.28
21 10 2.212 46.45 0.5 1 2.7 20 26.07 220,947.28
C3R3 1 7 1.265 1.27 0.5 1 2.7 20 26.07 6,019.23
1 16 1.261 1.26 0.5 1 2.7 20 26.07 5,996.49
1 10 2.212 2.21 0.5 1 2.7 20 26.07 10,521.30
1 16 1.261 1.26 0.5 1 2.7 20 26.07 5,996.49
C4R2 1 7 1.265 1.27 0.5 1 2.7 20 26.07 6,019.23
1 23 1.232 1.23 0.50 1.00 2.70 20.00 26.07 5862.50
1 10 2.212 2.21 0.50 1.00 2.70 20.00 26.07 10521.30
1 10 2.212 2.21 0.50 1.00 2.70 20.00 26.07 10521.30
ESALo= 1576.87 ESAL= 7,539,520.48
ESAL

More Related Content

What's hot

Opportunity Cost to Your Operation
Opportunity Cost to Your OperationOpportunity Cost to Your Operation
Opportunity Cost to Your OperationNational Pork Board
 
Quantify 2016 - Progressive
Quantify 2016 - ProgressiveQuantify 2016 - Progressive
Quantify 2016 - ProgressiveYe Na Lee
 
Tx admit -psap_by_county_fy12_414978_7
Tx admit -psap_by_county_fy12_414978_7Tx admit -psap_by_county_fy12_414978_7
Tx admit -psap_by_county_fy12_414978_7satoriwatersfl
 
77389 Home Sales Report June 2015
77389 Home Sales Report June 201577389 Home Sales Report June 2015
77389 Home Sales Report June 2015Ken Brand
 
September 2015 Real Estate Market Report, The Woodlands, TX
September 2015 Real Estate Market Report, The Woodlands, TXSeptember 2015 Real Estate Market Report, The Woodlands, TX
September 2015 Real Estate Market Report, The Woodlands, TXReferred Realty Group
 
July 2017 Real Estate Update, A Market Report for The Woodland, TX
July 2017 Real Estate Update, A Market Report for The Woodland, TXJuly 2017 Real Estate Update, A Market Report for The Woodland, TX
July 2017 Real Estate Update, A Market Report for The Woodland, TXReferred Realty Group
 
October 2015 Real Estate Market Report, The Woodlands, TX
October 2015 Real Estate Market Report, The Woodlands, TXOctober 2015 Real Estate Market Report, The Woodlands, TX
October 2015 Real Estate Market Report, The Woodlands, TXReferred Realty Group
 
Contoh laporan harian
Contoh laporan harianContoh laporan harian
Contoh laporan harianenhandroid
 
July 2015 Real Estate Market Report, The Woodlands, TX
July 2015 Real Estate Market Report, The Woodlands, TXJuly 2015 Real Estate Market Report, The Woodlands, TX
July 2015 Real Estate Market Report, The Woodlands, TXmsullymarkel
 
Home Sales Report 77389 - May 2015
Home Sales Report 77389 - May 2015Home Sales Report 77389 - May 2015
Home Sales Report 77389 - May 2015Ken Brand
 
Calculating Beta
Calculating BetaCalculating Beta
Calculating Betaukabuka
 
WCB thin section slewing ring bearing
WCB thin section slewing ring bearingWCB thin section slewing ring bearing
WCB thin section slewing ring bearingWen Chen
 
Gpz bearing catalogue
Gpz bearing catalogueGpz bearing catalogue
Gpz bearing catalogueBearings Gpz
 

What's hot (18)

Opportunity Cost to Your Operation
Opportunity Cost to Your OperationOpportunity Cost to Your Operation
Opportunity Cost to Your Operation
 
Quantify 2016 - Progressive
Quantify 2016 - ProgressiveQuantify 2016 - Progressive
Quantify 2016 - Progressive
 
Tablasy
TablasyTablasy
Tablasy
 
SLCPD CompStat no.52 (week ending 12-31-17)
SLCPD CompStat no.52 (week ending 12-31-17)SLCPD CompStat no.52 (week ending 12-31-17)
SLCPD CompStat no.52 (week ending 12-31-17)
 
Tx admit -psap_by_county_fy12_414978_7
Tx admit -psap_by_county_fy12_414978_7Tx admit -psap_by_county_fy12_414978_7
Tx admit -psap_by_county_fy12_414978_7
 
77389 Home Sales Report June 2015
77389 Home Sales Report June 201577389 Home Sales Report June 2015
77389 Home Sales Report June 2015
 
September 2015 Real Estate Market Report, The Woodlands, TX
September 2015 Real Estate Market Report, The Woodlands, TXSeptember 2015 Real Estate Market Report, The Woodlands, TX
September 2015 Real Estate Market Report, The Woodlands, TX
 
July 2017 Real Estate Update, A Market Report for The Woodland, TX
July 2017 Real Estate Update, A Market Report for The Woodland, TXJuly 2017 Real Estate Update, A Market Report for The Woodland, TX
July 2017 Real Estate Update, A Market Report for The Woodland, TX
 
October 2015 Real Estate Market Report, The Woodlands, TX
October 2015 Real Estate Market Report, The Woodlands, TXOctober 2015 Real Estate Market Report, The Woodlands, TX
October 2015 Real Estate Market Report, The Woodlands, TX
 
Contoh laporan harian
Contoh laporan harianContoh laporan harian
Contoh laporan harian
 
Calameo
CalameoCalameo
Calameo
 
SLC Police Compstat Data for Week 2/19/18 - 2/25/18
SLC Police Compstat Data for Week 2/19/18 - 2/25/18SLC Police Compstat Data for Week 2/19/18 - 2/25/18
SLC Police Compstat Data for Week 2/19/18 - 2/25/18
 
July 2015 Real Estate Market Report, The Woodlands, TX
July 2015 Real Estate Market Report, The Woodlands, TXJuly 2015 Real Estate Market Report, The Woodlands, TX
July 2015 Real Estate Market Report, The Woodlands, TX
 
Home Sales Report 77389 - May 2015
Home Sales Report 77389 - May 2015Home Sales Report 77389 - May 2015
Home Sales Report 77389 - May 2015
 
Calculating Beta
Calculating BetaCalculating Beta
Calculating Beta
 
WCB thin section slewing ring bearing
WCB thin section slewing ring bearingWCB thin section slewing ring bearing
WCB thin section slewing ring bearing
 
Example bowles pp 234 239to240 2docs
Example bowles pp 234 239to240 2docsExample bowles pp 234 239to240 2docs
Example bowles pp 234 239to240 2docs
 
Gpz bearing catalogue
Gpz bearing catalogueGpz bearing catalogue
Gpz bearing catalogue
 

Similar to Calculo de esal

Jj srb7100 c_val
Jj srb7100 c_valJj srb7100 c_val
Jj srb7100 c_valRachel Byrd
 
Monthly ppt QA September' 2023 - 09102023.pptx
Monthly ppt QA September' 2023  - 09102023.pptxMonthly ppt QA September' 2023  - 09102023.pptx
Monthly ppt QA September' 2023 - 09102023.pptxsumankumar249442
 
Tabela de conversao z-dpmo
Tabela de conversao   z-dpmoTabela de conversao   z-dpmo
Tabela de conversao z-dpmoHugo Oliveira
 
Transformation 101 - Business Model Workshop
Transformation 101 - Business Model WorkshopTransformation 101 - Business Model Workshop
Transformation 101 - Business Model WorkshopDaniel Li
 
富邦投顧研究部核心持股2011年殖利率 02.17.2012
富邦投顧研究部核心持股2011年殖利率 02.17.2012富邦投顧研究部核心持股2011年殖利率 02.17.2012
富邦投顧研究部核心持股2011年殖利率 02.17.2012yo9889
 
Résultats élections régionales 20151206
Résultats élections régionales 20151206Résultats élections régionales 20151206
Résultats élections régionales 20151206Grégory MACÉ
 
Workplace Wellness - State of Wellness 2012 US National Survey Results - Raw ...
Workplace Wellness - State of Wellness 2012 US National Survey Results - Raw ...Workplace Wellness - State of Wellness 2012 US National Survey Results - Raw ...
Workplace Wellness - State of Wellness 2012 US National Survey Results - Raw ...healthiermn
 
Valuation of Indian hospitality industry
Valuation of Indian hospitality industryValuation of Indian hospitality industry
Valuation of Indian hospitality industryShivani Chaluvadi
 
Tablero Gerencial de Mando - Business Intelligence
Tablero Gerencial de Mando - Business IntelligenceTablero Gerencial de Mando - Business Intelligence
Tablero Gerencial de Mando - Business IntelligenceLuis Damian
 
MOC 6 PP OPS SCHEME DECK.pptx
MOC 6 PP OPS SCHEME DECK.pptxMOC 6 PP OPS SCHEME DECK.pptx
MOC 6 PP OPS SCHEME DECK.pptxMadhusudhanPV
 
Valuation Of ASHOK LEYLAND
Valuation Of ASHOK LEYLANDValuation Of ASHOK LEYLAND
Valuation Of ASHOK LEYLANDAakash Singh
 
STAR Report FY13-14
STAR Report FY13-14STAR Report FY13-14
STAR Report FY13-14Joe Liu
 
150  miles  48  5.8  096  27   0  .docx
150  miles  48  5.8  096  27   0  .docx150  miles  48  5.8  096  27   0  .docx
150  miles  48  5.8  096  27   0  .docxfelicidaddinwoodie
 

Similar to Calculo de esal (20)

Jj srb7100 c_val
Jj srb7100 c_valJj srb7100 c_val
Jj srb7100 c_val
 
Staff Demand and Shift Bidding
Staff Demand and Shift BiddingStaff Demand and Shift Bidding
Staff Demand and Shift Bidding
 
Correlation and volatility DJ EuroStoxx50 Oct 2014
Correlation and volatility DJ EuroStoxx50 Oct 2014Correlation and volatility DJ EuroStoxx50 Oct 2014
Correlation and volatility DJ EuroStoxx50 Oct 2014
 
Monthly Review April-2023.pptx
Monthly Review April-2023.pptxMonthly Review April-2023.pptx
Monthly Review April-2023.pptx
 
Monthly ppt QA September' 2023 - 09102023.pptx
Monthly ppt QA September' 2023  - 09102023.pptxMonthly ppt QA September' 2023  - 09102023.pptx
Monthly ppt QA September' 2023 - 09102023.pptx
 
Presentation Correlation and Volatility Eurex
Presentation Correlation and Volatility EurexPresentation Correlation and Volatility Eurex
Presentation Correlation and Volatility Eurex
 
Tabela de conversao z-dpmo
Tabela de conversao   z-dpmoTabela de conversao   z-dpmo
Tabela de conversao z-dpmo
 
Transformation 101 - Business Model Workshop
Transformation 101 - Business Model WorkshopTransformation 101 - Business Model Workshop
Transformation 101 - Business Model Workshop
 
富邦投顧研究部核心持股2011年殖利率 02.17.2012
富邦投顧研究部核心持股2011年殖利率 02.17.2012富邦投顧研究部核心持股2011年殖利率 02.17.2012
富邦投顧研究部核心持股2011年殖利率 02.17.2012
 
Résultats élections régionales 20151206
Résultats élections régionales 20151206Résultats élections régionales 20151206
Résultats élections régionales 20151206
 
Workplace Wellness - State of Wellness 2012 US National Survey Results - Raw ...
Workplace Wellness - State of Wellness 2012 US National Survey Results - Raw ...Workplace Wellness - State of Wellness 2012 US National Survey Results - Raw ...
Workplace Wellness - State of Wellness 2012 US National Survey Results - Raw ...
 
Vendas por Marca
Vendas por MarcaVendas por Marca
Vendas por Marca
 
Valuation of Indian hospitality industry
Valuation of Indian hospitality industryValuation of Indian hospitality industry
Valuation of Indian hospitality industry
 
Tablero Gerencial de Mando - Business Intelligence
Tablero Gerencial de Mando - Business IntelligenceTablero Gerencial de Mando - Business Intelligence
Tablero Gerencial de Mando - Business Intelligence
 
Matematicas Financieras: Tablas de tasas factores financieros (2020)
Matematicas Financieras: Tablas de tasas factores financieros (2020)Matematicas Financieras: Tablas de tasas factores financieros (2020)
Matematicas Financieras: Tablas de tasas factores financieros (2020)
 
MOC 6 PP OPS SCHEME DECK.pptx
MOC 6 PP OPS SCHEME DECK.pptxMOC 6 PP OPS SCHEME DECK.pptx
MOC 6 PP OPS SCHEME DECK.pptx
 
Valuation Of ASHOK LEYLAND
Valuation Of ASHOK LEYLANDValuation Of ASHOK LEYLAND
Valuation Of ASHOK LEYLAND
 
STAR Report FY13-14
STAR Report FY13-14STAR Report FY13-14
STAR Report FY13-14
 
Resultados de primer parcial
Resultados de primer parcialResultados de primer parcial
Resultados de primer parcial
 
150  miles  48  5.8  096  27   0  .docx
150  miles  48  5.8  096  27   0  .docx150  miles  48  5.8  096  27   0  .docx
150  miles  48  5.8  096  27   0  .docx
 

Recently uploaded

S1S2 B.Arch MGU - HOA1&2 Module 3 -Temple Architecture of Kerala.pptx
S1S2 B.Arch MGU - HOA1&2 Module 3 -Temple Architecture of Kerala.pptxS1S2 B.Arch MGU - HOA1&2 Module 3 -Temple Architecture of Kerala.pptx
S1S2 B.Arch MGU - HOA1&2 Module 3 -Temple Architecture of Kerala.pptxSCMS School of Architecture
 
Memory Interfacing of 8086 with DMA 8257
Memory Interfacing of 8086 with DMA 8257Memory Interfacing of 8086 with DMA 8257
Memory Interfacing of 8086 with DMA 8257subhasishdas79
 
AIRCANVAS[1].pdf mini project for btech students
AIRCANVAS[1].pdf mini project for btech studentsAIRCANVAS[1].pdf mini project for btech students
AIRCANVAS[1].pdf mini project for btech studentsvanyagupta248
 
scipt v1.pptxcxxxxxxxxxxxxxxxxxxxxxxxxxxxxxxxxxxxxxxxxxxxxxxxxxxxxxxxxxxxxxxx...
scipt v1.pptxcxxxxxxxxxxxxxxxxxxxxxxxxxxxxxxxxxxxxxxxxxxxxxxxxxxxxxxxxxxxxxxx...scipt v1.pptxcxxxxxxxxxxxxxxxxxxxxxxxxxxxxxxxxxxxxxxxxxxxxxxxxxxxxxxxxxxxxxxx...
scipt v1.pptxcxxxxxxxxxxxxxxxxxxxxxxxxxxxxxxxxxxxxxxxxxxxxxxxxxxxxxxxxxxxxxxx...HenryBriggs2
 
"Lesotho Leaps Forward: A Chronicle of Transformative Developments"
"Lesotho Leaps Forward: A Chronicle of Transformative Developments""Lesotho Leaps Forward: A Chronicle of Transformative Developments"
"Lesotho Leaps Forward: A Chronicle of Transformative Developments"mphochane1998
 
Max. shear stress theory-Maximum Shear Stress Theory ​ Maximum Distortional ...
Max. shear stress theory-Maximum Shear Stress Theory ​  Maximum Distortional ...Max. shear stress theory-Maximum Shear Stress Theory ​  Maximum Distortional ...
Max. shear stress theory-Maximum Shear Stress Theory ​ Maximum Distortional ...ronahami
 
Unit 4_Part 1 CSE2001 Exception Handling and Function Template and Class Temp...
Unit 4_Part 1 CSE2001 Exception Handling and Function Template and Class Temp...Unit 4_Part 1 CSE2001 Exception Handling and Function Template and Class Temp...
Unit 4_Part 1 CSE2001 Exception Handling and Function Template and Class Temp...drmkjayanthikannan
 
HOA1&2 - Module 3 - PREHISTORCI ARCHITECTURE OF KERALA.pptx
HOA1&2 - Module 3 - PREHISTORCI ARCHITECTURE OF KERALA.pptxHOA1&2 - Module 3 - PREHISTORCI ARCHITECTURE OF KERALA.pptx
HOA1&2 - Module 3 - PREHISTORCI ARCHITECTURE OF KERALA.pptxSCMS School of Architecture
 
Introduction to Robotics in Mechanical Engineering.pptx
Introduction to Robotics in Mechanical Engineering.pptxIntroduction to Robotics in Mechanical Engineering.pptx
Introduction to Robotics in Mechanical Engineering.pptxhublikarsn
 
Hospital management system project report.pdf
Hospital management system project report.pdfHospital management system project report.pdf
Hospital management system project report.pdfKamal Acharya
 
Introduction to Data Visualization,Matplotlib.pdf
Introduction to Data Visualization,Matplotlib.pdfIntroduction to Data Visualization,Matplotlib.pdf
Introduction to Data Visualization,Matplotlib.pdfsumitt6_25730773
 
Employee leave management system project.
Employee leave management system project.Employee leave management system project.
Employee leave management system project.Kamal Acharya
 
NO1 Top No1 Amil Baba In Azad Kashmir, Kashmir Black Magic Specialist Expert ...
NO1 Top No1 Amil Baba In Azad Kashmir, Kashmir Black Magic Specialist Expert ...NO1 Top No1 Amil Baba In Azad Kashmir, Kashmir Black Magic Specialist Expert ...
NO1 Top No1 Amil Baba In Azad Kashmir, Kashmir Black Magic Specialist Expert ...Amil baba
 
XXXXXXXXXXXXXXXXXXXXXXXXXXXXXXXXXXXXXXXXXXXXXXXXXXXX
XXXXXXXXXXXXXXXXXXXXXXXXXXXXXXXXXXXXXXXXXXXXXXXXXXXXXXXXXXXXXXXXXXXXXXXXXXXXXXXXXXXXXXXXXXXXXXXXXXXXXXXX
XXXXXXXXXXXXXXXXXXXXXXXXXXXXXXXXXXXXXXXXXXXXXXXXXXXXssuser89054b
 
Convergence of Robotics and Gen AI offers excellent opportunities for Entrepr...
Convergence of Robotics and Gen AI offers excellent opportunities for Entrepr...Convergence of Robotics and Gen AI offers excellent opportunities for Entrepr...
Convergence of Robotics and Gen AI offers excellent opportunities for Entrepr...ssuserdfc773
 
Theory of Time 2024 (Universal Theory for Everything)
Theory of Time 2024 (Universal Theory for Everything)Theory of Time 2024 (Universal Theory for Everything)
Theory of Time 2024 (Universal Theory for Everything)Ramkumar k
 
fitting shop and tools used in fitting shop .ppt
fitting shop and tools used in fitting shop .pptfitting shop and tools used in fitting shop .ppt
fitting shop and tools used in fitting shop .pptAfnanAhmad53
 
1_Introduction + EAM Vocabulary + how to navigate in EAM.pdf
1_Introduction + EAM Vocabulary + how to navigate in EAM.pdf1_Introduction + EAM Vocabulary + how to navigate in EAM.pdf
1_Introduction + EAM Vocabulary + how to navigate in EAM.pdfAldoGarca30
 

Recently uploaded (20)

Signal Processing and Linear System Analysis
Signal Processing and Linear System AnalysisSignal Processing and Linear System Analysis
Signal Processing and Linear System Analysis
 
S1S2 B.Arch MGU - HOA1&2 Module 3 -Temple Architecture of Kerala.pptx
S1S2 B.Arch MGU - HOA1&2 Module 3 -Temple Architecture of Kerala.pptxS1S2 B.Arch MGU - HOA1&2 Module 3 -Temple Architecture of Kerala.pptx
S1S2 B.Arch MGU - HOA1&2 Module 3 -Temple Architecture of Kerala.pptx
 
Memory Interfacing of 8086 with DMA 8257
Memory Interfacing of 8086 with DMA 8257Memory Interfacing of 8086 with DMA 8257
Memory Interfacing of 8086 with DMA 8257
 
AIRCANVAS[1].pdf mini project for btech students
AIRCANVAS[1].pdf mini project for btech studentsAIRCANVAS[1].pdf mini project for btech students
AIRCANVAS[1].pdf mini project for btech students
 
scipt v1.pptxcxxxxxxxxxxxxxxxxxxxxxxxxxxxxxxxxxxxxxxxxxxxxxxxxxxxxxxxxxxxxxxx...
scipt v1.pptxcxxxxxxxxxxxxxxxxxxxxxxxxxxxxxxxxxxxxxxxxxxxxxxxxxxxxxxxxxxxxxxx...scipt v1.pptxcxxxxxxxxxxxxxxxxxxxxxxxxxxxxxxxxxxxxxxxxxxxxxxxxxxxxxxxxxxxxxxx...
scipt v1.pptxcxxxxxxxxxxxxxxxxxxxxxxxxxxxxxxxxxxxxxxxxxxxxxxxxxxxxxxxxxxxxxxx...
 
"Lesotho Leaps Forward: A Chronicle of Transformative Developments"
"Lesotho Leaps Forward: A Chronicle of Transformative Developments""Lesotho Leaps Forward: A Chronicle of Transformative Developments"
"Lesotho Leaps Forward: A Chronicle of Transformative Developments"
 
Max. shear stress theory-Maximum Shear Stress Theory ​ Maximum Distortional ...
Max. shear stress theory-Maximum Shear Stress Theory ​  Maximum Distortional ...Max. shear stress theory-Maximum Shear Stress Theory ​  Maximum Distortional ...
Max. shear stress theory-Maximum Shear Stress Theory ​ Maximum Distortional ...
 
Unit 4_Part 1 CSE2001 Exception Handling and Function Template and Class Temp...
Unit 4_Part 1 CSE2001 Exception Handling and Function Template and Class Temp...Unit 4_Part 1 CSE2001 Exception Handling and Function Template and Class Temp...
Unit 4_Part 1 CSE2001 Exception Handling and Function Template and Class Temp...
 
HOA1&2 - Module 3 - PREHISTORCI ARCHITECTURE OF KERALA.pptx
HOA1&2 - Module 3 - PREHISTORCI ARCHITECTURE OF KERALA.pptxHOA1&2 - Module 3 - PREHISTORCI ARCHITECTURE OF KERALA.pptx
HOA1&2 - Module 3 - PREHISTORCI ARCHITECTURE OF KERALA.pptx
 
Introduction to Robotics in Mechanical Engineering.pptx
Introduction to Robotics in Mechanical Engineering.pptxIntroduction to Robotics in Mechanical Engineering.pptx
Introduction to Robotics in Mechanical Engineering.pptx
 
Hospital management system project report.pdf
Hospital management system project report.pdfHospital management system project report.pdf
Hospital management system project report.pdf
 
Introduction to Data Visualization,Matplotlib.pdf
Introduction to Data Visualization,Matplotlib.pdfIntroduction to Data Visualization,Matplotlib.pdf
Introduction to Data Visualization,Matplotlib.pdf
 
Employee leave management system project.
Employee leave management system project.Employee leave management system project.
Employee leave management system project.
 
NO1 Top No1 Amil Baba In Azad Kashmir, Kashmir Black Magic Specialist Expert ...
NO1 Top No1 Amil Baba In Azad Kashmir, Kashmir Black Magic Specialist Expert ...NO1 Top No1 Amil Baba In Azad Kashmir, Kashmir Black Magic Specialist Expert ...
NO1 Top No1 Amil Baba In Azad Kashmir, Kashmir Black Magic Specialist Expert ...
 
XXXXXXXXXXXXXXXXXXXXXXXXXXXXXXXXXXXXXXXXXXXXXXXXXXXX
XXXXXXXXXXXXXXXXXXXXXXXXXXXXXXXXXXXXXXXXXXXXXXXXXXXXXXXXXXXXXXXXXXXXXXXXXXXXXXXXXXXXXXXXXXXXXXXXXXXXXXXX
XXXXXXXXXXXXXXXXXXXXXXXXXXXXXXXXXXXXXXXXXXXXXXXXXXXX
 
Convergence of Robotics and Gen AI offers excellent opportunities for Entrepr...
Convergence of Robotics and Gen AI offers excellent opportunities for Entrepr...Convergence of Robotics and Gen AI offers excellent opportunities for Entrepr...
Convergence of Robotics and Gen AI offers excellent opportunities for Entrepr...
 
Theory of Time 2024 (Universal Theory for Everything)
Theory of Time 2024 (Universal Theory for Everything)Theory of Time 2024 (Universal Theory for Everything)
Theory of Time 2024 (Universal Theory for Everything)
 
fitting shop and tools used in fitting shop .ppt
fitting shop and tools used in fitting shop .pptfitting shop and tools used in fitting shop .ppt
fitting shop and tools used in fitting shop .ppt
 
1_Introduction + EAM Vocabulary + how to navigate in EAM.pdf
1_Introduction + EAM Vocabulary + how to navigate in EAM.pdf1_Introduction + EAM Vocabulary + how to navigate in EAM.pdf
1_Introduction + EAM Vocabulary + how to navigate in EAM.pdf
 
Cara Menggugurkan Sperma Yang Masuk Rahim Biyar Tidak Hamil
Cara Menggugurkan Sperma Yang Masuk Rahim Biyar Tidak HamilCara Menggugurkan Sperma Yang Masuk Rahim Biyar Tidak Hamil
Cara Menggugurkan Sperma Yang Masuk Rahim Biyar Tidak Hamil
 

Calculo de esal

  • 1.
  • 2. CARRETERA: UBICACIÓN: TRAMO: SENTIDO: ESTACION: FECHA: HORA Autos Pick up C.R. Micros B2 B3 C2 C3 C4 T2S2 T2S3 T3S2 T3S3 C2R2 C2R3 C3R2 C3R3 C4R2 E7 TOTAL % 0-1 10 4 - - - - 2 - 1 1 1 - 1 1 1 - - - 22 0.66% 1-2 24 4 - - 1 1 - - 1 1 1 1 1 1 - 1 - - 37 1.10% 2-3 35 6 - - - 1 2 1 1 - 1 1 1 1 1 1 - - 52 1.55% 3-4 30 9 5 1 - 1 1 - 1 - - 1 - - 1 1 - - 51 1.52% 4-5 28 4 9 2 1 - 2 - 1 1 - - - 1 1 1 - - 51 1.52% 5-6 36 13 16 2 1 1 2 1 1 - 1 1 1 1 1 1 - - 79 2.36% 6-7 51 11 57 2 - - 1 - 1 1 1 1 1 1 1 1 - - 130 3.88% 7-8 56 19 106 1 1 1 1 1 - 1 1 1 1 1 - - - - 191 5.70% 8-9 51 18 109 2 1 1 1 - 1 1 1 1 1 1 1 1 - - 191 5.70% 9-10 49 24 104 3 1 - - - 1 1 - 1 1 - 1 - - - 186 5.55% 10-11 57 21 83 3 - - 1 1 1 1 1 - 1 1 - 1 - - 172 5.13% 11-12 76 27 116 1 1 1 2 1 - 1 - 1 1 1 1 - - - 230 6.86% 12-13 65 23 123 1 - 1 1 1 - 1 1 1 1 - 1 1 - - 221 6.60% 13-14 76 5 129 1 - 1 - 1 1 1 - - - - - 1 - - 216 6.45% 14-15 66 7 121 1 1 1 1 - - 1 - 1 1 1 - 1 - - 203 6.06% 15-16 52 17 134 3 - 1 2 1 1 1 1 1 - - 1 1 - - 216 6.45% 16-17 51 13 110 3 1 1 - 1 - 1 1 1 - 1 1 1 - - 186 5.55% 17-18 70 15 110 1 1 1 - 1 1 1 1 - 1 1 - 1 - - 205 6.12% 18-19 42 16 93 1 - - 2 1 1 1 1 - 1 1 1 1 - - 162 4.83% 19-20 61 17 80 2 1 1 2 1 1 1 1 1 1 - - - - - 170 5.07% 20-21 54 12 75 2 1 - 1 1 - - 1 - 1 1 1 1 - - 151 4.51% 21-22 41 8 52 1 1 - - 1 - 1 1 1 1 1 1 1 - - 111 3.31% 22-23 26 7 24 1 1 1 - 1 - - 1 1 1 1 - 1 - - 66 1.97% 23-24 29 7 9 - 1 - 1 - 1 - 1 1 - 1 - 1 - - 52 1.55% TOTAL 1,136 307 1,665 34 15 15 25 15 16 18 18 17 18 18 15 19 - - - 3,351 100.00% % 33.90% 9.16% 49.69% 1.01% 0.45% 0.45% 0.75% 0.45% 0.48% 0.54% 0.54% 0.51% #### 0.54% 0.45% 0.57% 0.00% 0.00% 0.00% 100.00% CONTEO Y CLASIFICACION DEL TRAFICO VEHICULOS LIGEROS BUS CAMIONES UNITARIOS CAMIONES ACOPLADOS CARRETERA: UBICACIÓN: TRAMO: SENTIDO: ESTACION: FECHA: HORA Autos Pick up C.R. Micros B2 B3 C2 C3 C4 T2S2 T2S3 T3S2 T3S3 C2R2 C2R3 C3R2 C3R3 C4R2 E7 TOTAL % 0-1 15 4 1 - - 1 2 1 1 1 1 1 - - - 1 - - 29 0.85% 1-2 30 4 - - 1 1 2 1 1 - 1 1 1 - - 1 - - 44 1.29% 2-3 36 7 1 - 1 1 2 1 1 - 1 1 - - - - - - 52 1.53% 3-4 31 7 - - - 1 2 1 1 - 1 1 1 1 1 1 - - 49 1.44% 4-5 32 1 9 - - 1 2 1 - 1 1 1 - - 1 1 - - 51 1.50% 5-6 40 9 42 - 1 1 1 1 1 - 1 1 1 1 1 1 - - 102 3.00% 6-7 56 13 68 - 1 1 1 1 - - 1 1 - 1 - 1 - - 145 4.26% 7-8 57 18 101 2 1 1 2 1 1 1 1 1 1 - 1 1 - - 190 5.59% 8-9 54 16 106 - 1 1 1 1 1 1 - - - - - 1 - - 183 5.38% 9-10 53 24 103 - 1 1 1 - 1 1 1 - 1 1 1 1 - - 190 5.59% 10-11 60 19 83 3 1 1 1 1 - - 1 1 - 1 1 1 - - 174 5.12% 11-12 82 25 125 2 - - 1 1 1 1 1 1 1 - 1 - - - 242 7.12% 12-13 71 19 123 1 1 1 1 1 1 1 - - 1 - 1 1 - - 223 6.56% 13-14 70 9 122 2 - - - 1 1 - - 1 - 1 1 - - - 208 6.12% 14-15 67 11 135 3 1 1 1 - 1 1 1 1 1 - - - - - 224 6.59% 15-16 62 12 130 1 1 1 1 1 1 1 1 - 1 1 1 - - - 215 6.32% 16-17 56 9 114 4 1 1 1 1 1 1 1 1 1 1 1 - - - 194 5.70% 17-18 65 11 113 1 - - 1 1 1 1 1 1 1 1 1 1 - - 200 5.88% 18-19 54 16 94 2 1 1 1 1 - 1 - - 1 1 - - - - 173 5.09% 19-20 60 13 80 - 1 1 1 - 1 1 1 - 1 1 - 1 - - 162 4.76% 20-21 57 9 72 1 - - 1 - - - 1 - - 1 1 1 - - 144 4.23% 21-22 39 8 48 - 1 1 - 1 1 1 - 1 - 1 1 1 - - 104 3.06% 22-23 22 5 19 1 1 1 1 - 1 - 1 1 - 1 1 1 - - 56 1.65% 23-24 22 7 6 - 1 1 2 1 1 1 1 - 1 1 1 1 - - 47 1.38% TOTAL 1,191 276 1,695 23 17 20 29 19 19 15 19 16 14 15 16 17 - - - 3,401 100.00% % 35.02% 8.12% 49.84% 0.68% 0.50% 0.59% 0.85% 0.56% 0.56% 0.44% 0.56% 0.47% 0.41% 0.44% 0.47% 0.50% 0.00% 0.00% 0.00% 100.00% CONTEO Y CLASIFICACION DEL TRAFICO VEHICULOS LIGEROS BUS CAMIONES ###################### SEMI TRAILER TRAILER
  • 3. CARRETERA:CARRETERA: UBICACIÓN: TRAMO:TRAMO: SENTIDO: ESTACION:ESTACION: FECHA: HORA Autos Autos Pick up C.R. Micros B2 B3 C2 C3 C4 T2S2 T2S3 T3S2 T3S3 C2R2 C2R3 C3R2 C3R3 C4R2 TOTAL % 0-1 40 7 3 - - 1 - - 1 - 1 1 1 - - 1 - - 56 1.61% 1-2 34 9 2 1 - - 2 - 1 - - 1 - - - - - - • 50 1.44% 2-3 41 6 1 - 1 1 2 3 1 1 - - - 3 - 1 - - 61 1.75% 3-4 58 7 2 - - 1 5 2 - 1 - - - - - - - - 76 2.18% 4-5 40 6 6 - 4 - 7 2 2 1 2 - - - 1 - - - 71 2.04% 5-6 46 9 15 1 2 - 3 2 1 - 1 - - - 1 - - - 81 2.33% 6-7 57 9 57 1 1 - 26 3 1 1 - - 1 1 2 - - - 160 4.60% 7-8 67 6 82 2 2 1 14 5 2 2 1 - 1 - 3 - - - 188 5.40% 8-9 67 5 85 1 3 1 18 4 2 1 1 2 1 1 2 - - - 194 5.57% 9-10 70 9 90 - 3 1 18 6 2 3 - 1 1 - 1 - - - 205 5.89% 10-11 59 11 87 - 2 1 16 4 2 1 1 2 1 - 2 - - - 189 5.43% 11-12 60 11 92 - 2 1 20 7 5 1 2 1 2 - 4 - - - 208 5.97% 12-13 70 6 67 2 2 2 24 4 4 1 2 - 2 1 3 - - 1 191 5.49% 13-14 70 8 94 - 2 2 25 5 4 2 3 2 1 2 2 1 - - 1 224 6.43% 14-15 62 4 99 1 3 1 32 4 4 2 1 2 1 1 3 - - - 1 221 6.35% 15-16 60 5 95 1 4 2 26 4 4 2 2 1 1 - 2 - - 1 1 211 6.06% 16-17 62 10 88 2 3 - 21 5 2 - 2 - - 1 2 - - - 198 5.69% 17-18 66 6 81 1 2 2 23 6 4 2 - 3 1 1 3 - - - 201 5.77% 18-19 67 7 55 2 - 2 26 4 6 2 1 1 2 1 4 - 1 - 181 5.20% 19-20 41 8 38 - - 2 20 5 4 1 2 1 2 1 3 1 1 1 131 3.76% 20-21 52 5 33 - 2 - 11 3 3 - 2 1 1 - 3 1 - - 117 3.36% 21-22 61 5 28 - 2 1 7 3 1 1 2 - 2 1 3 - 1 - 118 3.39% 22-23 38 4 26 - 2 1 4 1 1 1 1 1 1 1 1 - 1 1 85 2.44% 23-24 31 4 18 - 1 1 5 - 1 1 1 1 - - 1 - - - 65 1.87% TOTAL 1,319 167 1,244 15 43 24 355 82 58 27 28 21 22 15 46 5 4 4 3 3,482 100.00% % 37.88% 4.80% 35.73% 0.43% 1.23% 0.69% 10.20% 2.35% 1.67% 0.78% 0.80% 0.60% 0.63% 0.43% 1.32% 0.14% 0.11% 0.11% 0.09% 100.00% CONTEO Y CLASIFICACION DEL TRAFICO VEHICULOS LIGEROS BUS CAMIONES ################ SEMI TRAILER TRAILER CARRETERA: UBICACIÓN: TRAMO: SENTIDO: ESTACION: FECHA: HORA Autos Pick up C.R. Micros B2 B3 C2 C3 C4 T2S2 T2S3 T3S2 T3S3 C2R2 C2R3 C3R2 C3R3 C4R2 E7 TOTAL % 0-1 39 10 3 - - 1 1 1 1 1 - - 1 - - 1 - - 59 2.21% 1-2 38 8 2 1 1 1 2 1 1 1 1 1 1 1 1 1 - - 62 2.32% 2-3 36 7 1 - 1 1 2 1 1 1 1 - - 1 - 1 - - 54 2.02% 3-4 45 5 1 - - 1 1 1 1 - - 1 1 1 - - - - 58 2.17% 4-5 44 4 6 - 1 1 2 1 1 1 - 1 1 1 1 - - - 65 2.44% 5-6 45 7 18 1 1 - 2 - 1 1 - 1 1 - - - - - 78 2.92% 6-7 52 6 52 2 1 1 1 1 - 1 1 - 1 - - 1 - - 120 4.50% 7-8 61 7 55 4 1 1 1 1 1 1 1 1 1 1 1 1 - - 139 5.21% 8-9 61 7 72 2 1 - 1 - - - 1 1 - - 1 1 - - 148 5.55% 9-10 68 11 71 2 1 1 1 1 - 1 1 - 1 1 1 - - - 161 6.04% 10-11 52 10 76 4 1 1 2 - 1 - 1 1 1 1 1 1 - - 153 5.74% 11-12 48 7 73 2 1 - - 1 1 1 1 1 1 1 1 1 - - 140 5.25% 12-13 60 5 81 1 1 - 1 - 1 1 - - 1 - - 1 - - 153 5.74% 13-14 63 9 83 2 - 1 2 1 - - - - 1 1 - 1 - - 164 6.15% 14-15 55 4 76 5 - 1 1 1 1 1 - 1 1 1 1 1 - - 150 5.62% 15-16 55 5 79 3 1 - 2 1 1 - - - - - 1 1 - - 149 5.59% 16-17 52 6 74 3 1 1 - - - - - - 1 1 1 1 - - 141 5.29% 17-18 61 6 68 2 1 1 1 1 1 1 - 1 1 1 - 1 - - 147 5.51% 18-19 60 7 46 1 - 1 1 - 1 1 1 - - 1 1 - - - 121 4.54% 19-20 55 8 35 1 - - - 1 1 1 - - 1 1 1 - - - 105 3.94% 20-21 40 5 22 1 1 1 2 1 1 - 1 - 1 - 1 1 - - 78 2.92% 21-22 44 7 21 1 - 1 1 1 1 1 1 1 1 - - - - - 81 3.04% 22-23 51 4 20 2 - - 2 1 1 1 1 - 1 - 1 - - - 85 3.19% 23-24 27 1 18 2 1 - - 1 - 1 1 1 1 1 1 - - - 56 2.10% TOTAL 1,212 156 1,053 42 16 16 29 18 18 17 13 12 20 15 15 15 - - - 2,667 100.00% % 45.44% 5.85% 39.48% 1.57% 0.60% 0.60% 1.09% 0.67% 0.67% 0.64% 0.49% 0.45% 0.75% 0.56% 0.56% 0.56% 0.00% 0.00% 0.00% 100.00% CONTEO Y CLASIFICACION DEL TRAFICO VEHICULOS LIGEROS BUS CAMIONES ##################### SEMI TRAILER TRAILER
  • 4. CARRETERA: UBICACIÓN: TRAMO: SENTIDO: ESTACION: FECHA: HORA Autos Pick up C.R. Micros B2 B3 C2 C3 C4 T2S2 T2S3 T3S2 T3S3 C2R2 C2R3 C3R2 C3R3 C4R2 E7 TOTAL % 0-1 34 11 3 - - 1 2 - - 1 - 1 1 1 - - - - 55 2.05% 1-2 30 9 2 - 1 1 1 - - 1 1 1 - - 1 1 - - 49 1.83% 2-3 35 8 1 - 1 - 2 1 1 1 1 1 - 1 1 1 - - 55 2.05% 3-4 42 7 2 - 1 - - - 1 1 - 1 - - 1 1 - - 57 2.13% 4-5 39 6 13 1 1 - 2 - - 1 - 1 1 1 1 - - - 67 2.50% 5-6 40 9 12 1 - - - 1 1 1 - 1 1 1 1 1 - - 70 2.61% 6-7 51 6 54 1 - - 1 - - - 1 1 1 1 - 1 - - 118 4.40% 7-8 57 10 55 5 1 1 1 1 - 1 - 1 - - - 1 - - 134 5.00% 8-9 66 9 72 2 1 - - - 1 - - - - 1 1 - - - 153 5.71% 9-10 67 12 72 3 1 1 - 1 1 - - 1 - - - - - - 159 5.93% 10-11 65 12 81 3 1 - 2 1 1 - - - 1 1 1 1 - - 170 6.34% 11-12 48 7 67 2 1 1 2 1 - 1 - 1 1 1 1 1 - - 135 5.04% 12-13 60 6 85 2 - 1 2 - - - 1 - 1 1 - 1 - - 160 5.97% 13-14 69 8 85 2 - 1 1 - 1 1 - 1 1 1 1 - - - 172 6.42% 14-15 56 5 75 4 - 1 1 - 1 1 1 1 1 1 - 1 - - 149 5.56% 15-16 51 4 76 2 1 1 1 1 1 - - 1 1 1 1 1 - - 143 5.34% 16-17 49 6 75 2 1 1 1 1 1 1 1 - 1 - 1 - - - 141 5.26% 17-18 67 6 71 2 1 1 2 1 1 1 1 1 - - 1 - - - 156 5.82% 18-19 55 8 44 1 1 1 - - - 1 - 1 - 1 - 1 - - 114 4.25% 19-20 49 7 35 2 - 1 - 1 - 1 - 1 1 - - 1 - - 99 3.69% 20-21 43 6 30 1 1 1 2 1 1 1 1 1 - - 1 1 - - 91 3.40% 21-22 41 7 25 2 1 1 1 1 1 - 1 - 1 - - - - - 82 3.06% 22-23 51 5 23 1 - 1 1 - - 1 1 1 - 1 - - - - 86 3.21% 23-24 30 2 21 1 1 1 1 1 1 1 1 1 - 1 1 1 - - 65 2.43% TOTAL ### 176 1,079 40 16 17 26 13 14 17 11 19 13 15 14 15 - - - 2,680 100.00% % #### 6.57% 40.26% 1.49% 0.60% 0.63% 0.97% 0.49% 0.52% 0.63% 0.41% 0.71% 0.49% 0.56% 0.52% 0.56% 0.00% 0.00% #### 100.00% CONTEO Y CLASIFICACION DEL TRAFICO VEHICULOS LIGEROS BUS CAMIONES ################# SEMI TRAILER TRAILER CARRETERA: UBICACIÓN: TRAMO: SENTIDO: ESTACION: FECHA: HORA Autos Pick up C.R. Micros B2 B3 C2 C3 C4 T2S2 T2S3 T3S2 T3S3 C2R2 C2R3 C3R2 C3R3 C4R2 E7 TOTAL % 0-1 28 6 1 - 1 - - 1 1 - - - - 1 - - - - 39 1.43% 1-2 38 7 2 1 1 - 2 1 1 1 1 1 - - 1 1 - - 58 2.13% 2-3 40 8 2 - 1 1 - 1 1 1 - 1 - 1 - 1 - - 58 2.13% 3-4 49 11 3 - - 1 2 1 1 1 1 - 1 1 1 1 - - 74 2.71% 4-5 40 8 6 - 1 1 2 - - - 1 1 1 - - - - - 61 2.24% 5-6 45 10 11 - - - 1 1 1 1 - 1 1 - 1 1 - - 74 2.71% 6-7 53 8 23 1 - - 1 1 1 1 1 1 1 - 1 - - - 93 3.41% 7-8 65 7 75 3 - 1 2 1 - 1 - - 1 - 1 1 - - 158 5.79% 8-9 61 5 80 - 1 1 1 - - 1 1 - 1 - 1 1 - - 154 5.65% 9-10 58 8 76 - 1 - 2 - 1 1 1 1 1 1 - - - - 151 5.54% 10-11 59 9 78 - 1 1 - 1 1 1 1 - 1 - 1 1 - - 155 5.68% 11-12 59 11 86 - - - 2 1 1 1 - - 1 1 1 1 - - 165 6.05% 12-13 65 6 66 2 1 1 - - 1 1 1 1 - 1 1 1 - - 148 5.43% 13-14 65 7 82 - - - 1 1 - - 1 - - 1 1 1 - - 160 5.87% 14-15 56 3 82 - 1 1 1 1 1 - 1 - - - 1 1 - - 149 5.46% 15-16 62 10 90 1 1 1 2 1 1 1 - - 1 - 1 1 - - 173 6.34% 16-17 56 9 78 2 - 1 1 - 1 1 - 1 1 1 - 1 - - 153 5.61% 17-18 64 6 69 1 1 - 2 1 - 1 1 - 1 1 1 1 - - 150 5.50% 18-19 34 7 54 2 1 1 1 - - - - 1 - 1 - 1 - - 103 3.78% 19-20 38 8 40 - - 1 1 1 - 1 1 1 1 - 1 1 - - 95 3.48% 20-21 50 9 40 - - 1 1 - - 1 1 1 1 - 1 - - - 106 3.89% 21-22 65 3 36 - 1 - 1 - 1 1 1 1 1 1 1 - - - 113 4.14% 22-23 41 5 29 1 - 1 1 - 1 - - - 1 - - 1 - - 81 2.97% 23-24 30 2 18 - 1 1 1 - 1 - - - 1 - 1 1 - - 57 2.09% TOTAL 1,221 173 1,127 14 14 15 28 14 16 17 14 12 17 11 17 18 - - - 2,728 100.00% % 44.76% 6.34% 41.31% 0.51% 0.51% 0.55% 1.03% 0.51% 0.59% 0.62% 0.51% 0.44% 0.62% 0.40% 0.62% 0.66% 0.00% 0.00% #### 100.00% CONTEO Y CLASIFICACION DEL TRAFICO VEHICULOS LIGEROS BUS CAMIONES ################# SEMI TRAILER TRAILER
  • 5. CARRETERA: UBICACIÓN: TRAMO: SENTIDO: ESTACION: FECHA: HORA Autos Pick up C.R. Micros B2 B3 C2 C3 C4 T2S2 T2S3 T3S2 T3S3 C2R2 C2R3 C3R2 C3R3 C4R2 E7 TOTAL % 0-1 42 7 2 - - 1 - 1 1 1 - 1 1 - 1 1 - - 59 1.97% 1-2 32 8 2 - 1 1 1 1 1 1 1 1 1 1 1 1 - - 54 1.80% 2-3 41 7 2 - - - 1 - 1 - - 1 1 1 1 1 - - 57 1.90% 3-4 55 8 2 1 1 1 1 1 - - 1 1 - - 1 1 - - 74 2.47% 4-5 39 5 7 - 1 - 2 1 1 - 1 1 - - 1 1 - - 60 2.00% 5-6 43 10 21 1 1 1 - - - 1 1 - 1 1 1 1 - - 83 2.77% 6-7 47 12 63 - 1 1 2 1 - - 1 1 1 1 1 1 - - 133 4.44% 7-8 69 8 80 1 - - 2 1 1 1 1 1 1 1 1 1 - - 169 5.64% 8-9 78 7 88 - - 1 - 1 1 1 1 1 1 1 1 1 - - 183 6.11% 9-10 58 12 92 1 1 - 2 - - 1 - 1 1 - 1 - - - 170 5.67% 10-11 62 15 89 1 1 - 1 - 1 - 1 1 1 1 1 1 - - 176 5.87% 11-12 64 9 92 - 1 - - 1 - 1 - 1 1 1 - - - - 171 5.71% 12-13 56 8 69 2 1 1 2 1 - 1 1 - 1 1 1 1 - - 146 4.87% 13-14 71 6 91 1 - 1 - 1 - 1 - - 1 1 - 1 - - 175 5.84% 14-15 60 5 94 1 1 - 1 1 1 - - 1 1 1 1 1 - - 169 5.64% 15-16 61 6 107 1 1 1 - 1 1 1 1 - 1 1 1 1 - - 185 6.17% 16-17 70 12 78 - 1 - 2 1 1 1 1 1 1 - 1 1 - - 171 5.71% 17-18 60 7 68 1 1 - 2 - 1 1 1 1 - - 1 1 - - 145 4.84% 18-19 63 10 46 1 1 1 2 1 1 1 1 - 1 1 1 1 - - 132 4.40% 19-20 43 8 49 - 1 1 1 - 1 1 1 1 1 1 1 1 - - 111 3.70% 20-21 54 6 36 1 - - 1 1 1 1 1 1 1 - - 1 - - 105 3.50% 21-22 64 6 38 1 1 1 2 1 1 1 1 1 - - 1 1 - - 120 4.00% 22-23 39 5 28 - - 1 2 - 1 1 1 1 - 1 1 - - - 81 2.70% 23-24 36 3 21 - - 1 1 - - 1 1 1 - 1 1 1 - - 68 2.27% TOTAL 1,307 190 1,265 14 16 14 28 16 16 18 18 19 18 16 21 21 - - - 2,997 100.00% % 43.61% 6.34% 42.21% 0.47% 0.53% 0.47% 0.93% 0.53% 0.53% 0.60% 0.60% 0.63% 0.60% 0.53% 0.70% 0.70% 0.00% 0.00% 0.00% 100.00% CONTEO Y CLASIFICACION DEL TRAFICO VEHICULOS LIGEROS BUS CAMIONES SEMI TRAILER TRAILER AutosPick up C.R. Micros B2 B3 C2 C3 C4 T2S2 T2S3 T3S2 T3S3 C2R2 C2R3 C3R2 C3R3 C4R2 E7 JUEVES 1136 307 1665 34 15 15 25 15 16 18 18 17 18 18 15 19 0 0 0 3351 VEH/DIA VIERNES 1191 276 1695 23 17 20 29 19 19 15 19 16 14 15 16 17 0 0 0 3401 VEH/DIA SÁBADO 1319 167 1244 15 43 24 355 82 58 27 28 21 22 15 46 5 4 4 3 3482 VEH/DIA DOMINGO 1212 156 1053 42 16 16 29 18 18 17 13 12 20 15 15 15 0 0 0 2667 VEH/DIA LUNES 1195 176 1079 40 16 17 26 13 14 17 11 19 13 15 14 15 0 0 0 2680 VEH/DIA MARTES 1221 173 1127 14 14 15 28 14 16 17 14 12 17 11 17 18 0 0 0 2728 VEH/DIA MIÉRCOLES 1307 190 1265 14 16 14 28 16 16 18 18 19 18 16 21 21 0 0 0 2997 VEH/DIA VEHICULOS LIGEROS BUS CAMIONES UNITARIOS CAMIONES ACOPLADOS DIA Vi Enero Febrero Marzo Abril Mayo Junio Julio Agosto Setiembre Octubre Noviembre Diciembre Pesados Pesados Pesados Pesados Pesados Pesados Pesados Pesados Pesados Pesados Pesados Pesados FCEP CARRETERA CENTRAL PESADOS 1.052056 1.083990 1.113858 1.217953 1.132323 0.854640 0.786445 0.916331 1.153447 1.125440 0.964453 0.856343 FCEP CARRETERA CENTRAL LIJEROS 1.034344 1.045466 1.145678 1.134795 1.140000 0.754640 0.675759 0.905677 1.124556 1.134500 0.923456 0.887654 Enero Febrero Marzo Abril Mayo Junio Julio Agosto Setiembre Octubre Noviembre Diciembre 0.95051946 0.92251764 0.89778015 0.82104962 0.88314 1.17008331 1.27154474 1.09130917 0.86696658 0.88854137 1.03685716 1.16775638 0.966797 0.956512 0.872846 0.881216 0.877193 1.325135 1.479818 1.104147 0.889240 0.881446 1.082889 1.126565 Factores de corrección promedio para vehículos (2010-2014) Código Peaje 0.4 0.9 1.4 1.9 2.4 2.9 Ene ro Fe bre ro Marzo A bri l Mayo Juni o Jul i o A gosto Se ti e mbre Octubre N ovi e mbre Di ci e mbre FACTOR DE ESTACIONALIDAD
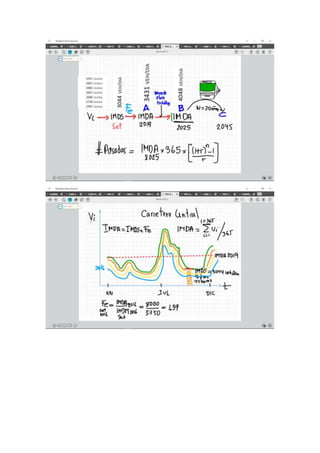
  • 6. IMDS 1226 206 1304 26 20 17 74 25 22 18 17 17 17 15 21 16 1 1 0 3044 VEH/DIA Fe 1.125 1.125 1.125 1.125 1.153 1.153 1.153 1.153 1.153 1.153 1.153 1.153 1.153 1.153 1.153 1.153 1.153 1.153 1.153 IMDA 1379 232 1466 29 23 20 86 29 26 21 20 19 20 17 24 18 1 1 0 3431 VEH/DIA
  • 7. VEHICULO IMDA EJE (TN) f IMDA.f Dd DL r N fc VL 3667 1 0.0005 1.93 0.5 1 2.8 20 26.33 9286.56 3667 1 0.0005 1.93 0.5 1 2.8 20 26.33 9,286.56 B2 27 7 1.265 34.16 0.5 1 3.2 20 27.42 170,989.78 27 10 2.212 59.72 0.5 1 3.2 20 27.42 298,881.01 B3 24 7 1.265 30.37 0.5 1 3.2 20 27.42 151,990.91 24 16 1.261 30.25 0.5 1 3.2 20 27.42 151,416.55 C2 101 7 1.265 127.80 0.5 1 2.7 20 26.07 607,942.60 101 10 2.212 223.39 0.5 1 2.7 20 26.07 1,062,651.22 C3 34 7 1.265 43.02 0.5 1 2.7 20 26.07 204,653.94 34 16 1.261 42.86 0.5 1 2.7 20 26.07 203,880.57 C4 30 7 1.265 37.96 0.5 1 2.7 20 26.07 180,577.01 30 21 1.058 31.73 0.5 1 2.7 20 26.07 150,944.38 T2S2 25 7 1.265 31.63 0.5 1 2.7 20 26.07 150,480.84 25 10 2.212 55.29 0.5 1 2.7 20 26.07 263,032.48 25 16 1.261 31.51 0.5 1 2.7 20 26.07 149,912.18 T2S3 23 7 1.265 29.10 0.5 1 2.7 20 26.07 138,442.37 23 10 2.212 50.87 0.5 1 2.7 20 26.07 241,989.88 23 23 1.232 28.35 0.5 1 2.7 20 26.07 134,837.55 T3S2 22 7 1.265 27.84 0.5 1 2.7 20 26.07 132,423.14 22 16 1.261 27.73 0.5 1 2.7 20 26.07 131,922.72 22 16 1.261 27.73 0.5 1 2.7 20 26.07 131,922.72 T3S3 24 7 1.265 30.37 0.5 1 2.7 20 26.07 144,461.61 24 16 1.261 30.25 0.5 1 2.7 20 26.07 143,915.70 24 23 1.232 29.58 0.5 1 2.7 20 26.07 140,700.05 C2R2 20 7 1.265 25.31 0.5 1 2.7 20 26.07 120,384.67 20 10 2.212 44.24 0.5 1 2.7 20 26.07 210,425.99 20 10 2.212 44.24 0.5 1 2.7 20 26.07 210,425.99 20 10 2.212 44.24 0.5 1 2.7 20 26.07 210,425.99 C2R3 28 7 1.265 35.43 0.5 1 2.7 20 26.07 168,538.54 28 10 2.212 61.93 0.5 1 2.7 20 26.07 294,596.38 28 10 2.212 61.93 0.5 1 2.7 20 26.07 294,596.38 28 16 1.261 35.30 0.5 1 2.7 20 26.07 167,901.65 C3R2 21 7 1.265 26.57 0.5 1 2.7 20 26.07 126,403.91 21 16 1.261 26.47 0.5 1 2.7 20 26.07 125,926.24 21 10 2.212 46.45 0.5 1 2.7 20 26.07 220,947.28 21 10 2.212 46.45 0.5 1 2.7 20 26.07 220,947.28 C3R3 1 7 1.265 1.27 0.5 1 2.7 20 26.07 6,019.23 1 16 1.261 1.26 0.5 1 2.7 20 26.07 5,996.49 1 10 2.212 2.21 0.5 1 2.7 20 26.07 10,521.30 1 16 1.261 1.26 0.5 1 2.7 20 26.07 5,996.49 C4R2 1 7 1.265 1.27 0.5 1 2.7 20 26.07 6,019.23 1 23 1.232 1.23 0.50 1.00 2.70 20.00 26.07 5862.50 1 10 2.212 2.21 0.50 1.00 2.70 20.00 26.07 10521.30 1 10 2.212 2.21 0.50 1.00 2.70 20.00 26.07 10521.30 ESALo= 1576.87 ESAL= 7,539,520.48 ESAL