Download as PDF, PPTX
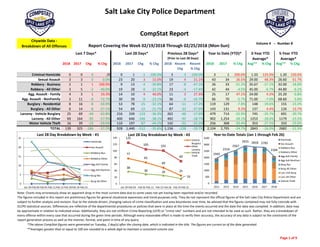

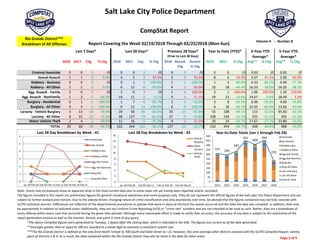
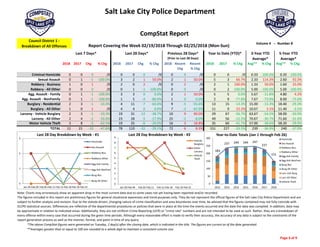
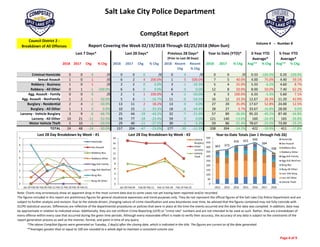
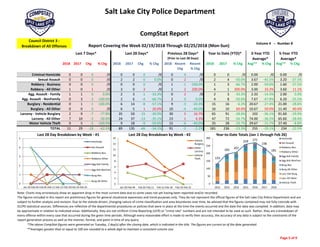
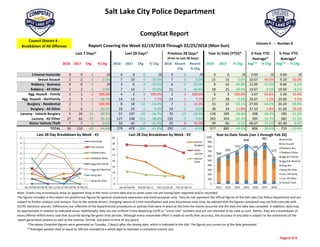

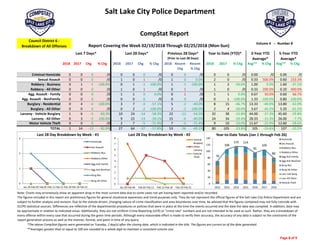
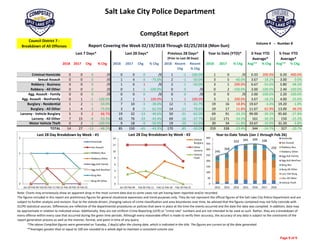

The document provides crime statistics for Salt Lake City, Utah for various time periods in 2018 and comparisons to previous years. Criminal homicides, sexual assaults, and robberies were down in the last 7 days compared to the same period in the previous year. Overall, most crime categories saw decreases in the last 7 days and last 28 days compared to the same periods the previous year, with total crime incidents down 66.7% and 58.2% respectively. Year-to-date totals for 2018 are also down compared to 2017 levels for many offense types.


