17 06-25 SLCPD Weekly Update-D5
•
0 likes•35 views

Salt Lake City Police Dept. Compstat - D5 - Week of 6/19 to 6/25/17

Recommended
More Related Content
What's hot
What's hot (16)
Similar to 17 06-25 SLCPD Weekly Update-D5
Similar to 17 06-25 SLCPD Weekly Update-D5 (17)
More from ELPCO East Liberty Park Comm. Organization
More from ELPCO East Liberty Park Comm. Organization (20)
Recently uploaded
Recently uploaded (20)
17 06-25 SLCPD Weekly Update-D5
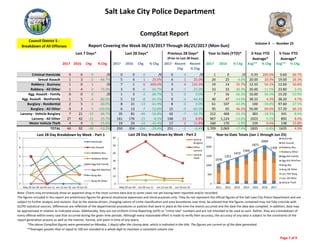
- 1. Salt Lake City Police Department 2017 2016 Chg % Chg 2017 2016 Chg % Chg 2017 Recent Chg Recent % Chg 2017 2016 % Chg Avg** % Chg Avg** % Chg Criminal Homicide 0 0 0 /0 0 0 0 /0 0 0 /0 1 0 /0 0.33 200.0% 0.60 66.7% Sexual Assault 1 3 ‐2 ‐66.7% 5 4 1 25.0% 4 1 25.0% 24 25 ‐4.0% 20.00 20.0% 19.00 26.3% Robbery ‐ Business 1 0 1 /0 7 1 6 600.0% 3 4 133.3% 19 14 35.7% 12.33 54.1% 12.60 50.8% Robbery ‐ All Other 1 4 ‐3 ‐75.0% 3 9 ‐6 ‐66.7% 4 ‐1 ‐25.0% 23 33 ‐30.3% 26.00 ‐11.5% 23.80 ‐3.4% Agg. Assault ‐ Family 0 0 0 /0 1 3 ‐2 ‐66.7% 1 0 0.0% 7 16 ‐56.3% 16.00 ‐56.3% 15.20 ‐53.9% Agg. Assault ‐ NonFamily 1 5 ‐4 ‐80.0% 5 13 ‐8 ‐61.5% 9 ‐4 ‐44.4% 40 47 ‐14.9% 38.33 4.3% 38.20 4.7% Burglary ‐ Residential 2 5 ‐3 ‐60.0% 8 21 ‐13 ‐61.9% 8 0 0.0% 61 107 ‐43.0% 100 ‐39.0% 97.60 ‐37.5% Burglary ‐ All Other 0 3 ‐3 ‐100.0% 6 13 ‐7 ‐53.8% 15 ‐9 ‐60.0% 95 65 46.2% 56.00 69.6% 57.20 66.1% Larceny ‐ Vehicle Burglary 7 21 ‐14 ‐66.7% 35 81 ‐46 ‐56.8% 42 ‐7 ‐16.7% 312 468 ‐33.3% 383 ‐18.5% 341 ‐8.4% Larceny ‐ All Other 27 42 ‐15 ‐35.7% 161 176 ‐15 ‐8.5% 148 13 8.8% 967 1,124 ‐14.0% 1023 ‐5.5% 892 8.4% Motor Vehicle Theft 4 9 ‐5 ‐55.6% 19 33 ‐14 ‐42.4% 17 2 11.8% 160 170 ‐5.9% 159 0.4% 138 15.8% TOTAL 44 92 ‐48 ‐52.2% 250 354 ‐104 ‐29.4% 251 ‐1 ‐0.4% 1,709 2,069 ‐17.4% 1835 ‐6.8% 1635 4.5% May 29Jun 05‐ Jun 12‐Jun 19‐Jun 2011 2012 2013 2014 2015 2016 2017 Homicide 0 0 0 0 1 0 2 0 1 0 1 Sex Assault 3 0 1 1 21 23 12 15 20 25 24 Robbery ‐ Business 1 2 3 1 13 8 18 11 12 14 19 Robbery ‐ All Other 1 0 1 1 21 15 26 24 21 33 23 Aggravated Assault ‐ Family 0 0 1 0 16 12 16 20 12 16 7 Aggravated Assault ‐ All Other 0 2 2 1 38 37 39 29 39 47 40 Burglary ‐ Residential 2 3 1 2 96 76 112 87 106 107 61 Burglary ‐ All Other 1 4 1 0 40 40 78 37 66 65 95 Larceny ‐ Vehicle Burglary 9 12 7 7 258 288 266 298 383 468 312 Larceny ‐ All Other 42 55 37 27 491 659 730 898 1048 1124 967 Vehicle Theft 5 5 5 4 81 93 120 145 163 170 160 TOTALS 64 83 59 44 1076 1251 1419 1564 1871 2069 1709 Year‐to‐Date Totals (Jan 1 through Jun 25) Note: Charts may erroneously show an apparent drop in the most current data due to some cases not yet having been reported and/or recorded. The figures included in this report are preliminary figures for general situational awareness and trend purposes only. They do not represent the official figures of the Salt Lake City Police Department and are subject to further analysis and revision. Due to the statute‐driven, changing nature of crime classification and area boundaries over time, be advised that the figures contained may not fully coincide with SLCPD statistical sources. Differences are reflective of the departmental procedures or policies that were in place at the time the events occurred and the date the data was compiled. In addition, data may be approximate in relation to indicated areas. Additionally, they are not Uniform Crime Reporting (UCR) or "crime rate" numbers and are not intended to be used as such. Rather, they are a breakdown of every offense within every case that occurred during the given time periods. Although every reasonable effort is made to verify their accuracy, the accuracy of any data is subject to the constraints of the report generation process as well as the manner, format, and point in time of any query. CompStat Report……. Council District 5 ‐ Breakdown of All Offenses *The above CompStat figures were generated on Monday, 1 day(s) after the closing date, which is indicated in the title. The figures are current as of the date generated. Last 7 Days* Last 28 Days* Previous 28 Days* (Prior to Last 28 Days) Year to Date (YTD)* 3‐Year YTD Average* 5‐Year YTD Average* Volume 3 ‐‐ Number 25 **Averages greater than or equal to 100 are rounded to a whole digit to maintain a consistent column size. Report Covering the Week 06/19/2017 Through 06/25/2017 (Mon‐Sun) 0 1 2 3 4 5 May 29‐Jun 04 Jun 05‐Jun 11 Jun 12‐Jun 18 Jun 19‐Jun 25 Last 28 Day Breakdown by Week ‐ Part 1 Homicide Sex Assault Robbery‐Bus. Robbery‐Other Agg Aslt‐Family Agg Aslt‐NonFam Burg‐Res Burg‐All Other 1076 1251 1419 1564 1871 2069 1709 0 500 1000 1500 2000 2500 2011 2012 2013 2014 2015 2016 2017 Year‐to‐Date Totals (Jan 1 through Jun 25) Homicide Sex Assault Robbery‐Bus. Robbery‐Other Agg Aslt‐Family Agg Aslt‐NonFam Burg‐Res Burg‐All Other Larc‐Veh Burg Larc‐All Other Vehicle Theft0 10 20 30 40 50 60 May 29‐Jun 04 Jun 05‐Jun 11 Jun 12‐Jun 18 Jun 19‐Jun 25 Last 28 Day Breakdown by Week ‐ Part 2 Vehicle Burglary Other Larceny Vehicle Theft Page 7 of 9