17-07-CompStat Full
•
0 likes•114 views

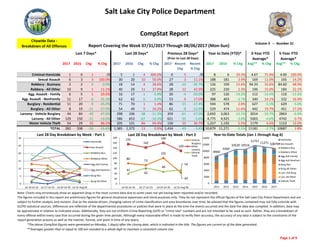
According to the document: - Criminal activity in Salt Lake City decreased slightly in the last 28 days compared to the previous 28 days, with 1,385 total offenses reported versus 1,434 respectively. - However, homicides and aggravated assaults increased, with homicides rising from 0 to 1 and aggravated assaults rising from 62 to 69. - Motor vehicle thefts saw the largest percentage increase, rising 36.7% from 121 to 150.

Recommended
More Related Content
What's hot
What's hot (20)
Similar to 17-07-CompStat Full
Similar to 17-07-CompStat Full (20)
More from ELPCO East Liberty Park Comm. Organization
More from ELPCO East Liberty Park Comm. Organization (20)
Recently uploaded
Recently uploaded (20)
17-07-CompStat Full
- 1. Salt Lake City Police Department 2017 2016 Chg % Chg 2017 2016 Chg % Chg 2017 Recent Chg Recent % Chg 2017 2016 % Chg Avg** % Chg Avg** % Chg Criminal Homicide 1 0 1 /0 5 1 4 400.0% 0 5 /0 8 6 33.3% 4.67 71.4% 4.00 100.0% Sexual Assault 6 3 3 100.0% 30 20 10 50.0% 27 3 11.1% 188 181 3.9% 169 11.0% 165 14.2% Robbery ‐ Business 2 2 0 0.0% 18 14 4 28.6% 28 ‐10 ‐35.7% 126 109 15.6% 94.33 33.6% 84.60 48.9% Robbery ‐ All Other 10 9 1 11.1% 40 29 11 37.9% 28 12 42.9% 225 220 2.3% 196 15.0% 184 22.1% Agg. Assault ‐ Family 6 5 1 20.0% 16 17 ‐1 ‐5.9% 20 ‐4 ‐20.0% 97 120 ‐19.2% 112 ‐13.4% 110 ‐11.5% Agg. Assault ‐ NonFamily 11 17 ‐6 ‐35.3% 62 62 0 0.0% 53 9 17.0% 388 403 ‐3.7% 340 14.1% 332 16.9% Burglary ‐ Residential 11 20 ‐9 ‐45.0% 71 70 1 1.4% 86 ‐15 ‐17.4% 594 578 2.8% 627 ‐5.3% 629 ‐5.6% Burglary ‐ All Other 8 19 ‐11 ‐57.9% 54 49 5 10.2% 62 ‐8 ‐12.9% 529 474 11.6% 442 19.7% 451 17.2% Larceny ‐ Vehicle Burglary 44 84 ‐40 ‐47.6% 298 336 ‐38 ‐11.3% 359 ‐61 ‐17.0% 2,692 3,063 ‐12.1% 3014 ‐10.7% 2863 ‐6.0% Larceny ‐ All Other 129 150 ‐21 ‐14.0% 586 653 ‐67 ‐10.3% 621 ‐35 ‐5.6% 4,775 4,925 ‐3.0% 5003 ‐4.6% 4742 0.7% Motor Vehicle Theft 54 29 25 86.2% 205 121 84 69.4% 150 55 36.7% 1,257 1,192 5.5% 1179 6.6% 1123 12.0% TOTAL 282 338 ‐56 ‐16.6% 1,385 1,372 13 0.9% 1,434 ‐49 ‐3.4% 10,879 11,271 ‐3.5% 11181 ‐2.7% 10687 1.8% Jul 10‐ Jul 17‐J Jul 24‐JJul 31‐Aug 2011 2012 2013 2014 2015 2016 2017 Homicide 1 0 3 1 8 2 4 2 6 6 8 Sex Assault 9 7 8 6 141 173 142 153 174 181 188 Robbery ‐ Business 2 10 4 2 78 54 86 79 95 109 126 Robbery ‐ All Other 13 12 5 10 160 157 177 183 184 220 225 Aggravated Assault ‐ Family 5 2 3 6 83 86 126 100 116 120 97 Aggravated Assault ‐ All Other 15 17 19 11 297 317 322 287 330 403 388 Burglary ‐ Residential 16 24 20 11 665 488 776 576 727 578 594 Burglary ‐ All Other 19 17 10 8 342 453 478 363 489 474 529 Larceny ‐ Vehicle Burglary 80 73 101 44 2249 2672 2602 2783 3196 3063 2692 Larceny ‐ All Other 155 142 160 129 3579 4031 4667 4923 5162 4925 4775 Vehicle Theft 41 62 48 54 858 936 1140 1067 1278 1192 1257 TOTALS 356 366 381 282 8460 9369 10520 10516 11757 11271 10879 Year‐to‐Date Totals (Jan 1 through Aug 6) Note: Charts may erroneously show an apparent drop in the most current data due to some cases not yet having been reported and/or recorded. The figures included in this report are preliminary figures for general situational awareness and trend purposes only. They do not represent the official figures of the Salt Lake City Police Department and are subject to further analysis and revision. Due to the statute‐driven, changing nature of crime classification and area boundaries over time, be advised that the figures contained may not fully coincide with SLCPD statistical sources. Differences are reflective of the departmental procedures or policies that were in place at the time the events occurred and the date the data was compiled. In addition, data may be approximate in relation to indicated areas. Additionally, they are not Uniform Crime Reporting (UCR) or "crime rate" numbers and are not intended to be used as such. Rather, they are a breakdown of every offense within every case that occurred during the given time periods. Although every reasonable effort is made to verify their accuracy, the accuracy of any data is subject to the constraints of the report generation process as well as the manner, format, and point in time of any query. *The above CompStat figures were generated on Monday, 1 day(s) after the closing date, which is indicated in the title. The figures are current as of the date generated. CompStat Report……. Citywide Data ‐ Breakdown of All Offenses Volume 3 ‐‐ Number 31 Last 7 Days* Last 28 Days* Previous 28 Days* (Prior to Last 28 Days) Year to Date (YTD)* 3‐Year YTD Average* 5‐Year YTD Average* **Averages greater than or equal to 100 are rounded to a whole digit to maintain a consistent column size. Report Covering the Week 07/31/2017 Through 08/06/2017 (Mon‐Sun) 0 5 10 15 20 25 30 Jul 10‐Jul 16 Jul 17‐Jul 23 Jul 24‐Jul 30 Jul 31‐Aug 06 Last 28 Day Breakdown by Week ‐ Part 1 Homicide Sex Assault Robbery‐Bus. Robbery‐Other Agg Aslt‐Family Agg Aslt‐NonFam Burg‐Res Burg‐All Other 8460 9369 10520 10516 11757 11271 10879 0 2000 4000 6000 8000 10000 12000 14000 2011 2012 2013 2014 2015 2016 2017 Year‐to‐Date Totals (Jan 1 through Aug 6) Homicide Sex Assault Robbery‐Bus. Robbery‐Other Agg Aslt‐Family Agg Aslt‐NonFam Burg‐Res Burg‐All Other Larc‐Veh Burg Larc‐All Other Vehicle Theft 80 73 101 44 155 142 160 129 41 62 48 54 0 20 40 60 80 100 120 140 160 180 Jul 10‐Jul 16 Jul 17‐Jul 23 Jul 24‐Jul 30 Jul 31‐Aug 06 Last 28 Day Breakdown by Week ‐ Part 2 Vehicle Burglary Other Larceny Vehicle Theft Page 1 of 9
- 2. Salt Lake City Police Department 2017 2016 Chg % Chg 2017 2016 Chg % Chg 2017 Recent Chg Recent % Chg 2017 2016 % Chg Avg** % Chg Avg** % Chg Criminal Homicide 1 0 1 /0 4 0 4 /0 0 4 /0 4 0 /0 0.67 500.0% 0.40 900.0% Sexual Assault 2 1 1 100.0% 5 4 1 25.0% 3 2 66.7% 31 37 ‐16.2% 38.00 ‐18.4% 32.40 ‐4.3% Robbery ‐ Business 0 0 0 /0 0 0 0 /0 5 ‐5 ‐100.0% 17 13 30.8% 11.00 54.5% 9.80 73.5% Robbery ‐ All Other 3 3 0 0.0% 16 15 1 6.7% 12 4 33.3% 89 89 0.0% 78.67 13.1% 67.80 31.3% Agg. Assault ‐ Family 0 0 0 /0 0 1 ‐1 ‐100.0% 2 ‐2 ‐100.0% 7 5 40.0% 6.67 5.0% 6.20 12.9% Agg. Assault ‐ NonFamily 4 2 2 100.0% 21 8 13 162.5% 20 1 5.0% 130 110 18.2% 100 29.6% 93.00 39.8% Burglary ‐ Residential 1 0 1 /0 4 0 4 /0 4 0 0.0% 31 18 72.2% 16.00 93.8% 15.00 106.7% Burglary ‐ All Other 2 6 ‐4 ‐66.7% 5 9 ‐4 ‐44.4% 8 ‐3 ‐37.5% 64 58 10.3% 42.67 50.0% 43.00 48.8% Larceny ‐ Vehicle Burglary 10 14 ‐4 ‐28.6% 60 56 4 7.1% 62 ‐2 ‐3.2% 420 494 ‐15.0% 495 ‐15.1% 530 ‐20.8% Larceny ‐ All Other 22 30 ‐8 ‐26.7% 100 125 ‐25 ‐20.0% 96 4 4.2% 823 837 ‐1.7% 840 ‐2.0% 765 7.6% Motor Vehicle Theft 9 2 7 350.0% 34 10 24 240.0% 18 16 88.9% 122 110 10.9% 109 11.6% 101 20.6% TOTAL 54 58 ‐4 ‐6.9% 249 228 21 9.2% 230 19 8.3% 1,738 1,771 ‐1.9% 1738 0.0% 1664 4.4% Jul 10‐ Jul 17‐J Jul 24‐JJul 31‐Aug 2011 2012 2013 2014 2015 2016 2017 Homicide 0 0 3 1 2 0 0 2 0 0 4 Sex Assault 1 1 1 2 19 26 22 32 45 37 31 Robbery ‐ Business 0 0 0 0 13 5 11 6 14 13 17 Robbery ‐ All Other 8 3 2 3 41 41 62 67 80 89 89 Aggravated Assault ‐ Family 0 0 0 0 4 4 7 10 5 5 7 Aggravated Assault ‐ All Other 5 6 6 4 69 70 94 84 107 110 130 Burglary ‐ Residential 0 1 2 1 17 12 15 10 20 18 31 Burglary ‐ All Other 1 2 0 2 19 40 47 33 37 58 64 Larceny ‐ Vehicle Burglary 8 17 25 10 234 631 537 421 569 494 420 Larceny ‐ All Other 36 21 21 22 500 569 735 816 867 837 823 Vehicle Theft 5 10 10 9 83 80 98 85 133 110 122 TOTALS 64 61 70 54 1001 1478 1628 1566 1877 1771 1738 Year‐to‐Date Totals (Jan 1 through Aug 6) Note: Charts may erroneously show an apparent drop in the most current data due to some cases not yet having been reported and/or recorded. The figures included in this report are preliminary figures for general situational awareness and trend purposes only. They do not represent the official figures of the Salt Lake City Police Department and are subject to further analysis and revision. Due to the statute‐driven, changing nature of crime classification and area boundaries over time, be advised that the figures contained may not fully coincide with SLCPD statistical sources. Differences are reflective of the departmental procedures or policies that were in place at the time the events occurred and the date the data was compiled. In addition, data may be approximate in relation to indicated areas. Additionally, they are not Uniform Crime Reporting (UCR) or "crime rate" numbers and are not intended to be used as such. Rather, they are a breakdown of every offense within every case that occurred during the given time periods. Although every reasonable effort is made to verify their accuracy, the accuracy of any data is subject to the constraints of the report generation process as well as the manner, format, and point in time of any query. *The above CompStat figures were generated on Monday, 1 day(s) after the closing date, which is indicated in the title. The figures are current as of the date generated. **Averages greater than or equal to 100 are rounded to a whole digit to maintain a consistent column size. ***The Rio Grande District is defined as the area from North Temple to 700 South and State Street to I‐15. However, this area overlaps other districts covered with the SLCPD CompStat Report, namely parts of Districts 3 & 4. As a result, the data contained within the Rio Grande District may also be listed in the data for other areas. CompStat Report……. Rio Grande District*** Breakdown of All Offenses Report Covering the Week 07/31/2017 Through 08/06/2017 (Mon‐Sun) Volume 3 ‐‐ Number 31 Last 7 Days* Last 28 Days* Previous 28 Days* (Prior to Last 28 Days) Year to Date (YTD)* 3‐Year YTD Average* 5‐Year YTD Average* 0 1 2 3 4 5 6 7 8 9 Jul 10‐Jul 16 Jul 17‐Jul 23 Jul 24‐Jul 30 Jul 31‐Aug 06 Last 28 Day Breakdown by Week ‐ Part 1 Homicide Sex Assault Robbery‐Bus. Robbery‐Other Agg Aslt‐Family Agg Aslt‐NonFam Burg‐Res Burg‐All Other 1001 1478 1628 1566 1877 1771 1738 0 200 400 600 800 1000 1200 1400 1600 1800 2000 2011 2012 2013 2014 2015 2016 2017 Year‐to‐Date Totals (Jan 1 through Aug 6) Homicide Sex Assault Robbery‐Bus. Robbery‐Other Agg Aslt‐Family Agg Aslt‐NonFam Burg‐Res Burg‐All Other Larc‐Veh Burg Larc‐All Other Vehicle Theft 0 5 10 15 20 25 30 35 40 Jul 10‐Jul 16 Jul 17‐Jul 23 Jul 24‐Jul 30 Jul 31‐Aug 06 Last 28 Day Breakdown by Week ‐ Part 2 Vehicle Burglary Other Larceny Vehicle Theft Page 2 of 9
- 3. Salt Lake City Police Department 2017 2016 Chg % Chg 2017 2016 Chg % Chg 2017 Recent Chg Recent % Chg 2017 2016 % Chg Avg** % Chg Avg** % Chg Criminal Homicide 0 0 0 /0 0 0 0 /0 0 0 /0 0 2 ‐100.0% 1.00 ‐100.0% 0.60 ‐100.0% Sexual Assault 1 1 0 0.0% 5 2 3 150.0% 5 0 0.0% 26 12 116.7% 13.67 90.2% 15.20 71.1% Robbery ‐ Business 1 0 1 /0 2 1 1 100.0% 4 ‐2 ‐50.0% 11 9 22.2% 7.33 50.0% 5.60 96.4% Robbery ‐ All Other 1 1 0 0.0% 3 3 0 0.0% 4 ‐1 ‐25.0% 16 20 ‐20.0% 21.00 ‐23.8% 18.40 ‐13.0% Agg. Assault ‐ Family 2 3 ‐1 ‐33.3% 4 8 ‐4 ‐50.0% 2 2 100.0% 20 36 ‐44.4% 27.67 ‐27.7% 26.00 ‐23.1% Agg. Assault ‐ NonFamily 0 1 ‐1 ‐100.0% 6 14 ‐8 ‐57.1% 6 0 0.0% 42 45 ‐6.7% 36.67 14.5% 40.80 2.9% Burglary ‐ Residential 1 2 ‐1 ‐50.0% 5 11 ‐6 ‐54.5% 8 ‐3 ‐37.5% 71 61 16.4% 86.33 ‐17.8% 93.60 ‐24.1% Burglary ‐ All Other 1 1 0 0.0% 2 2 0 0.0% 4 ‐2 ‐50.0% 29 28 3.6% 34.67 ‐16.3% 35.80 ‐19.0% Larceny ‐ Vehicle Burglary 3 10 ‐7 ‐70.0% 19 26 ‐7 ‐26.9% 23 ‐4 ‐17.4% 219 221 ‐0.9% 244 ‐10.4% 220 ‐0.4% Larceny ‐ All Other 5 7 ‐2 ‐28.6% 29 32 ‐3 ‐9.4% 35 ‐6 ‐17.1% 235 290 ‐19.0% 293 ‐19.9% 296 ‐20.6% Motor Vehicle Theft 3 3 0 0.0% 12 14 ‐2 ‐14.3% 16 ‐4 ‐25.0% 166 178 ‐6.7% 179 ‐7.4% 177 ‐6.1% TOTAL 18 29 ‐11 ‐37.9% 87 113 ‐26 ‐23.0% 107 ‐20 ‐18.7% 835 902 ‐7.4% 945 ‐11.7% 928 ‐10.1% Jul 10‐ Jul 17‐J Jul 24‐JJul 31‐Aug 2011 2012 2013 2014 2015 2016 2017 Homicide 0 0 0 0 1 0 0 0 1 2 0 Sex Assault 3 0 1 1 20 16 19 13 16 12 26 Robbery ‐ Business 0 0 1 1 1 2 4 6 7 9 11 Robbery ‐ All Other 2 0 0 1 13 15 14 23 20 20 16 Aggravated Assault ‐ Family 2 0 0 2 23 20 27 20 27 36 20 Aggravated Assault ‐ All Other 0 3 3 0 32 45 49 30 35 45 42 Burglary ‐ Residential 1 2 1 1 75 69 140 91 107 61 71 Burglary ‐ All Other 0 0 1 1 23 22 53 26 50 28 29 Larceny ‐ Vehicle Burglary 5 6 5 3 184 169 197 248 264 221 219 Larceny ‐ All Other 4 12 8 5 291 303 296 274 316 290 235 Vehicle Theft 3 3 3 3 150 139 207 190 170 178 166 TOTALS 20 26 23 18 813 800 1006 921 1013 902 835 Year‐to‐Date Totals (Jan 1 through Aug 6) Note: Charts may erroneously show an apparent drop in the most current data due to some cases not yet having been reported and/or recorded. The figures included in this report are preliminary figures for general situational awareness and trend purposes only. They do not represent the official figures of the Salt Lake City Police Department and are subject to further analysis and revision. Due to the statute‐driven, changing nature of crime classification and area boundaries over time, be advised that the figures contained may not fully coincide with SLCPD statistical sources. Differences are reflective of the departmental procedures or policies that were in place at the time the events occurred and the date the data was compiled. In addition, data may be approximate in relation to indicated areas. Additionally, they are not Uniform Crime Reporting (UCR) or "crime rate" numbers and are not intended to be used as such. Rather, they are a breakdown of every offense within every case that occurred during the given time periods. Although every reasonable effort is made to verify their accuracy, the accuracy of any data is subject to the constraints of the report generation process as well as the manner, format, and point in time of any query. CompStat Report……. Council District 1 ‐ Breakdown of All Offenses *The above CompStat figures were generated on Monday, 1 day(s) after the closing date, which is indicated in the title. The figures are current as of the date generated. Last 7 Days* Last 28 Days* Previous 28 Days* (Prior to Last 28 Days) Year to Date (YTD)* 3‐Year YTD Average* 5‐Year YTD Average* Volume 3 ‐‐ Number 31 **Averages greater than or equal to 100 are rounded to a whole digit to maintain a consistent column size. Report Covering the Week 07/31/2017 Through 08/06/2017 (Mon‐Sun) 0 1 2 3 4 Jul 10‐Jul 16 Jul 17‐Jul 23 Jul 24‐Jul 30 Jul 31‐Aug 06 Last 28 Day Breakdown by Week ‐ Part 1 Homicide Sex Assault Robbery‐Bus. Robbery‐Other Agg Aslt‐Family Agg Aslt‐NonFam Burg‐Res Burg‐All Other 813 800 1006 921 1013 902 835 0 200 400 600 800 1000 1200 2011 2012 2013 2014 2015 2016 2017 Year‐to‐Date Totals (Jan 1 through Aug 6) Homicide Sex Assault Robbery‐Bus. Robbery‐Other Agg Aslt‐Family Agg Aslt‐NonFam Burg‐Res Burg‐All Other Larc‐Veh Burg Larc‐All Other Vehicle Theft 0 2 4 6 8 10 12 14 Jul 10‐Jul 16 Jul 17‐Jul 23 Jul 24‐Jul 30 Jul 31‐Aug 06 Last 28 Day Breakdown by Week ‐ Part 2 Vehicle Burglary Other Larceny Vehicle Theft Page 3 of 9
- 4. Salt Lake City Police Department 2017 2016 Chg % Chg 2017 2016 Chg % Chg 2017 Recent Chg Recent % Chg 2017 2016 % Chg Avg** % Chg Avg** % Chg Criminal Homicide 0 0 0 /0 0 0 0 /0 0 0 /0 0 3 ‐100.0% 1.33 ‐100.0% 1.40 ‐100.0% Sexual Assault 0 0 0 /0 3 4 ‐1 ‐25.0% 5 ‐2 ‐40.0% 20 26 ‐23.1% 24.00 ‐16.7% 24.80 ‐19.4% Robbery ‐ Business 0 0 0 /0 6 4 2 50.0% 6 0 0.0% 22 18 22.2% 15.67 40.4% 15.20 44.7% Robbery ‐ All Other 3 1 2 200.0% 10 3 7 233.3% 5 5 100.0% 50 33 51.5% 30.33 64.8% 30.60 63.4% Agg. Assault ‐ Family 0 1 ‐1 ‐100.0% 4 4 0 0.0% 5 ‐1 ‐20.0% 32 28 14.3% 28.00 14.3% 27.20 17.6% Agg. Assault ‐ NonFamily 1 5 ‐4 ‐80.0% 11 12 ‐1 ‐8.3% 10 1 10.0% 79 85 ‐7.1% 65.67 20.3% 58.00 36.2% Burglary ‐ Residential 2 2 0 0.0% 13 10 3 30.0% 11 2 18.2% 98 55 78.2% 78.33 25.1% 91.60 7.0% Burglary ‐ All Other 2 0 2 /0 9 4 5 125.0% 14 ‐5 ‐35.7% 94 111 ‐15.3% 110 ‐14.8% 108 ‐13.1% Larceny ‐ Vehicle Burglary 8 12 ‐4 ‐33.3% 31 39 ‐8 ‐20.5% 22 9 40.9% 302 374 ‐19.3% 330 ‐8.5% 322 ‐6.3% Larceny ‐ All Other 33 16 17 106.3% 83 86 ‐3 ‐3.5% 88 ‐5 ‐5.7% 628 698 ‐10.0% 716 ‐12.2% 714 ‐12.0% Motor Vehicle Theft 12 5 7 140.0% 44 25 19 76.0% 28 16 57.1% 276 271 1.8% 250 10.5% 231 19.3% TOTAL 61 42 19 45.2% 214 191 23 12.0% 194 20 10.3% 1,601 1,702 ‐5.9% 1649 ‐2.9% 1625 ‐1.5% Jul 10‐ Jul 17‐J Jul 24‐JJul 31‐Aug 2011 2012 2013 2014 2015 2016 2017 Homicide 0 0 0 0 1 2 1 0 1 3 0 Sex Assault 0 1 2 0 13 29 23 28 18 26 20 Robbery ‐ Business 1 5 0 0 20 12 17 11 18 18 22 Robbery ‐ All Other 2 4 1 3 31 33 29 30 28 33 50 Aggravated Assault ‐ Family 2 1 1 0 19 21 31 24 32 28 32 Aggravated Assault ‐ All Other 3 2 5 1 44 51 42 60 52 85 79 Burglary ‐ Residential 4 5 2 2 135 73 150 90 90 55 98 Burglary ‐ All Other 4 2 1 2 96 109 101 86 134 111 94 Larceny ‐ Vehicle Burglary 8 9 6 8 359 295 326 303 313 374 302 Larceny ‐ All Other 15 18 17 33 781 722 701 724 725 698 628 Vehicle Theft 7 11 14 12 194 186 222 216 262 271 276 TOTALS 46 58 49 61 1693 1533 1643 1572 1673 1702 1601 Year‐to‐Date Totals (Jan 1 through Aug 6) Note: Charts may erroneously show an apparent drop in the most current data due to some cases not yet having been reported and/or recorded. The figures included in this report are preliminary figures for general situational awareness and trend purposes only. They do not represent the official figures of the Salt Lake City Police Department and are subject to further analysis and revision. Due to the statute‐driven, changing nature of crime classification and area boundaries over time, be advised that the figures contained may not fully coincide with SLCPD statistical sources. Differences are reflective of the departmental procedures or policies that were in place at the time the events occurred and the date the data was compiled. In addition, data may be approximate in relation to indicated areas. Additionally, they are not Uniform Crime Reporting (UCR) or "crime rate" numbers and are not intended to be used as such. Rather, they are a breakdown of every offense within every case that occurred during the given time periods. Although every reasonable effort is made to verify their accuracy, the accuracy of any data is subject to the constraints of the report generation process as well as the manner, format, and point in time of any query. CompStat Report……. Council District 2 ‐ Breakdown of All Offenses *The above CompStat figures were generated on Monday, 1 day(s) after the closing date, which is indicated in the title. The figures are current as of the date generated. Last 7 Days* Last 28 Days* Previous 28 Days* (Prior to Last 28 Days) Year to Date (YTD)* 3‐Year YTD Average* 5‐Year YTD Average* Volume 3 ‐‐ Number 31 **Averages greater than or equal to 100 are rounded to a whole digit to maintain a consistent column size. Report Covering the Week 07/31/2017 Through 08/06/2017 (Mon‐Sun) 0 1 2 3 4 5 6 Jul 10‐Jul 16 Jul 17‐Jul 23 Jul 24‐Jul 30 Jul 31‐Aug 06 Last 28 Day Breakdown by Week ‐ Part 1 Homicide Sex Assault Robbery‐Bus. Robbery‐Other Agg Aslt‐Family Agg Aslt‐NonFam Burg‐Res Burg‐All Other 1693 1533 1643 1572 1673 1702 1601 0 200 400 600 800 1000 1200 1400 1600 1800 2011 2012 2013 2014 2015 2016 2017 Year‐to‐Date Totals (Jan 1 through Aug 6) Homicide Sex Assault Robbery‐Bus. Robbery‐Other Agg Aslt‐Family Agg Aslt‐NonFam Burg‐Res Burg‐All Other Larc‐Veh Burg Larc‐All Other Vehicle Theft 0 5 10 15 20 25 30 35 Jul 10‐Jul 16 Jul 17‐Jul 23 Jul 24‐Jul 30 Jul 31‐Aug 06 Last 28 Day Breakdown by Week ‐ Part 2 Vehicle Burglary Other Larceny Vehicle Theft Page 4 of 9
- 5. Salt Lake City Police Department 2017 2016 Chg % Chg 2017 2016 Chg % Chg 2017 Recent Chg Recent % Chg 2017 2016 % Chg Avg** % Chg Avg** % Chg Criminal Homicide 0 0 0 /0 0 1 ‐1 ‐100.0% 0 0 /0 0 1 ‐100.0% 0.67 ‐100.0% 0.40 ‐100.0% Sexual Assault 0 0 0 /0 2 0 2 /0 3 ‐1 ‐33.3% 21 16 31.3% 12.67 65.8% 14.00 50.0% Robbery ‐ Business 0 0 0 /0 1 0 1 /0 1 0 0.0% 8 3 166.7% 4.33 84.6% 3.00 166.7% Robbery ‐ All Other 0 1 ‐1 ‐100.0% 1 1 0 0.0% 1 0 0.0% 11 13 ‐15.4% 10.33 6.5% 8.80 25.0% Agg. Assault ‐ Family 1 1 0 0.0% 2 2 0 0.0% 1 1 100.0% 6 17 ‐64.7% 9.67 ‐37.9% 8.60 ‐30.2% Agg. Assault ‐ NonFamily 0 0 0 /0 1 0 1 /0 2 ‐1 ‐50.0% 23 28 ‐17.9% 19.67 16.9% 17.40 32.2% Burglary ‐ Residential 1 4 ‐3 ‐75.0% 12 8 4 50.0% 18 ‐6 ‐33.3% 90 87 3.4% 94.67 ‐4.9% 89.40 0.7% Burglary ‐ All Other 0 3 ‐3 ‐100.0% 5 7 ‐2 ‐28.6% 10 ‐5 ‐50.0% 61 53 15.1% 46.67 30.7% 46.00 32.6% Larceny ‐ Vehicle Burglary 4 11 ‐7 ‐63.6% 44 40 4 10.0% 49 ‐5 ‐10.2% 383 410 ‐6.6% 437 ‐12.3% 378 1.4% Larceny ‐ All Other 1 10 ‐9 ‐90.0% 30 32 ‐2 ‐6.3% 30 0 0.0% 257 249 3.2% 279 ‐7.8% 264 ‐2.8% Motor Vehicle Theft 4 5 ‐1 ‐20.0% 31 21 10 47.6% 17 14 82.4% 145 116 25.0% 113 28.7% 106 36.5% TOTAL 11 35 ‐24 ‐68.6% 129 112 17 15.2% 132 ‐3 ‐2.3% 1,005 993 1.2% 1027 ‐2.1% 936 7.4% Jul 10‐ Jul 17‐J Jul 24‐JJul 31‐Aug 2011 2012 2013 2014 2015 2016 2017 Homicide 0 0 0 0 1 0 0 0 1 1 0 Sex Assault 1 1 0 0 19 16 16 9 13 16 21 Robbery ‐ Business 0 0 1 0 10 1 1 9 1 3 8 Robbery ‐ All Other 0 0 1 0 12 2 11 10 8 13 11 Aggravated Assault ‐ Family 1 0 0 1 5 7 7 5 7 17 6 Aggravated Assault ‐ All Other 0 1 0 0 22 15 13 10 21 28 23 Burglary ‐ Residential 3 1 7 1 98 64 99 82 115 87 90 Burglary ‐ All Other 3 1 1 0 42 38 52 49 38 53 61 Larceny ‐ Vehicle Burglary 10 13 17 4 256 242 336 461 439 410 383 Larceny ‐ All Other 10 8 11 1 232 228 258 297 290 249 257 Vehicle Theft 8 13 6 4 101 89 104 90 132 116 145 TOTALS 36 38 44 11 798 702 897 1022 1065 993 1005 Year‐to‐Date Totals (Jan 1 through Aug 6) Note: Charts may erroneously show an apparent drop in the most current data due to some cases not yet having been reported and/or recorded. The figures included in this report are preliminary figures for general situational awareness and trend purposes only. They do not represent the official figures of the Salt Lake City Police Department and are subject to further analysis and revision. Due to the statute‐driven, changing nature of crime classification and area boundaries over time, be advised that the figures contained may not fully coincide with SLCPD statistical sources. Differences are reflective of the departmental procedures or policies that were in place at the time the events occurred and the date the data was compiled. In addition, data may be approximate in relation to indicated areas. Additionally, they are not Uniform Crime Reporting (UCR) or "crime rate" numbers and are not intended to be used as such. Rather, they are a breakdown of every offense within every case that occurred during the given time periods. Although every reasonable effort is made to verify their accuracy, the accuracy of any data is subject to the constraints of the report generation process as well as the manner, format, and point in time of any query. CompStat Report……. Council District 3 ‐ Breakdown of All Offenses *The above CompStat figures were generated on Monday, 1 day(s) after the closing date, which is indicated in the title. The figures are current as of the date generated. Last 7 Days* Last 28 Days* Previous 28 Days* (Prior to Last 28 Days) Year to Date (YTD)* 3‐Year YTD Average* 5‐Year YTD Average* Volume 3 ‐‐ Number 31 **Averages greater than or equal to 100 are rounded to a whole digit to maintain a consistent column size. Report Covering the Week 07/31/2017 Through 08/06/2017 (Mon‐Sun) 0 1 2 3 4 5 6 7 8 Jul 10‐Jul 16 Jul 17‐Jul 23 Jul 24‐Jul 30 Jul 31‐Aug 06 Last 28 Day Breakdown by Week ‐ Part 1 Homicide Sex Assault Robbery‐Bus. Robbery‐Other Agg Aslt‐Family Agg Aslt‐NonFam Burg‐Res Burg‐All Other 798 702 897 1022 1065 993 1005 0 200 400 600 800 1000 1200 2011 2012 2013 2014 2015 2016 2017 Year‐to‐Date Totals (Jan 1 through Aug 6) Homicide Sex Assault Robbery‐Bus. Robbery‐Other Agg Aslt‐Family Agg Aslt‐NonFam Burg‐Res Burg‐All Other Larc‐Veh Burg Larc‐All Other Vehicle Theft0 2 4 6 8 10 12 14 16 18 Jul 10‐Jul 16 Jul 17‐Jul 23 Jul 24‐Jul 30 Jul 31‐Aug 06 Last 28 Day Breakdown by Week ‐ Part 2 Vehicle Burglary Other Larceny Vehicle Theft Page 5 of 9
- 6. Salt Lake City Police Department 2017 2016 Chg % Chg 2017 2016 Chg % Chg 2017 Recent Chg Recent % Chg 2017 2016 % Chg Avg** % Chg Avg** % Chg Criminal Homicide 1 0 1 /0 4 0 4 /0 0 4 /0 5 0 /0 0.67 650.0% 0.40 1150.0% Sexual Assault 3 1 2 200.0% 10 6 4 66.7% 4 6 150.0% 69 70 ‐1.4% 67.33 2.5% 59.20 16.6% Robbery ‐ Business 1 1 0 0.0% 4 4 0 0.0% 9 ‐5 ‐55.6% 49 34 44.1% 27.67 77.1% 24.40 100.8% Robbery ‐ All Other 4 3 1 33.3% 17 15 2 13.3% 14 3 21.4% 105 96 9.4% 89.00 18.0% 82.40 27.4% Agg. Assault ‐ Family 2 0 2 /0 4 0 4 /0 4 0 0.0% 21 12 75.0% 15.67 34.0% 17.40 20.7% Agg. Assault ‐ NonFamily 6 3 3 100.0% 29 13 16 123.1% 25 4 16.0% 170 149 14.1% 136 24.7% 129 31.6% Burglary ‐ Residential 2 4 ‐2 ‐50.0% 13 11 2 18.2% 17 ‐4 ‐23.5% 125 108 15.7% 101 23.8% 95.60 30.8% Burglary ‐ All Other 2 7 ‐5 ‐71.4% 15 13 2 15.4% 14 1 7.1% 134 108 24.1% 104 28.8% 108 23.6% Larceny ‐ Vehicle Burglary 11 22 ‐11 ‐50.0% 89 85 4 4.7% 105 ‐16 ‐15.2% 791 773 2.3% 841 ‐6.0% 854 ‐7.4% Larceny ‐ All Other 42 50 ‐8 ‐16.0% 192 217 ‐25 ‐11.5% 189 3 1.6% 1,593 1,522 4.7% 1585 0.5% 1517 5.0% Motor Vehicle Theft 15 7 8 114.3% 56 20 36 180.0% 44 12 27.3% 275 232 18.5% 240 14.7% 222 23.9% TOTAL 89 98 ‐9 ‐9.2% 433 384 49 12.8% 425 8 1.9% 3,337 3,104 7.5% 3208 4.0% 3110 7.3% Jul 10‐ Jul 17‐J Jul 24‐JJul 31‐Aug 2011 2012 2013 2014 2015 2016 2017 Homicide 0 0 3 1 2 0 0 2 0 0 5 Sex Assault 3 3 1 3 42 57 37 57 75 70 69 Robbery ‐ Business 1 1 1 1 23 15 24 19 30 34 49 Robbery ‐ All Other 8 3 2 4 54 67 78 79 92 96 105 Aggravated Assault ‐ Family 0 0 2 2 10 11 29 19 16 12 21 Aggravated Assault ‐ All Other 10 7 6 6 109 111 126 121 139 149 170 Burglary ‐ Residential 3 5 3 2 108 65 110 84 111 108 125 Burglary ‐ All Other 4 6 3 2 61 124 106 86 118 108 134 Larceny ‐ Vehicle Burglary 20 21 37 11 451 917 830 842 909 773 791 Larceny ‐ All Other 64 32 54 42 986 1210 1620 1633 1600 1522 1593 Vehicle Theft 12 15 14 15 168 161 230 201 286 232 275 TOTALS 125 93 126 89 2014 2738 3190 3143 3376 3104 3337 Year‐to‐Date Totals (Jan 1 through Aug 6) Note: Charts may erroneously show an apparent drop in the most current data due to some cases not yet having been reported and/or recorded. The figures included in this report are preliminary figures for general situational awareness and trend purposes only. They do not represent the official figures of the Salt Lake City Police Department and are subject to further analysis and revision. Due to the statute‐driven, changing nature of crime classification and area boundaries over time, be advised that the figures contained may not fully coincide with SLCPD statistical sources. Differences are reflective of the departmental procedures or policies that were in place at the time the events occurred and the date the data was compiled. In addition, data may be approximate in relation to indicated areas. Additionally, they are not Uniform Crime Reporting (UCR) or "crime rate" numbers and are not intended to be used as such. Rather, they are a breakdown of every offense within every case that occurred during the given time periods. Although every reasonable effort is made to verify their accuracy, the accuracy of any data is subject to the constraints of the report generation process as well as the manner, format, and point in time of any query. CompStat Report……. Council District 4 ‐ Breakdown of All Offenses *The above CompStat figures were generated on Monday, 1 day(s) after the closing date, which is indicated in the title. The figures are current as of the date generated. Last 7 Days* Last 28 Days* Previous 28 Days* (Prior to Last 28 Days) Year to Date (YTD)* 3‐Year YTD Average* 5‐Year YTD Average* Volume 3 ‐‐ Number 31 **Averages greater than or equal to 100 are rounded to a whole digit to maintain a consistent column size. Report Covering the Week 07/31/2017 Through 08/06/2017 (Mon‐Sun) 0 2 4 6 8 10 12 Jul 10‐Jul 16 Jul 17‐Jul 23 Jul 24‐Jul 30 Jul 31‐Aug 06 Last 28 Day Breakdown by Week ‐ Part 1 Homicide Sex Assault Robbery‐Bus. Robbery‐Other Agg Aslt‐Family Agg Aslt‐NonFam Burg‐Res Burg‐All Other 2014 2738 3190 3143 3376 3104 3337 0 500 1000 1500 2000 2500 3000 3500 4000 2011 2012 2013 2014 2015 2016 2017 Year‐to‐Date Totals (Jan 1 through Aug 6) Homicide Sex Assault Robbery‐Bus. Robbery‐Other Agg Aslt‐Family Agg Aslt‐NonFam Burg‐Res Burg‐All Other Larc‐Veh Burg Larc‐All Other Vehicle Theft0 10 20 30 40 50 60 70 Jul 10‐Jul 16 Jul 17‐Jul 23 Jul 24‐Jul 30 Jul 31‐Aug 06 Last 28 Day Breakdown by Week ‐ Part 2 Vehicle Burglary Other Larceny Vehicle Theft Page 6 of 9
- 7. Salt Lake City Police Department 2017 2016 Chg % Chg 2017 2016 Chg % Chg 2017 Recent Chg Recent % Chg 2017 2016 % Chg Avg** % Chg Avg** % Chg Criminal Homicide 0 0 0 /0 0 0 0 /0 0 0 /0 1 0 /0 0.67 50.0% 0.80 25.0% Sexual Assault 0 1 ‐1 ‐100.0% 6 7 ‐1 ‐14.3% 7 ‐1 ‐14.3% 35 35 0.0% 27.00 29.6% 26.00 34.6% Robbery ‐ Business 0 1 ‐1 ‐100.0% 4 5 ‐1 ‐20.0% 4 0 0.0% 23 19 21.1% 17.33 32.7% 17.40 32.2% Robbery ‐ All Other 1 3 ‐2 ‐66.7% 5 4 1 25.0% 3 2 66.7% 29 39 ‐25.6% 32.67 ‐11.2% 30.80 ‐5.8% Agg. Assault ‐ Family 0 0 0 /0 0 2 ‐2 ‐100.0% 4 ‐4 ‐100.0% 10 18 ‐44.4% 19.33 ‐48.3% 19.00 ‐47.4% Agg. Assault ‐ NonFamily 4 6 ‐2 ‐33.3% 14 16 ‐2 ‐12.5% 7 7 100.0% 57 72 ‐20.8% 52.67 8.2% 51.60 10.5% Burglary ‐ Residential 0 3 ‐3 ‐100.0% 13 13 0 0.0% 10 3 30.0% 81 128 ‐36.7% 128 ‐36.6% 125 ‐35.4% Burglary ‐ All Other 2 5 ‐3 ‐60.0% 15 16 ‐1 ‐6.3% 8 7 87.5% 117 83 41.0% 74.67 56.7% 75.40 55.2% Larceny ‐ Vehicle Burglary 6 15 ‐9 ‐60.0% 47 68 ‐21 ‐30.9% 66 ‐19 ‐28.8% 414 580 ‐28.6% 485 ‐14.6% 434 ‐4.6% Larceny ‐ All Other 24 38 ‐14 ‐36.8% 143 158 ‐15 ‐9.5% 154 ‐11 ‐7.1% 1,205 1,354 ‐11.0% 1294 ‐6.9% 1143 5.4% Motor Vehicle Theft 12 3 9 300.0% 34 21 13 61.9% 23 11 47.8% 207 211 ‐1.9% 201 2.8% 182 14.0% TOTAL 49 75 ‐26 ‐34.7% 281 310 ‐29 ‐9.4% 286 ‐5 ‐1.7% 2,179 2,539 ‐14.2% 2333 ‐6.6% 2105 3.5% Jul 10‐ Jul 17‐J Jul 24‐JJul 31‐Aug 2011 2012 2013 2014 2015 2016 2017 Homicide 0 0 0 0 1 0 2 0 2 0 1 Sex Assault 1 2 3 0 28 31 18 21 25 35 35 Robbery ‐ Business 0 3 1 0 14 15 20 14 19 19 23 Robbery ‐ All Other 1 2 1 1 32 23 33 33 26 39 29 Aggravated Assault ‐ Family 0 0 0 0 19 16 21 23 17 18 10 Aggravated Assault ‐ All Other 2 3 5 4 54 47 53 37 49 72 57 Burglary ‐ Residential 5 6 2 0 128 102 142 109 146 128 81 Burglary ‐ All Other 5 6 2 2 54 63 90 56 85 83 117 Larceny ‐ Vehicle Burglary 15 10 16 6 329 389 325 372 503 580 414 Larceny ‐ All Other 35 49 35 24 598 861 973 1159 1370 1354 1205 Vehicle Theft 8 11 3 12 109 136 168 184 209 211 207 TOTALS 72 92 68 49 1366 1683 1845 2008 2451 2539 2179 Year‐to‐Date Totals (Jan 1 through Aug 6) Note: Charts may erroneously show an apparent drop in the most current data due to some cases not yet having been reported and/or recorded. The figures included in this report are preliminary figures for general situational awareness and trend purposes only. They do not represent the official figures of the Salt Lake City Police Department and are subject to further analysis and revision. Due to the statute‐driven, changing nature of crime classification and area boundaries over time, be advised that the figures contained may not fully coincide with SLCPD statistical sources. Differences are reflective of the departmental procedures or policies that were in place at the time the events occurred and the date the data was compiled. In addition, data may be approximate in relation to indicated areas. Additionally, they are not Uniform Crime Reporting (UCR) or "crime rate" numbers and are not intended to be used as such. Rather, they are a breakdown of every offense within every case that occurred during the given time periods. Although every reasonable effort is made to verify their accuracy, the accuracy of any data is subject to the constraints of the report generation process as well as the manner, format, and point in time of any query. CompStat Report……. Council District 5 ‐ Breakdown of All Offenses *The above CompStat figures were generated on Monday, 1 day(s) after the closing date, which is indicated in the title. The figures are current as of the date generated. Last 7 Days* Last 28 Days* Previous 28 Days* (Prior to Last 28 Days) Year to Date (YTD)* 3‐Year YTD Average* 5‐Year YTD Average* Volume 3 ‐‐ Number 31 **Averages greater than or equal to 100 are rounded to a whole digit to maintain a consistent column size. Report Covering the Week 07/31/2017 Through 08/06/2017 (Mon‐Sun) 0 1 2 3 4 5 6 7 Jul 10‐Jul 16 Jul 17‐Jul 23 Jul 24‐Jul 30 Jul 31‐Aug 06 Last 28 Day Breakdown by Week ‐ Part 1 Homicide Sex Assault Robbery‐Bus. Robbery‐Other Agg Aslt‐Family Agg Aslt‐NonFam Burg‐Res Burg‐All Other 1366 1683 1845 2008 2451 2539 2179 0 500 1000 1500 2000 2500 3000 2011 2012 2013 2014 2015 2016 2017 Year‐to‐Date Totals (Jan 1 through Aug 6) Homicide Sex Assault Robbery‐Bus. Robbery‐Other Agg Aslt‐Family Agg Aslt‐NonFam Burg‐Res Burg‐All Other Larc‐Veh Burg Larc‐All Other Vehicle Theft0 10 20 30 40 50 60 Jul 10‐Jul 16 Jul 17‐Jul 23 Jul 24‐Jul 30 Jul 31‐Aug 06 Last 28 Day Breakdown by Week ‐ Part 2 Vehicle Burglary Other Larceny Vehicle Theft Page 7 of 9
- 8. Salt Lake City Police Department 2017 2016 Chg % Chg 2017 2016 Chg % Chg 2017 Recent Chg Recent % Chg 2017 2016 % Chg Avg** % Chg Avg** % Chg Criminal Homicide 0 0 0 /0 1 0 1 /0 0 1 /0 1 0 /0 0.00 /0 0.00 /0 Sexual Assault 0 0 0 /0 0 0 0 /0 1 ‐1 ‐100.0% 2 7 ‐71.4% 7.67 ‐73.9% 7.60 ‐73.7% Robbery ‐ Business 0 0 0 /0 0 0 0 /0 1 ‐1 ‐100.0% 5 3 66.7% 4.33 15.4% 3.60 38.9% Robbery ‐ All Other 0 0 0 /0 1 0 1 /0 0 1 /0 2 2 0.0% 1.33 50.0% 1.60 25.0% Agg. Assault ‐ Family 1 0 1 /0 2 0 2 /0 1 1 100.0% 5 2 150.0% 1.67 200.0% 1.20 316.7% Agg. Assault ‐ NonFamily 0 0 0 /0 0 1 ‐1 ‐100.0% 3 ‐3 ‐100.0% 6 3 100.0% 3.67 63.6% 5.20 15.4% Burglary ‐ Residential 3 2 1 50.0% 6 8 ‐2 ‐25.0% 9 ‐3 ‐33.3% 58 56 3.6% 51.67 12.3% 48.00 20.8% Burglary ‐ All Other 0 0 0 /0 1 2 ‐1 ‐50.0% 6 ‐5 ‐83.3% 26 15 73.3% 12.33 110.8% 15.20 71.1% Larceny ‐ Vehicle Burglary 5 6 ‐1 ‐16.7% 23 23 0 0.0% 30 ‐7 ‐23.3% 190 219 ‐13.2% 202 ‐6.1% 199 ‐4.5% Larceny ‐ All Other 4 5 ‐1 ‐20.0% 20 15 5 33.3% 18 2 11.1% 138 107 29.0% 115 20.3% 113 21.9% Motor Vehicle Theft 3 1 2 200.0% 8 5 3 60.0% 7 1 14.3% 45 37 21.6% 43.67 3.1% 49.20 ‐8.5% TOTAL 16 14 2 14.3% 62 54 8 14.8% 76 ‐14 ‐18.4% 478 451 6.0% 443 7.8% 444 7.7% Jul 10‐ Jul 17‐J Jul 24‐JJul 31‐Aug 2011 2012 2013 2014 2015 2016 2017 Homicide 1 0 0 0 0 0 0 0 0 0 1 Sex Assault 0 0 0 0 4 8 7 9 7 7 2 Robbery ‐ Business 0 0 0 0 3 2 3 6 4 3 5 Robbery ‐ All Other 0 1 0 0 4 2 2 0 2 2 2 Aggravated Assault ‐ Family 0 1 0 1 3 0 1 1 2 2 5 Aggravated Assault ‐ All Other 0 0 0 0 5 10 5 2 6 3 6 Burglary ‐ Residential 0 3 0 3 48 37 48 44 55 56 58 Burglary ‐ All Other 1 0 0 0 24 12 27 11 11 15 26 Larceny ‐ Vehicle Burglary 9 2 7 5 297 189 199 163 225 219 190 Larceny ‐ All Other 4 8 4 4 115 116 106 116 121 107 138 Vehicle Theft 2 2 1 3 44 60 55 40 54 37 45 TOTALS 17 17 12 16 547 436 453 392 487 451 478 Year‐to‐Date Totals (Jan 1 through Aug 6) Note: Charts may erroneously show an apparent drop in the most current data due to some cases not yet having been reported and/or recorded. The figures included in this report are preliminary figures for general situational awareness and trend purposes only. They do not represent the official figures of the Salt Lake City Police Department and are subject to further analysis and revision. Due to the statute‐driven, changing nature of crime classification and area boundaries over time, be advised that the figures contained may not fully coincide with SLCPD statistical sources. Differences are reflective of the departmental procedures or policies that were in place at the time the events occurred and the date the data was compiled. In addition, data may be approximate in relation to indicated areas. Additionally, they are not Uniform Crime Reporting (UCR) or "crime rate" numbers and are not intended to be used as such. Rather, they are a breakdown of every offense within every case that occurred during the given time periods. Although every reasonable effort is made to verify their accuracy, the accuracy of any data is subject to the constraints of the report generation process as well as the manner, format, and point in time of any query. CompStat Report……. Council District 6 ‐ Breakdown of All Offenses *The above CompStat figures were generated on Monday, 1 day(s) after the closing date, which is indicated in the title. The figures are current as of the date generated. Last 7 Days* Last 28 Days* Previous 28 Days* (Prior to Last 28 Days) Year to Date (YTD)* 3‐Year YTD Average* 5‐Year YTD Average* Volume 3 ‐‐ Number 31 **Averages greater than or equal to 100 are rounded to a whole digit to maintain a consistent column size. Report Covering the Week 07/31/2017 Through 08/06/2017 (Mon‐Sun) 0 1 2 3 4 Jul 10‐Jul 16 Jul 17‐Jul 23 Jul 24‐Jul 30 Jul 31‐Aug 06 Last 28 Day Breakdown by Week ‐ Part 1 Homicide Sex Assault Robbery‐Bus. Robbery‐Other Agg Aslt‐Family Agg Aslt‐NonFam Burg‐Res Burg‐All Other 547 436 453 392 487 451 478 0 100 200 300 400 500 600 2011 2012 2013 2014 2015 2016 2017 Year‐to‐Date Totals (Jan 1 through Aug 6) Homicide Sex Assault Robbery‐Bus. Robbery‐Other Agg Aslt‐Family Agg Aslt‐NonFam Burg‐Res Burg‐All Other Larc‐Veh Burg Larc‐All Other Vehicle Theft0 1 2 3 4 5 6 7 8 9 10 Jul 10‐Jul 16 Jul 17‐Jul 23 Jul 24‐Jul 30 Jul 31‐Aug 06 Last 28 Day Breakdown by Week ‐ Part 2 Vehicle Burglary Other Larceny Vehicle Theft Page 8 of 9
- 9. Salt Lake City Police Department 2017 2016 Chg % Chg 2017 2016 Chg % Chg 2017 Recent Chg Recent % Chg 2017 2016 % Chg Avg** % Chg Avg** % Chg Criminal Homicide 0 0 0 /0 0 0 0 /0 0 0 /0 0 0 /0 0.33 ‐100.0% 0.20 ‐100.0% Sexual Assault 2 0 2 /0 4 0 4 /0 2 2 100.0% 15 11 36.4% 12.33 21.6% 13.60 10.3% Robbery ‐ Business 0 0 0 /0 1 0 1 /0 3 ‐2 ‐66.7% 8 21 ‐61.9% 17.00 ‐52.9% 14.20 ‐43.7% Robbery ‐ All Other 1 0 1 /0 3 1 2 200.0% 1 2 200.0% 11 13 ‐15.4% 8.33 32.0% 9.20 19.6% Agg. Assault ‐ Family 0 0 0 /0 0 1 ‐1 ‐100.0% 2 ‐2 ‐100.0% 2 6 ‐66.7% 8.00 ‐75.0% 8.40 ‐76.2% Agg. Assault ‐ NonFamily 0 2 ‐2 ‐100.0% 1 5 ‐4 ‐80.0% 0 1 /0 8 19 ‐57.9% 22.00 ‐63.6% 23.80 ‐66.4% Burglary ‐ Residential 2 3 ‐1 ‐33.3% 9 9 0 0.0% 13 ‐4 ‐30.8% 70 78 ‐10.3% 82.67 ‐15.3% 80.80 ‐13.4% Burglary ‐ All Other 1 2 ‐1 ‐50.0% 6 3 3 100.0% 4 2 50.0% 60 69 ‐13.0% 49.67 20.8% 51.60 16.3% Larceny ‐ Vehicle Burglary 7 7 0 0.0% 40 47 ‐7 ‐14.9% 55 ‐15 ‐27.3% 350 426 ‐17.8% 415 ‐15.6% 380 ‐7.9% Larceny ‐ All Other 13 19 ‐6 ‐31.6% 64 94 ‐30 ‐31.9% 88 ‐24 ‐27.3% 600 594 1.0% 616 ‐2.5% 568 5.6% Motor Vehicle Theft 5 3 2 66.7% 19 11 8 72.7% 13 6 46.2% 107 106 0.9% 112 ‐4.5% 112 ‐4.5% TOTAL 31 36 ‐5 ‐13.9% 147 171 ‐24 ‐14.0% 181 ‐34 ‐18.8% 1,231 1,343 ‐8.3% 1343 ‐8.3% 1262 ‐2.5% Jul 10‐ Jul 17‐J Jul 24‐JJul 31‐Aug 2011 2012 2013 2014 2015 2016 2017 Homicide 0 0 0 0 1 0 0 0 1 0 0 Sex Assault 1 0 1 2 7 14 17 10 16 11 15 Robbery ‐ Business 0 1 0 0 5 4 16 14 16 21 8 Robbery ‐ All Other 0 2 0 1 10 13 8 4 8 13 11 Aggravated Assault ‐ Family 0 0 0 0 3 10 8 6 12 6 2 Aggravated Assault ‐ All Other 0 1 0 0 25 26 27 21 26 19 8 Burglary ‐ Residential 0 2 5 2 67 74 82 72 98 78 70 Burglary ‐ All Other 2 1 2 1 34 70 39 41 39 69 60 Larceny ‐ Vehicle Burglary 11 10 12 7 320 354 302 331 487 426 350 Larceny ‐ All Other 19 12 20 13 437 443 552 614 639 594 600 Vehicle Theft 1 7 6 5 68 109 115 106 124 106 107 TOTALS 34 36 46 31 977 1117 1166 1219 1466 1343 1231 Year‐to‐Date Totals (Jan 1 through Aug 6) Note: Charts may erroneously show an apparent drop in the most current data due to some cases not yet having been reported and/or recorded. The figures included in this report are preliminary figures for general situational awareness and trend purposes only. They do not represent the official figures of the Salt Lake City Police Department and are subject to further analysis and revision. Due to the statute‐driven, changing nature of crime classification and area boundaries over time, be advised that the figures contained may not fully coincide with SLCPD statistical sources. Differences are reflective of the departmental procedures or policies that were in place at the time the events occurred and the date the data was compiled. In addition, data may be approximate in relation to indicated areas. Additionally, they are not Uniform Crime Reporting (UCR) or "crime rate" numbers and are not intended to be used as such. Rather, they are a breakdown of every offense within every case that occurred during the given time periods. Although every reasonable effort is made to verify their accuracy, the accuracy of any data is subject to the constraints of the report generation process as well as the manner, format, and point in time of any query. *The above CompStat figures were generated on Monday, 1 day(s) after the closing date, which is indicated in the title. The figures are current as of the date generated. CompStat Report……. Council District 7 ‐ Breakdown of All Offenses Volume 3 ‐‐ Number 31 Last 7 Days* Last 28 Days* Previous 28 Days* (Prior to Last 28 Days) Year to Date (YTD)* 3‐Year YTD Average* 5‐Year YTD Average* **Averages greater than or equal to 100 are rounded to a whole digit to maintain a consistent column size. Report Covering the Week 07/31/2017 Through 08/06/2017 (Mon‐Sun) 0 1 2 3 4 5 6 Jul 10‐Jul 16 Jul 17‐Jul 23 Jul 24‐Jul 30 Jul 31‐Aug 06 Last 28 Day Breakdown by Week ‐ Part 1 Homicide Sex Assault Robbery‐Bus. Robbery‐Other Agg Aslt‐Family Agg Aslt‐NonFam Burg‐Res Burg‐All Other 977 1117 1166 1219 1466 1343 1231 0 200 400 600 800 1000 1200 1400 1600 2011 2012 2013 2014 2015 2016 2017 Year‐to‐Date Totals (Jan 1 through Aug 6) Homicide Sex Assault Robbery‐Bus. Robbery‐Other Agg Aslt‐Family Agg Aslt‐NonFam Burg‐Res Burg‐All Other Larc‐Veh Burg Larc‐All Other Vehicle Theft0 5 10 15 20 25 Jul 10‐Jul 16 Jul 17‐Jul 23 Jul 24‐Jul 30 Jul 31‐Aug 06 Last 28 Day Breakdown by Week ‐ Part 2 Vehicle Burglary Other Larceny Vehicle Theft Page 9 of 9