18 01-14-comp stat
•
0 likes•15 views

18-01-14- SLCPD Compstat for District 5

Recommended
More Related Content
What's hot
Similar to 18 01-14-comp stat
Similar to 18 01-14-comp stat (20)
More from ELPCO East Liberty Park Comm. Organization
More from ELPCO East Liberty Park Comm. Organization (20)
Recently uploaded
Recently uploaded (20)
18 01-14-comp stat
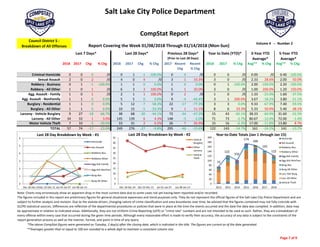
- 1. Salt Lake City Police Department 2018 2017 Chg % Chg 2018 2017 Chg % Chg 2017 Recent Chg Recent % Chg 2018 2017 % Chg Avg** % Chg Avg** % Chg Criminal Homicide 0 0 0 /0 0 1 ‐1 ‐100.0% 0 0 /0 0 0 /0 0.00 /0 0.40 ‐100.0% Sexual Assault 2 0 2 /0 4 0 4 /0 3 1 33.3% 3 0 /0 2.33 28.6% 2.00 50.0% Robbery ‐ Business 0 1 ‐1 ‐100.0% 1 1 0 0.0% 1 0 0.0% 0 1 ‐100.0% 2.00 ‐100.0% 2.20 ‐100.0% Robbery ‐ All Other 1 0 1 /0 6 3 3 100.0% 5 1 20.0% 3 0 /0 1.00 200.0% 1.20 150.0% Agg. Assault ‐ Family 1 0 1 /0 2 1 1 100.0% 0 2 /0 1 0 /0 1.33 ‐25.0% 1.60 ‐37.5% Agg. Assault ‐ NonFamily 1 1 0 0.0% 5 5 0 0.0% 9 ‐4 ‐44.4% 3 1 200.0% 3.67 ‐18.2% 3.80 ‐21.1% Burglary ‐ Residential 1 1 0 0.0% 5 12 ‐7 ‐58.3% 22 ‐17 ‐77.3% 3 3 0.0% 9.33 ‐67.9% 7.40 ‐59.5% Burglary ‐ All Other 1 1 0 0.0% 10 15 ‐5 ‐33.3% 9 1 11.1% 8 6 33.3% 5.33 50.0% 5.40 48.1% Larceny ‐ Vehicle Burglary 9 27 ‐18 ‐66.7% 38 68 ‐30 ‐44.1% 72 ‐34 ‐47.2% 15 43 ‐65.1% 38.33 ‐60.9% 31.60 ‐52.5% Larceny ‐ All Other 34 33 1 3.0% 145 139 6 4.3% 148 ‐3 ‐2.0% 71 73 ‐2.7% 80.67 ‐12.0% 72.00 ‐1.4% Motor Vehicle Theft 7 10 ‐3 ‐30.0% 33 31 2 6.5% 26 7 26.9% 15 16 ‐6.3% 17.00 ‐11.8% 13.80 8.7% TOTAL 57 74 ‐17 ‐23.0% 249 276 ‐27 ‐9.8% 295 ‐46 ‐15.6% 122 143 ‐14.7% 161 ‐24.2% 141 ‐13.7% Dec 18Dec 25‐Jan 01‐Jan 08‐Jan 2012 2013 2014 2015 2016 2017 2018 Homicide 0 0 0 0 0 2 0 0 0 0 0 Sex Assault 0 1 1 2 1 0 3 2 5 0 3 Robbery ‐ Business 0 1 0 0 0 5 0 1 4 1 0 Robbery ‐ All Other 0 3 2 1 1 2 1 0 3 0 3 Aggravated Assault ‐ Family 0 1 0 1 0 2 2 2 2 0 1 Aggravated Assault ‐ All Other 1 1 2 1 4 2 6 6 4 1 3 Burglary ‐ Residential 1 1 2 1 4 5 4 10 15 3 3 Burglary ‐ All Other 1 3 5 1 3 8 3 8 2 6 8 Larceny ‐ Vehicle Burglary 11 13 5 9 12 19 24 38 34 43 15 Larceny ‐ All Other 42 32 37 34 45 68 50 91 78 73 71 Vehicle Theft 7 13 6 7 5 9 9 16 19 16 15 TOTALS 63 69 60 57 75 122 102 174 166 143 122 Year‐to‐Date Totals (Jan 1 through Jan 15) Note: Charts may erroneously show an apparent drop in the most current data due to some cases not yet having been reported and/or recorded. The figures included in this report are preliminary figures for general situational awareness and trend purposes only. They do not represent the official figures of the Salt Lake City Police Department and are subject to further analysis and revision. Due to the statute‐driven, changing nature of crime classification and area boundaries over time, be advised that the figures contained may not fully coincide with SLCPD statistical sources. Differences are reflective of the departmental procedures or policies that were in place at the time the events occurred and the date the data was compiled. In addition, data may be approximate in relation to indicated areas. Additionally, they are not Uniform Crime Reporting (UCR) or "crime rate" numbers and are not intended to be used as such. Rather, they are a breakdown of every offense within every case that occurred during the given time periods. Although every reasonable effort is made to verify their accuracy, the accuracy of any data is subject to the constraints of the report generation process as well as the manner, format, and point in time of any query. CompStat Report……. Council District 5 ‐ Breakdown of All Offenses *The above CompStat figures were generated on Tuesday, 2 day(s) after the closing date, which is indicated in the title. The figures are current as of the date generated. Last 7 Days* Last 28 Days* Previous 28 Days* (Prior to Last 28 Days) Year to Date (YTD)* 3‐Year YTD Average* 5‐Year YTD Average* Volume 4 ‐‐ Number 2 **Averages greater than or equal to 100 are rounded to a whole digit to maintain a consistent column size. Report Covering the Week 01/08/2018 Through 01/14/2018 (Mon‐Sun) 0 1 2 3 4 5 6 Dec 18‐Dec 24Dec 25‐Dec 31 Jan 01‐Jan 07 Jan 08‐Jan 14 Last 28 Day Breakdown by Week ‐ #1 Homicide Sex Assault Robbery‐Bus. Robbery‐Other Agg Aslt‐Family Agg Aslt‐NonFam Burg‐Res Burg‐All Other 75 122 102 174 166 143 122 0 20 40 60 80 100 120 140 160 180 200 2012 2013 2014 2015 2016 2017 2018 Year‐to‐Date Totals (Jan 1 through Jan 15) Homicide Sex Assault Robbery‐Bus. Robbery‐Other Agg Aslt‐Family Agg Aslt‐NonFam Burg‐Res Burg‐All Other Larc‐Veh Burg Larc‐All Other Vehicle Theft0 5 10 15 20 25 30 35 40 45 Dec 18‐Dec 24 Dec 25‐Dec 31 Jan 01‐Jan 07 Jan 08‐Jan 14 Last 28 Day Breakdown by Week ‐ #2 Vehicle Burglary Other Larceny Vehicle Theft Page 7 of 9