
Recommended
More Related Content
What's hot
What's hot (20)
Viewers also liked
Viewers also liked (20)
Similar to Systems of Inequalities
Similar to Systems of Inequalities (20)
More from swartzje
More from swartzje (20)
Recently uploaded
Recently uploaded (20)
Systems of Inequalities
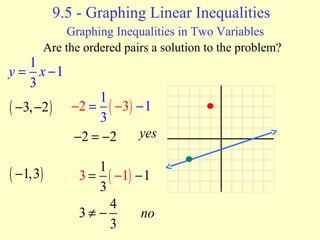
- 1. 9.5 - Graphing Linear Inequalities Graphing Inequalities in Two Variables Are the ordered pairs a solution to the problem? 1 1 3 y = x - ( -3,-2) ( -1,3) 1 ( ) 1 3 -2 = -3 - yes 3 = 1 ( - 1) - 1 no · · -2 = -2 3 3 4 3 ¹ -
- 2. 9.5 - Graphing Linear Inequalities Graphing Inequalities in Two Variables Are the ordered pairs a solution to the problem? 1 1 3 y = x - ( 3,0) ( 4,-3) 0 1 ( ) 1 yes 3 1 ( 4) 1 no · · · · = 3 - 3 0 = 0 - = - 3 3 1 3 - ¹
- 3. 9.5 - Graphing Linear Inequalities Graphing Inequalities in Two Variables Are the ordered pairs a solution to the problem? 1 1 3 y > x - ( -3,-2) ( -1,3) ( 3,0) yes yes ( 4,-3) -2 > -2 3 4 > - 0 > 0 3 1 3 3 - > · · · no no no no yes .
- 4. 9.5 - Graphing LinearInequalities Graphing Inequalities in Two Variables Graph the solution. 1 1 4 y ³ x - (1,-4) ( 2,2) 4 3 4 - ³ - 2 1 ³ - · 2 · no yes
- 5. 9.5 - Graphing Linear Inequalities Graphing Inequalities in Two Variables Graph the solution. 3x + 2y £ 10 ( 4,3) ( 0,0) 3 £ -1 0 £ 5 · 3 5 2 y £ - x + no · yes
- 6. 9.5 - Graphing Linear Inequalities Graphing Inequalities in Two Variables Graph the solution. y < 3x ( -2,2) ( 3,3) 2 < -6 3 < 9 · · no yes
- 7. 9.5 - Graphing Linear Inequalities Graphing Inequalities in Two Variables Graph the solution. -3x +5y +15 ³0 ( 0,0) ( 2,-3) · · yes no 3 y ³ 3 x - 5 0 ³-3 -3 ³4 4 5
- 8. 4.5 – Systems of Linear Inequalities Graphing Inequalities in Two Variables Graph the Union. ïî ïí ì 2 y x ³ - £ - + 1 2 3 y x
- 9. 4.5 – Systems of Linear Inequalities Graphing Inequalities in Two Variables Graph the solution (Graph the intersection). ïî ïí ì 2 y x ³ - £ - + 1 2 3 y x
- 10. 4.5 – Systems of Linear Inequalities Graphing Inequalities in Two Variables Graph the union. ïî ïí ì 1 x y x < - - ³ - 2 2 2
- 11. 4.5 – Systems of Linear Inequalities Graphing Inequalities in Two Variables Graph the solution. (Graph the intersection) ïî ïí ì 1 x y x < - - ³ - 2 2 2
- 12. 4.5 – Systems of Linear Inequalities Graphing Inequalities in Two Variables Graph the solution. (Graph the intersection) î í ì y x + + > 2 3 0 x y - + < 3 9 ìy > -2x -3 ïî ïí 3 y < 1 x + 3
- 13. Graph the following linear system of inequalities. y ³ 2 x - 4 y < - 3 x + 2 x y Use the slope and y-intercept to plot two points for the first inequality. Draw in the line. For ³ use a solid line. Pick a point and test it in the inequality. Shade the appropriate region.
- 14. Graph the following linear system of inequalities. y ³ 2 x - 4 y < - 3 x + 2 y ³ x - ³ ³ 2 4 P o i n t ( 0 , 0 ) 0 2 ( 0 ) - 4 0 - 4 The region above the line should be shaded. x y Now do the same for the second inequality.
- 15. Graph the following linear system of inequalities. y ³ 2 x - 4 y < - 3 x + 2 x y y < - x + ³ - 3 2 3 P o i n t ( - 2 , - 2 ) - 2 ( - 2 ) + 2 - 2 < 8 The region below the line should be shaded.
- 16. Graph the following linear system of inequalities. y ³ 2 x - 4 y < - 3 x + 2 x y The solution to this system of inequalities is the region where the solutions to each inequality overlap. This is the region above or to the left of the green line and below or to the left of the blue line. Shade in that region.
- 17. YYoouu TTrryy OOnnee!! 1. Graph the following linear systems of inequalities. y > –x +4 y > x –2
- 18. y x y x 4 2 > - + > - y Use the slope and y-intercept x to plot two points for the first inequality. Draw in the line. Shade in the appropriate region.
- 19. x y y x y x 4 2 > - + > - Use the slope and y-intercept to plot two points for the second inequality. Draw in the line. Shade in the appropriate region.
- 20. x y y x y x 4 2 > - + > - The final solution is the region where the two shaded areas overlap (purple region).