
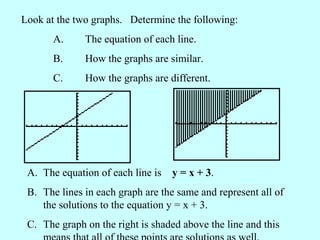


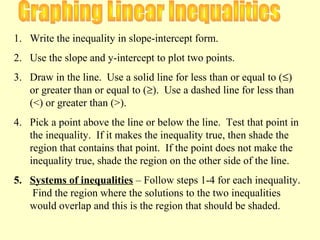
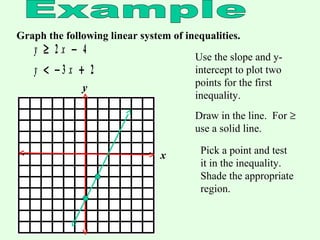
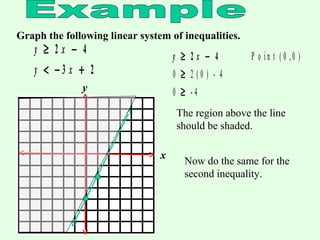
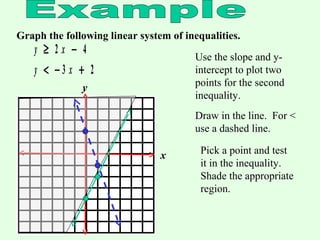
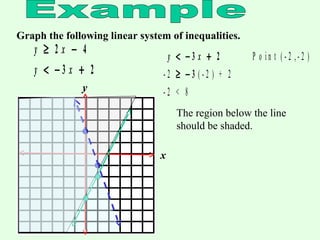
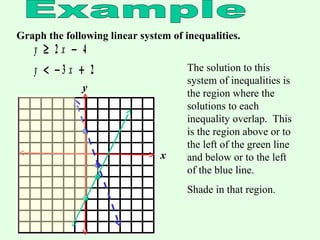

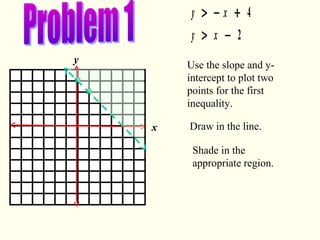
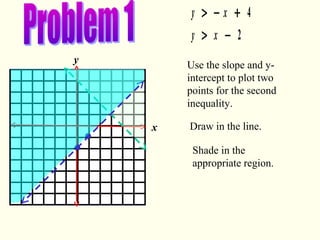


The document discusses graphing linear inequalities and systems of linear inequalities. It provides steps for graphing a single inequality, which include writing the inequality in slope-intercept form, plotting points, drawing the line, choosing a test point, and shading the correct region. For systems of inequalities, the steps are to graph each inequality individually and then shade where the regions overlap. Worked examples demonstrate how to graph y ≥ -2x + 4 and y < -3x + 6 and find their common region.


![7.9 notes[1]](https://cdn.slidesharecdn.com/ss_thumbnails/7-9notes1-130121125633-phpapp02-thumbnail.jpg?width=640&height=640&fit=bounds)


