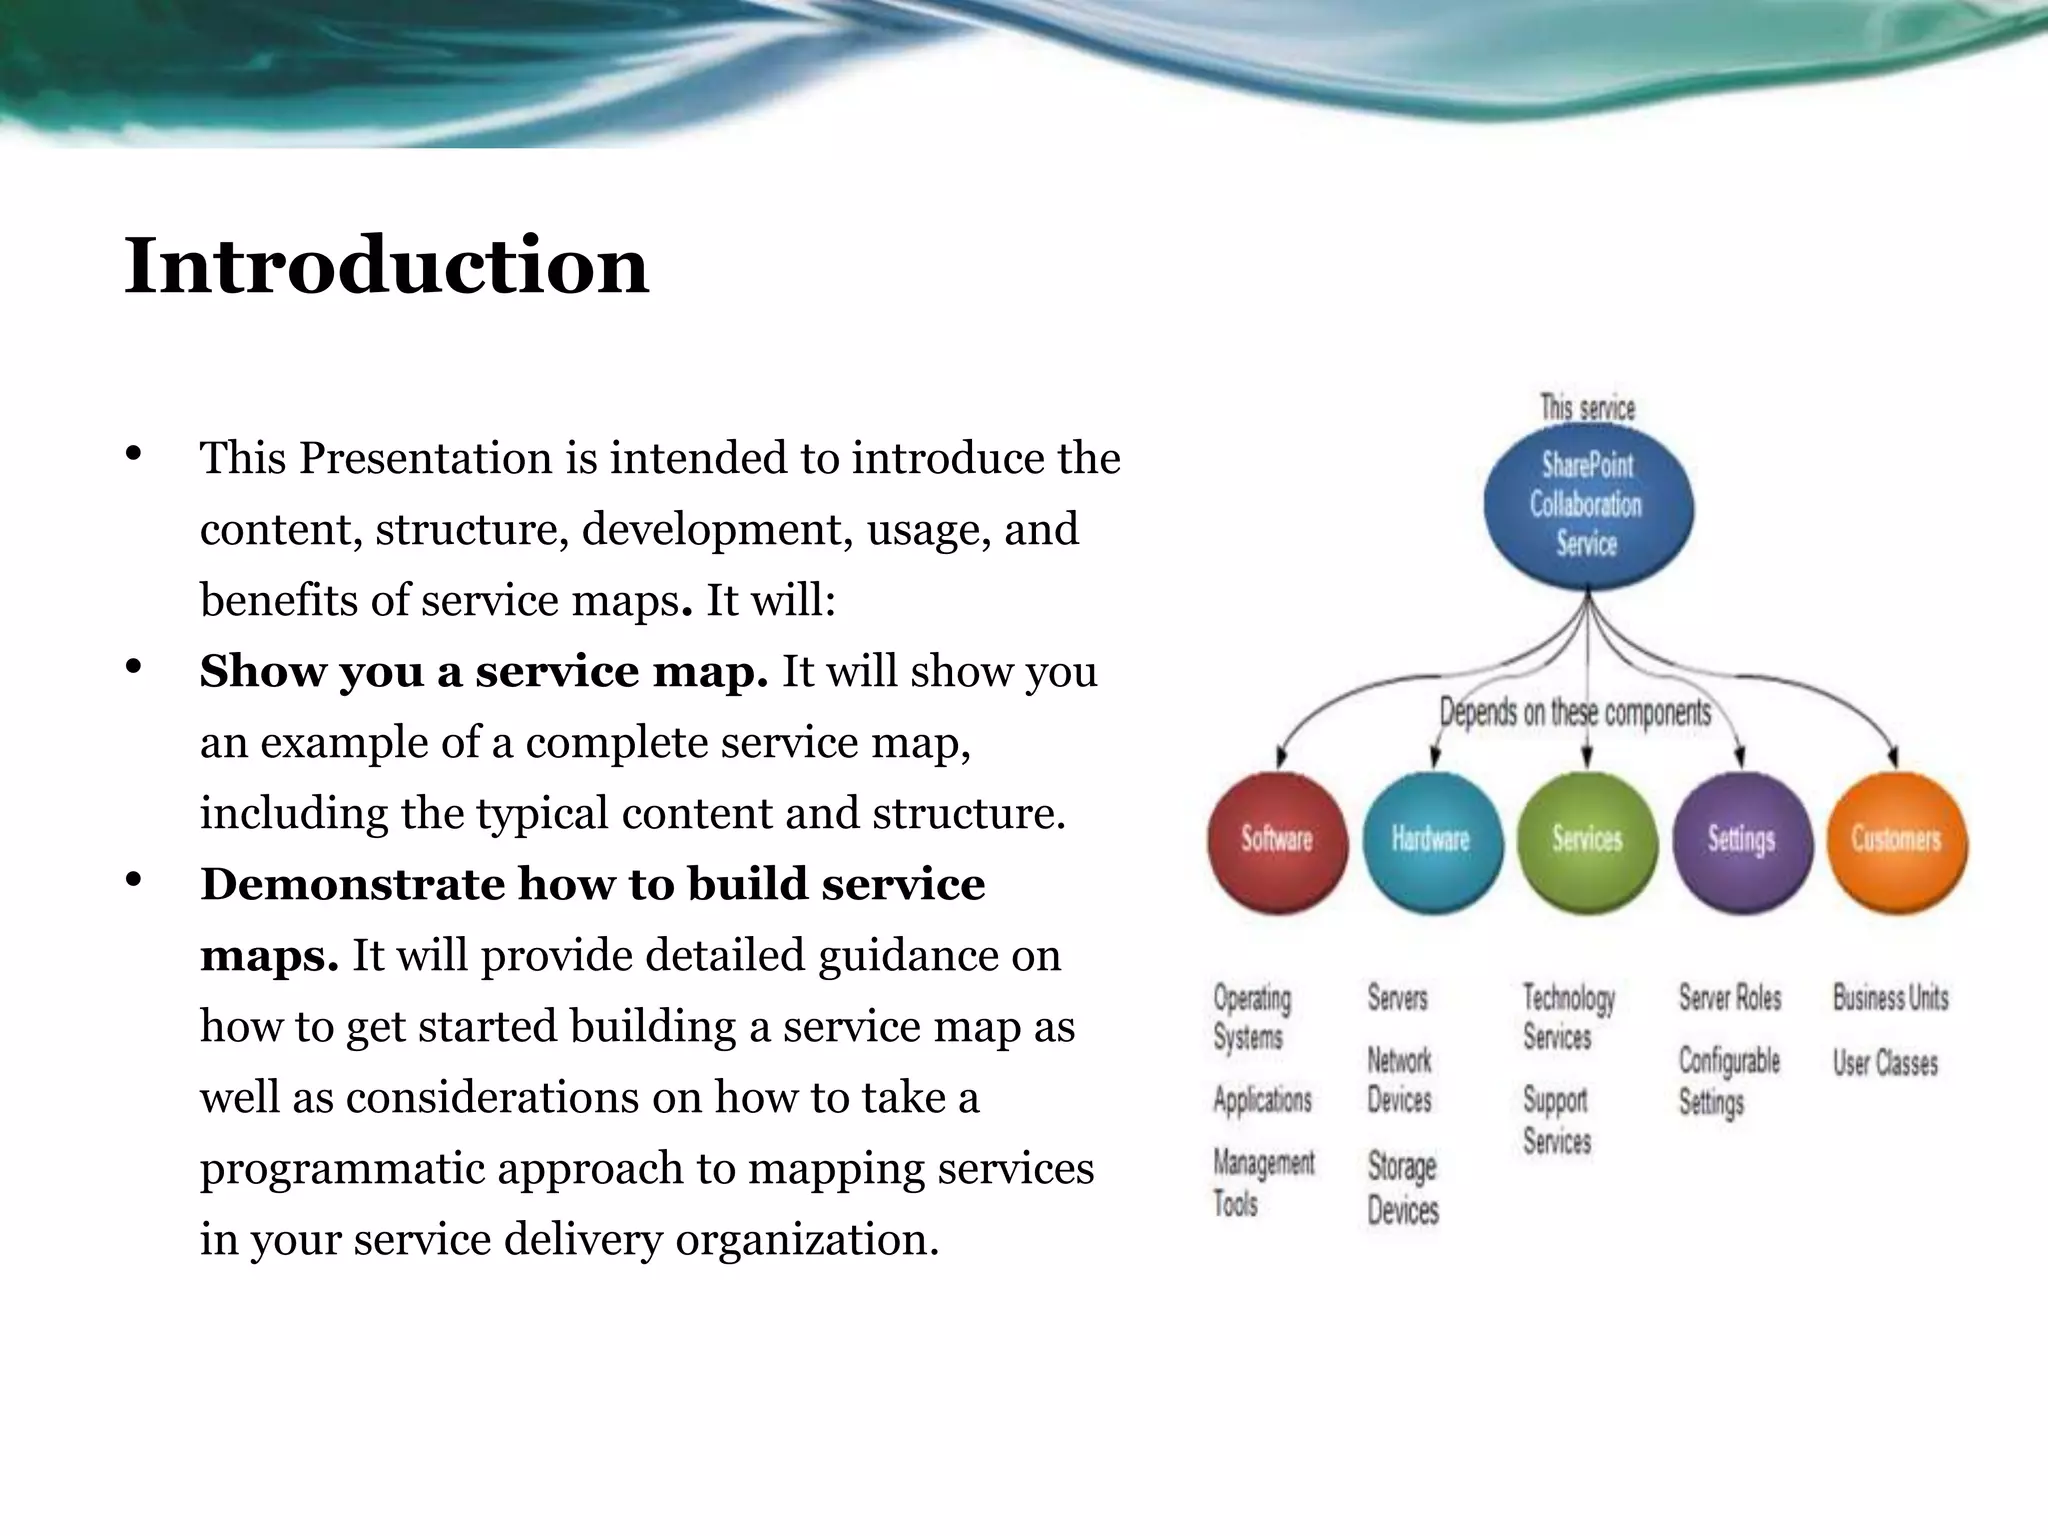
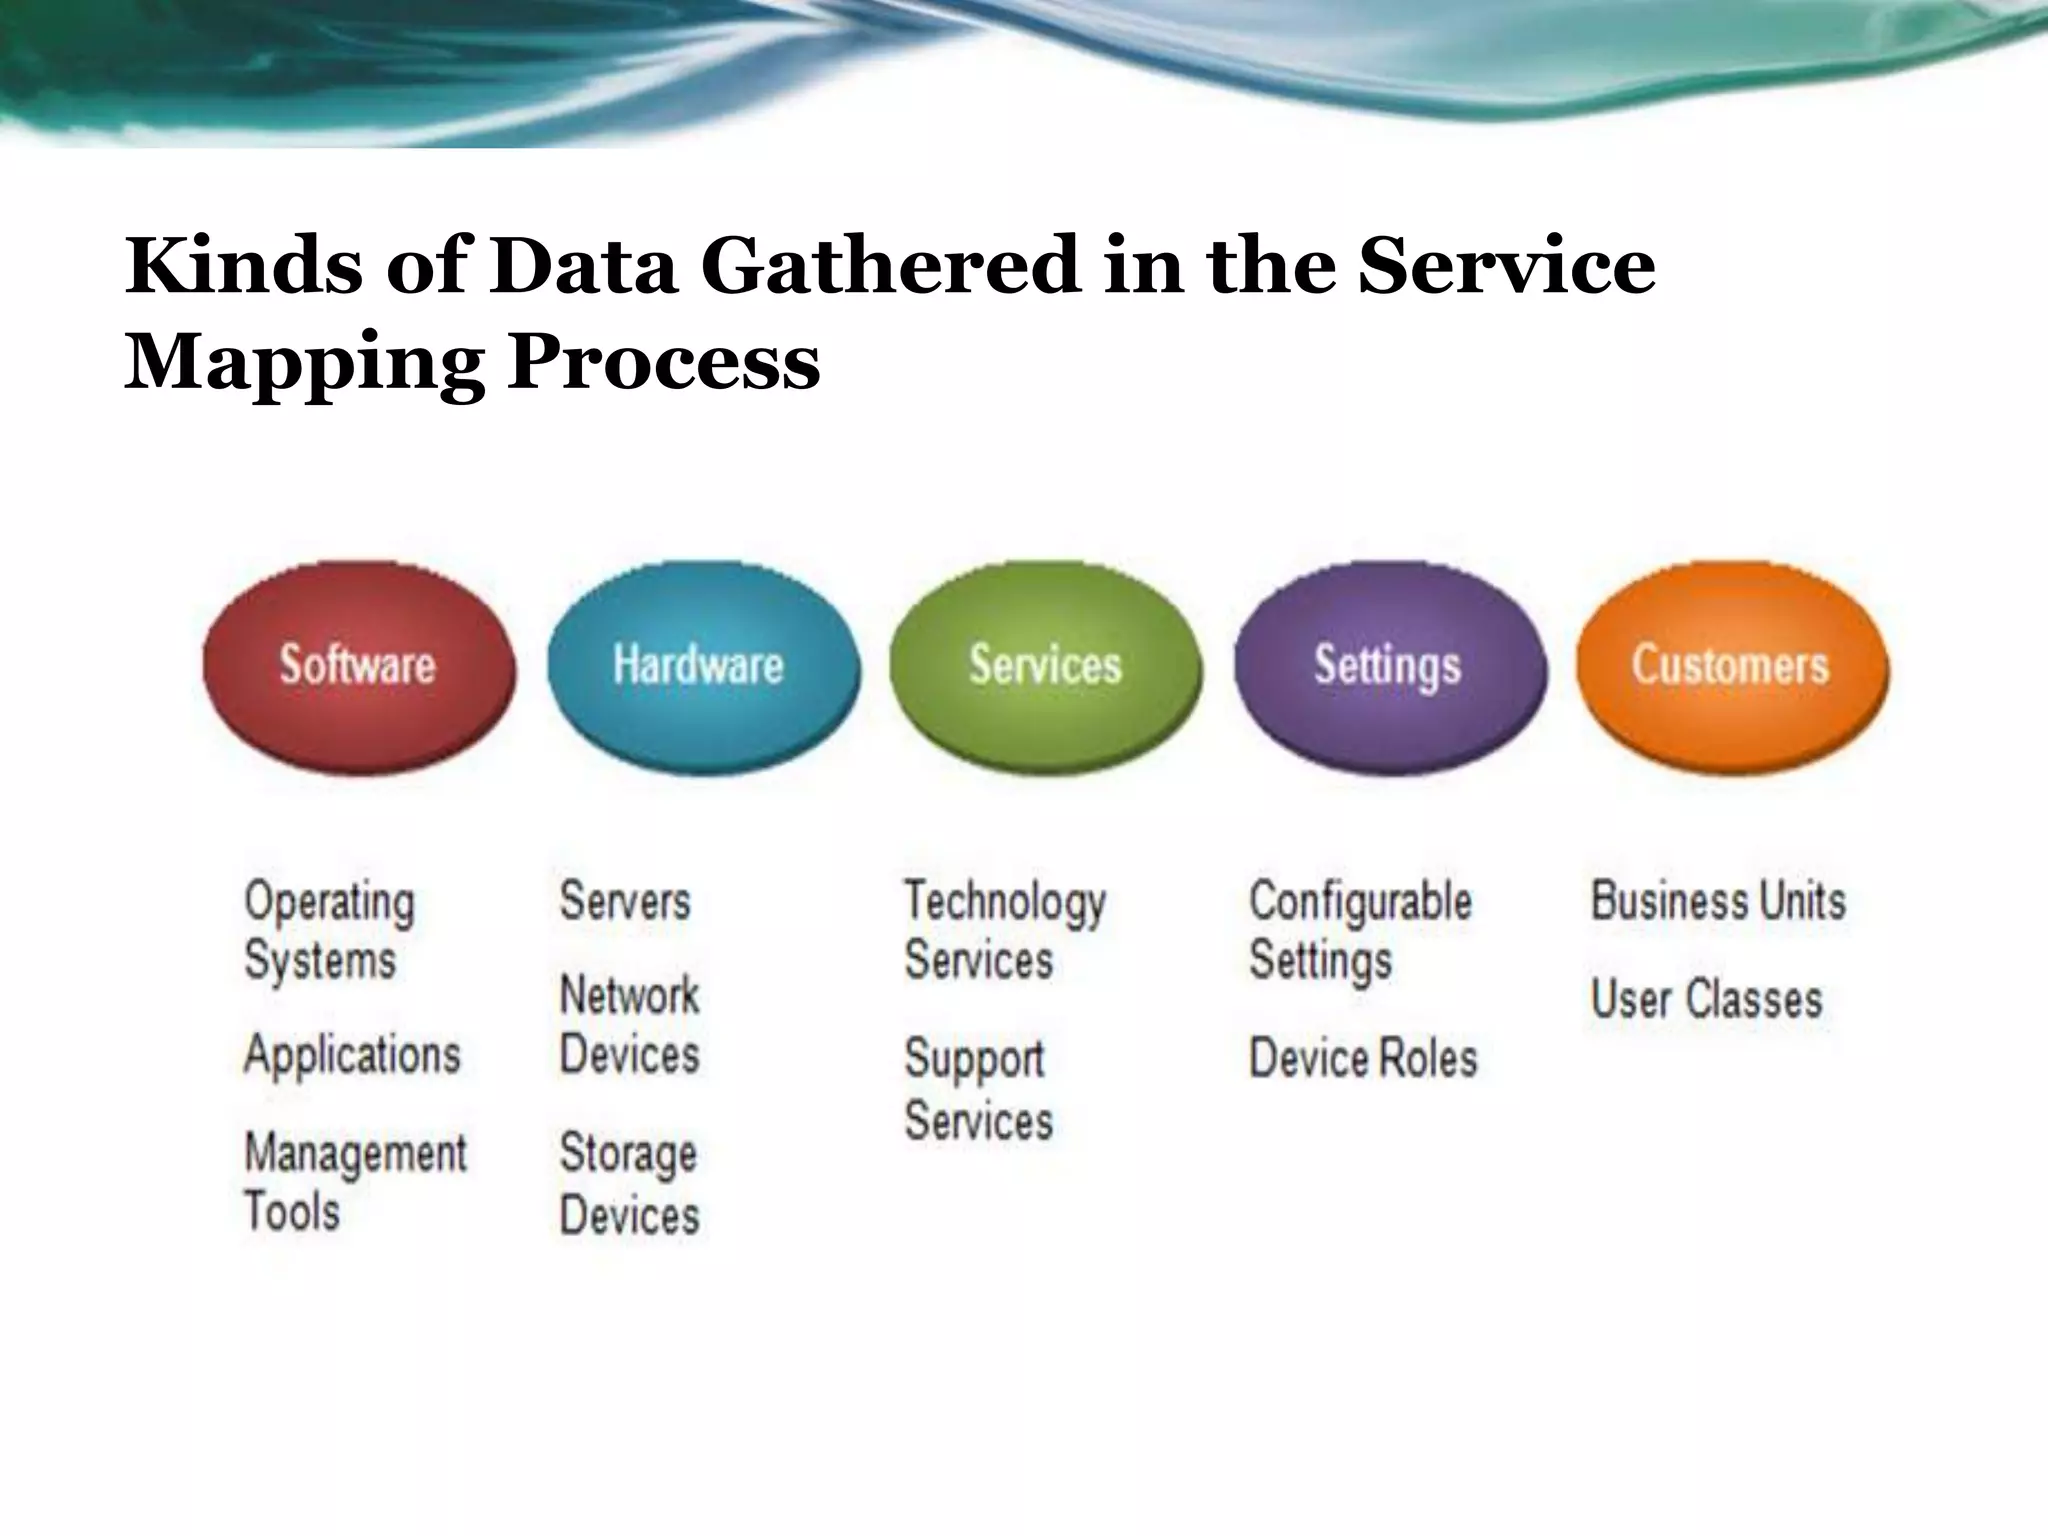
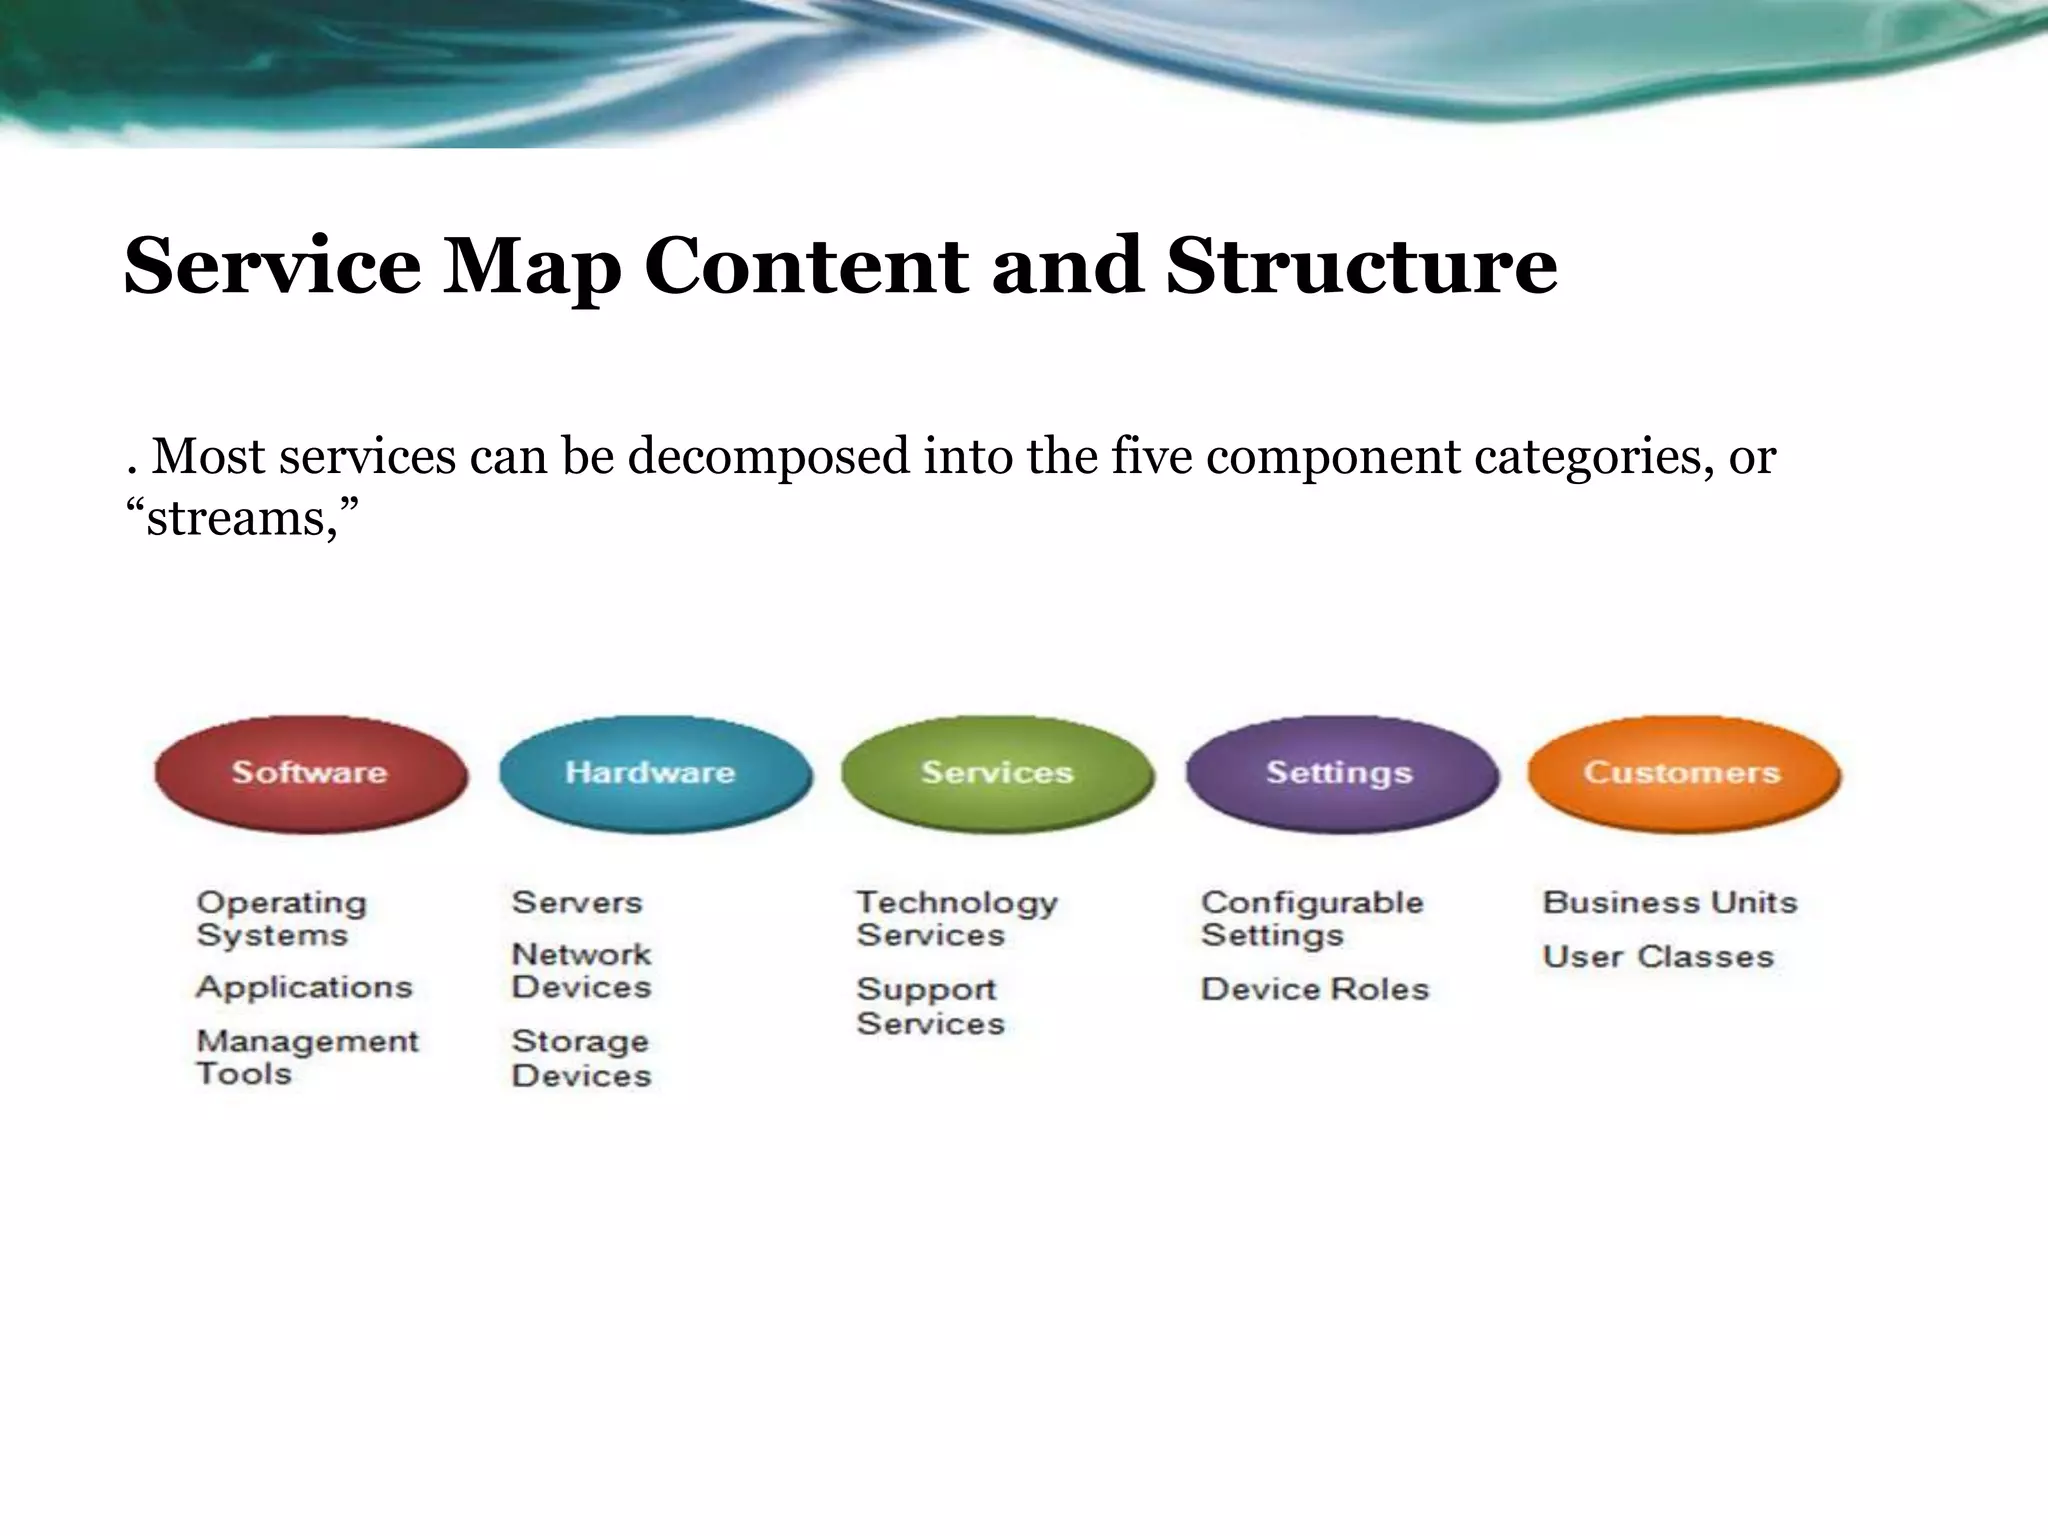
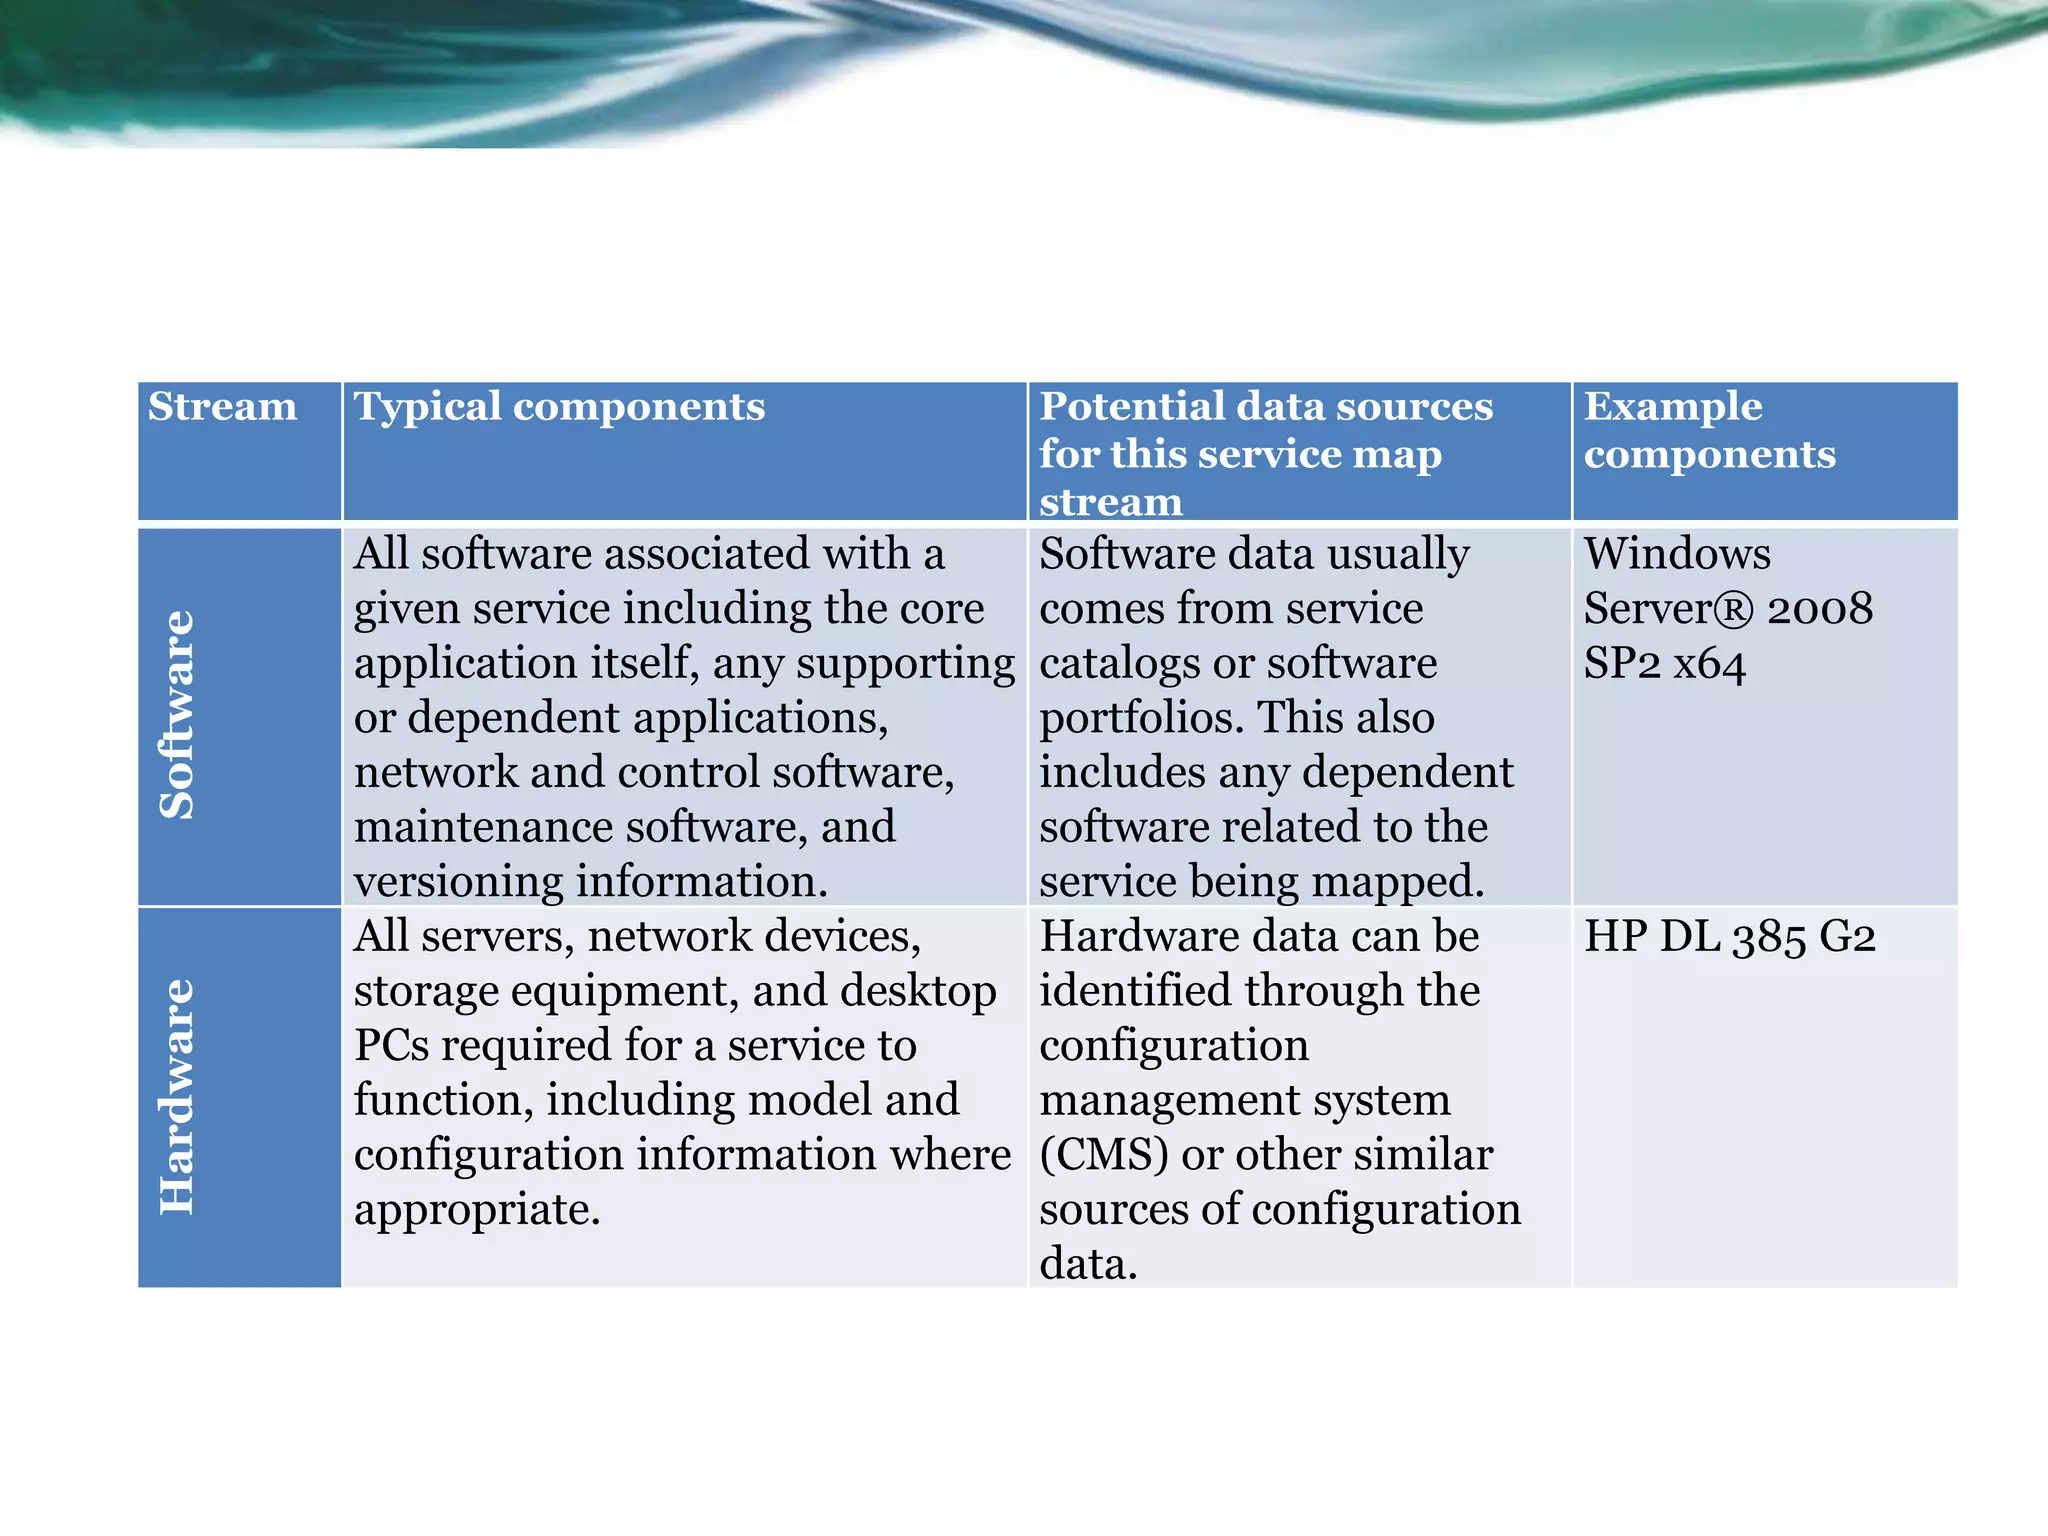
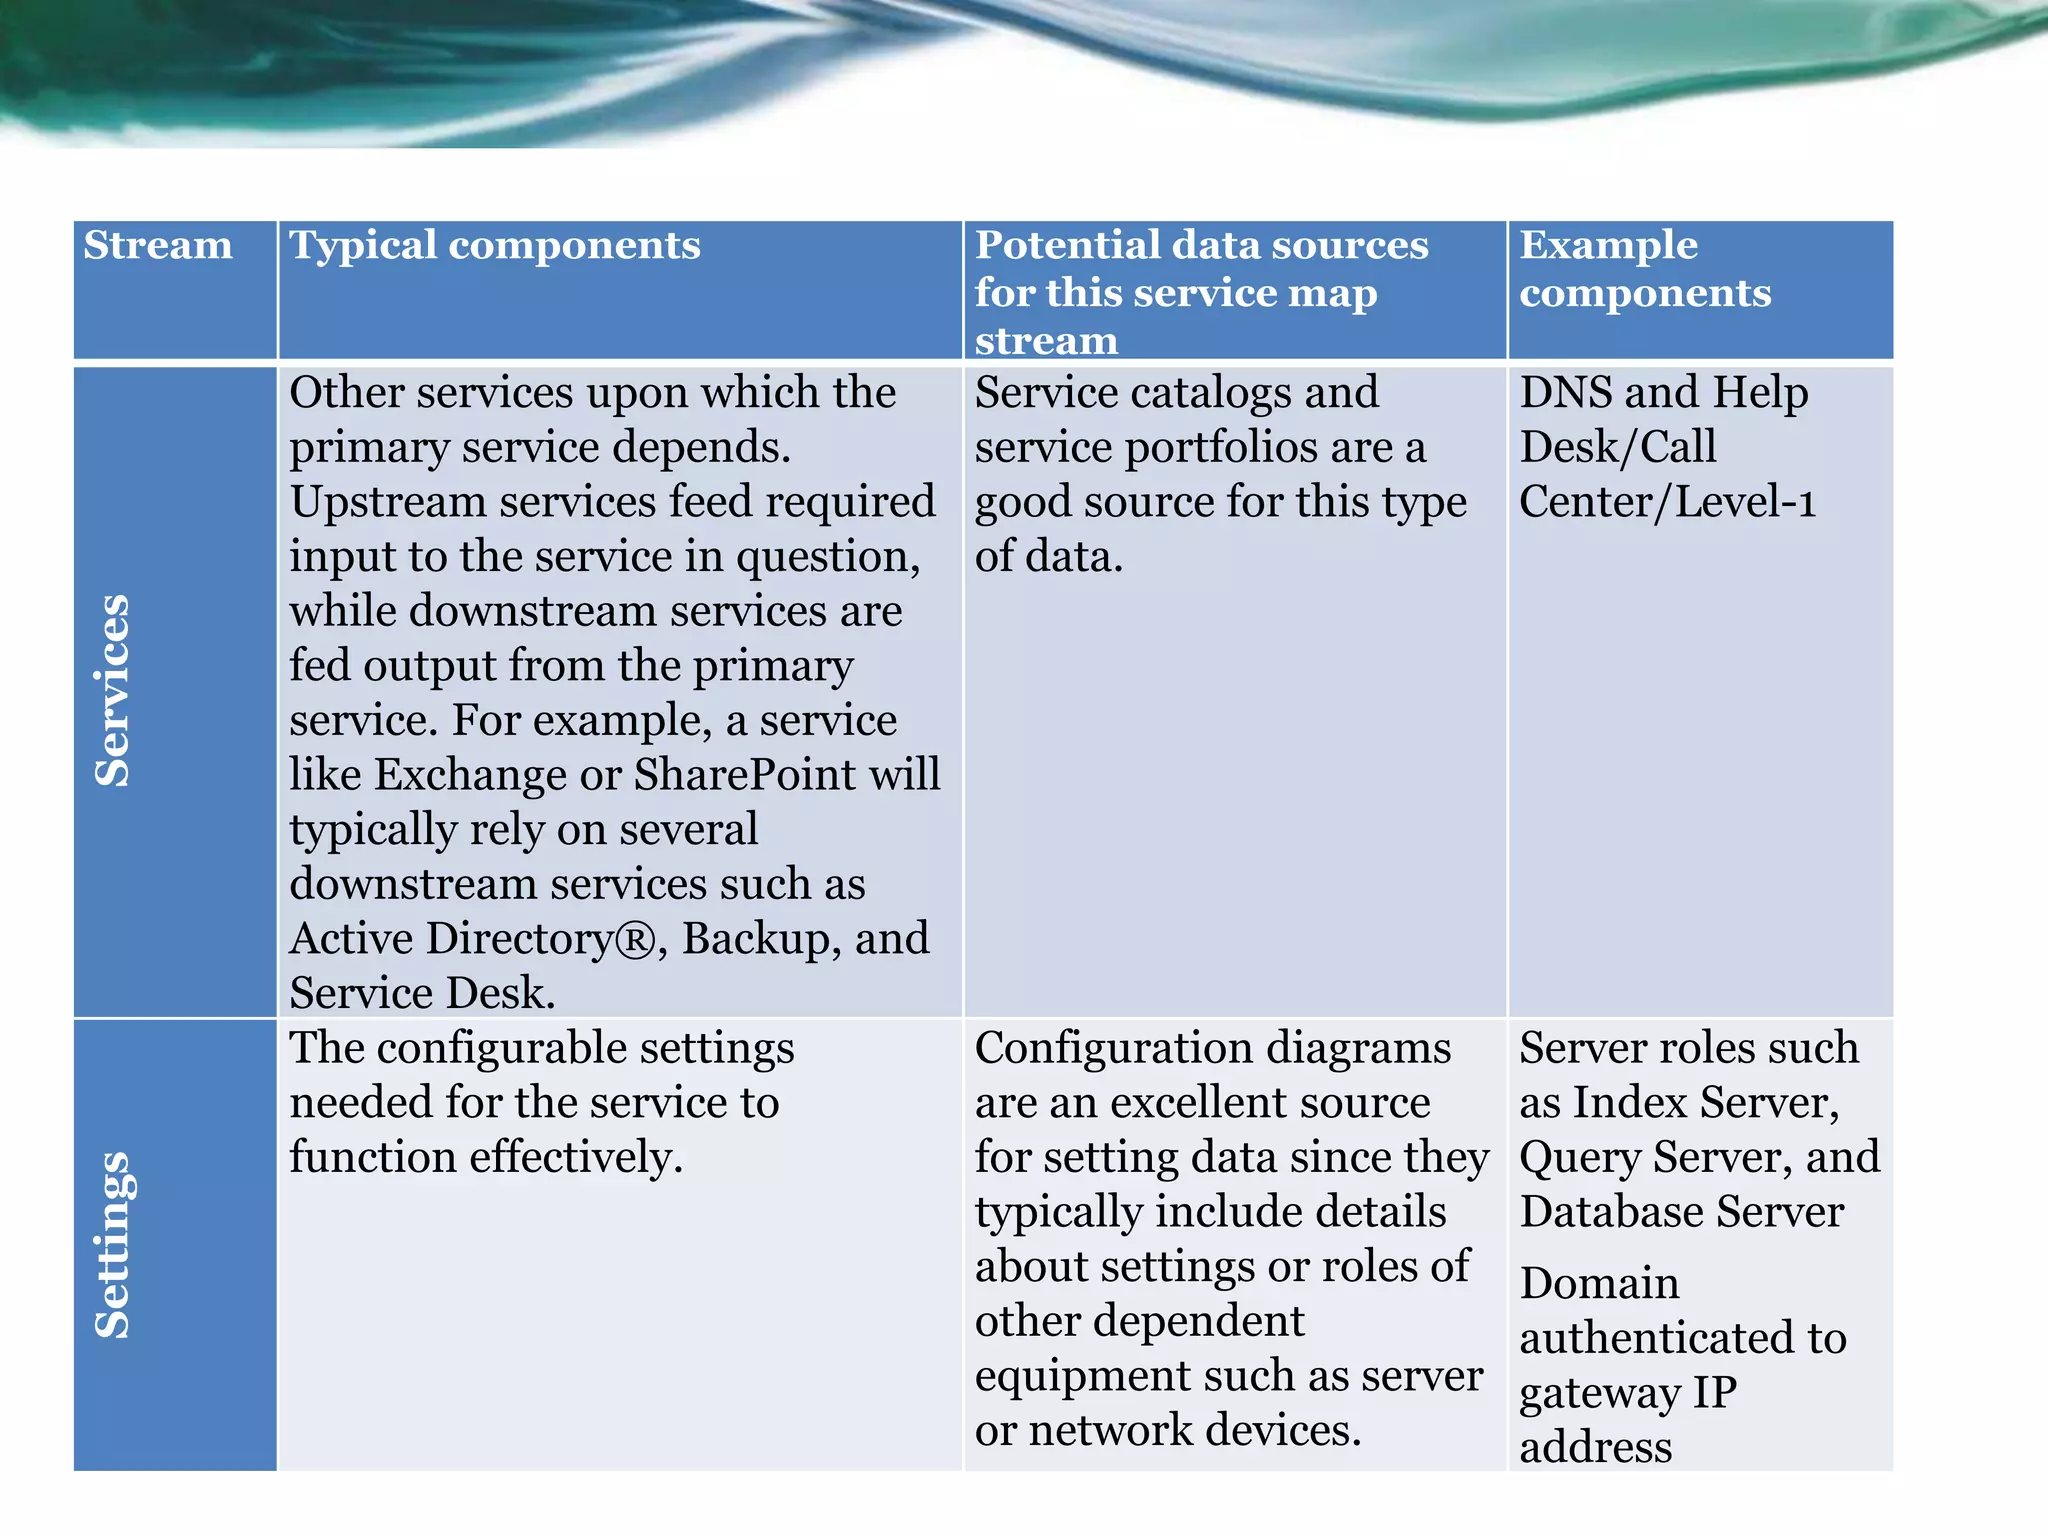
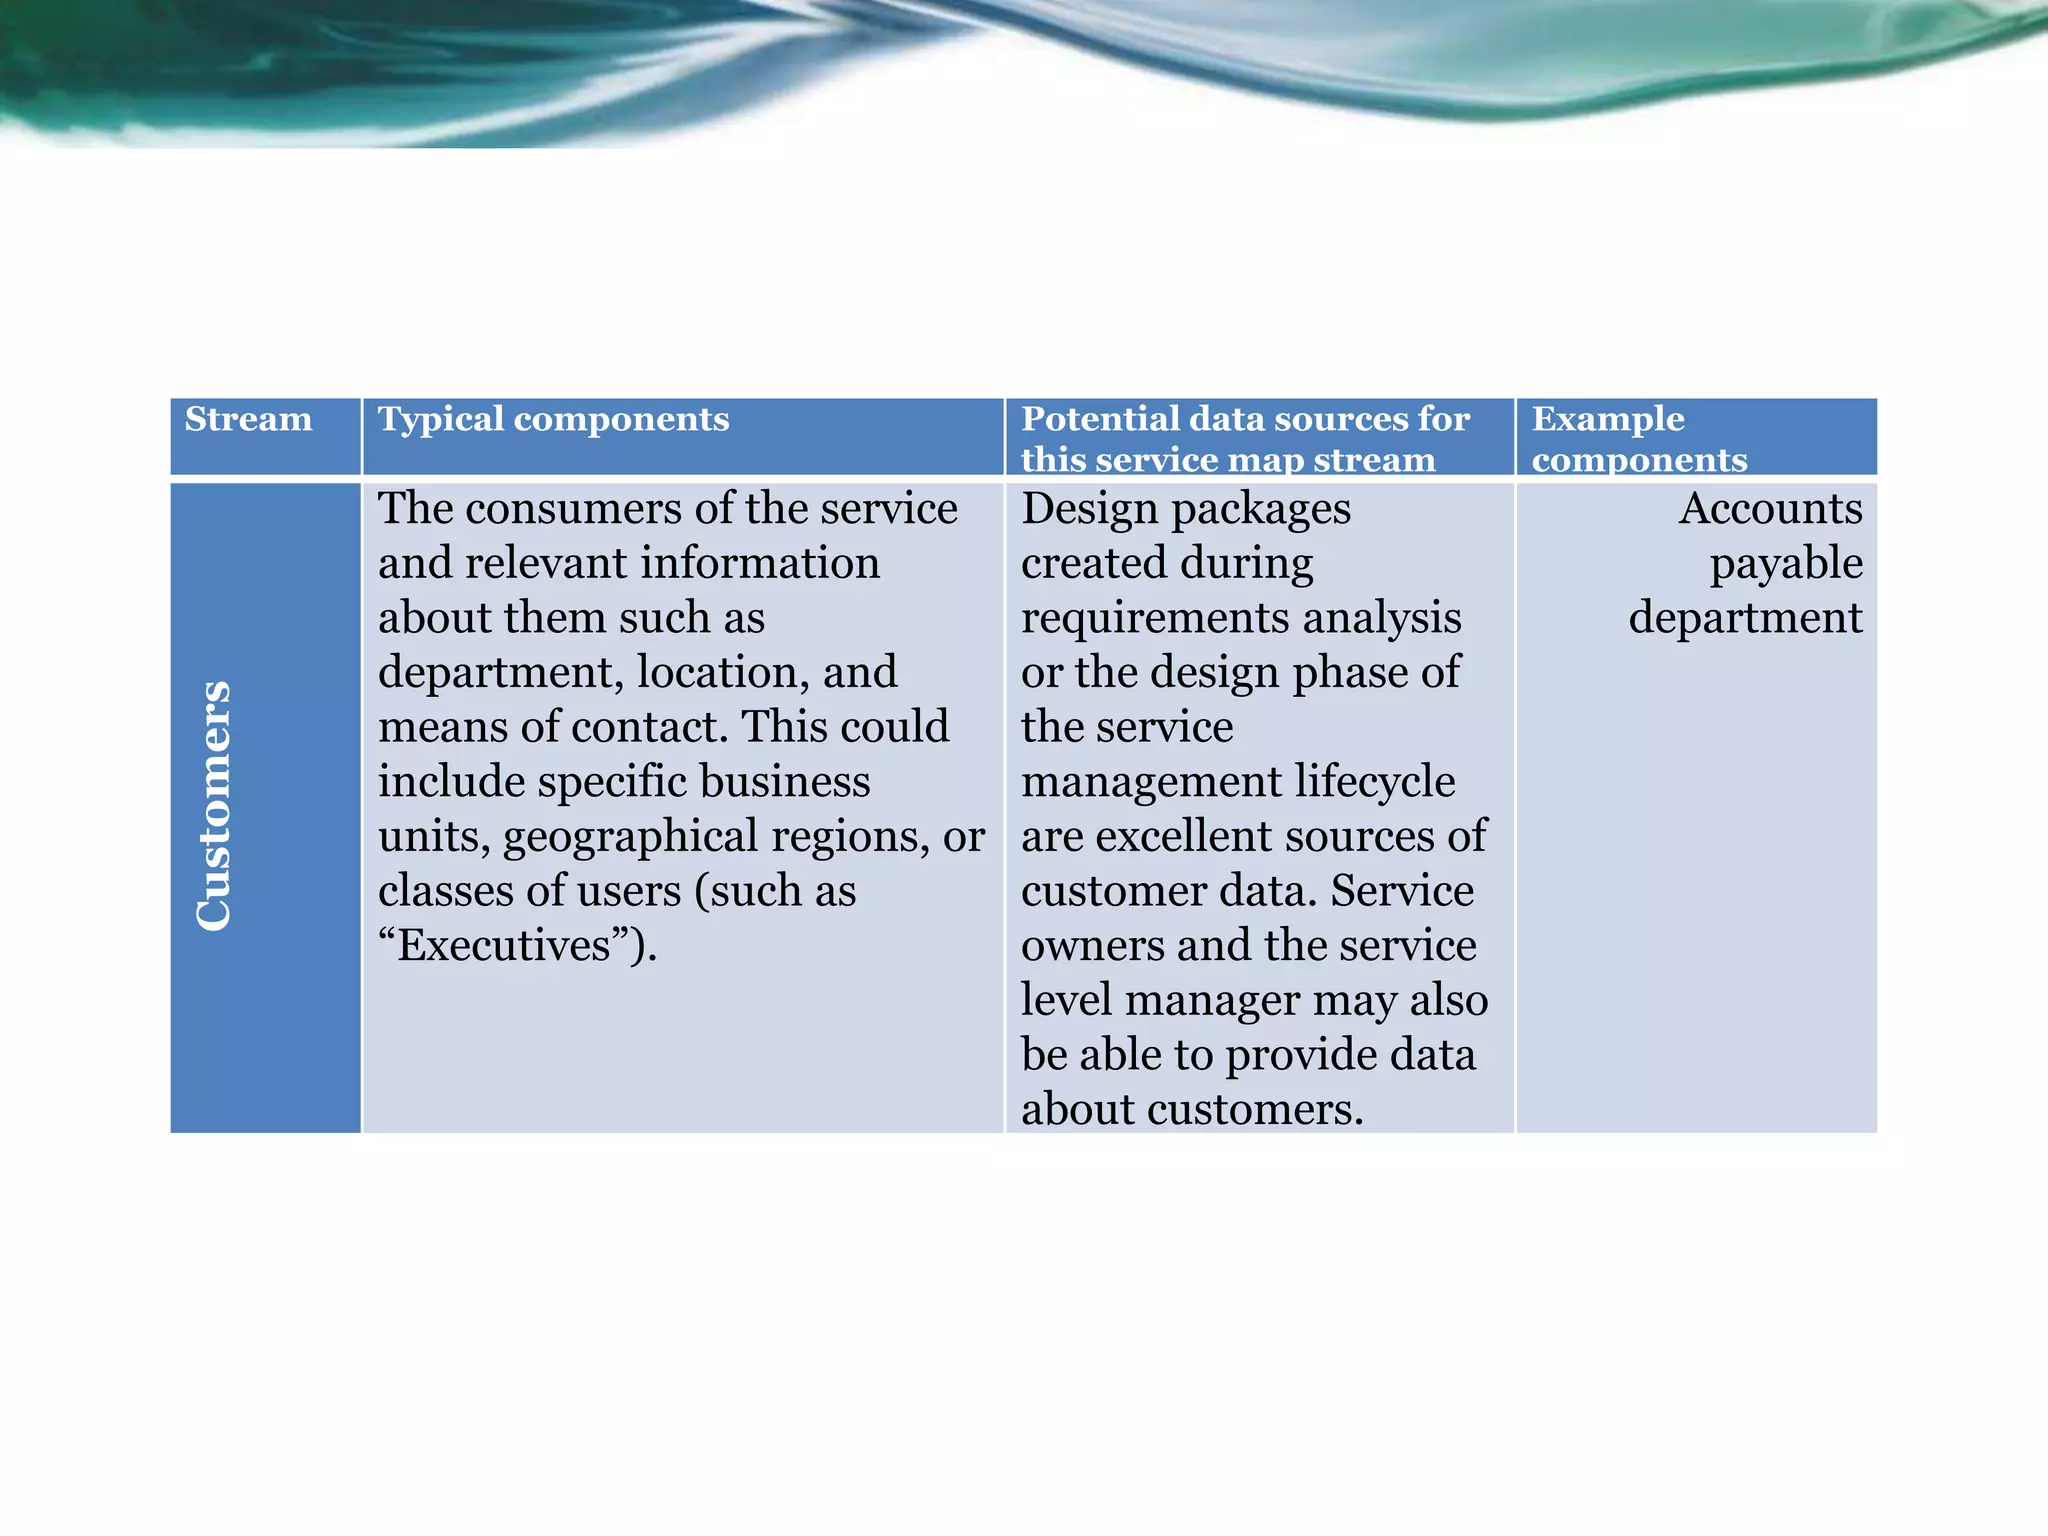
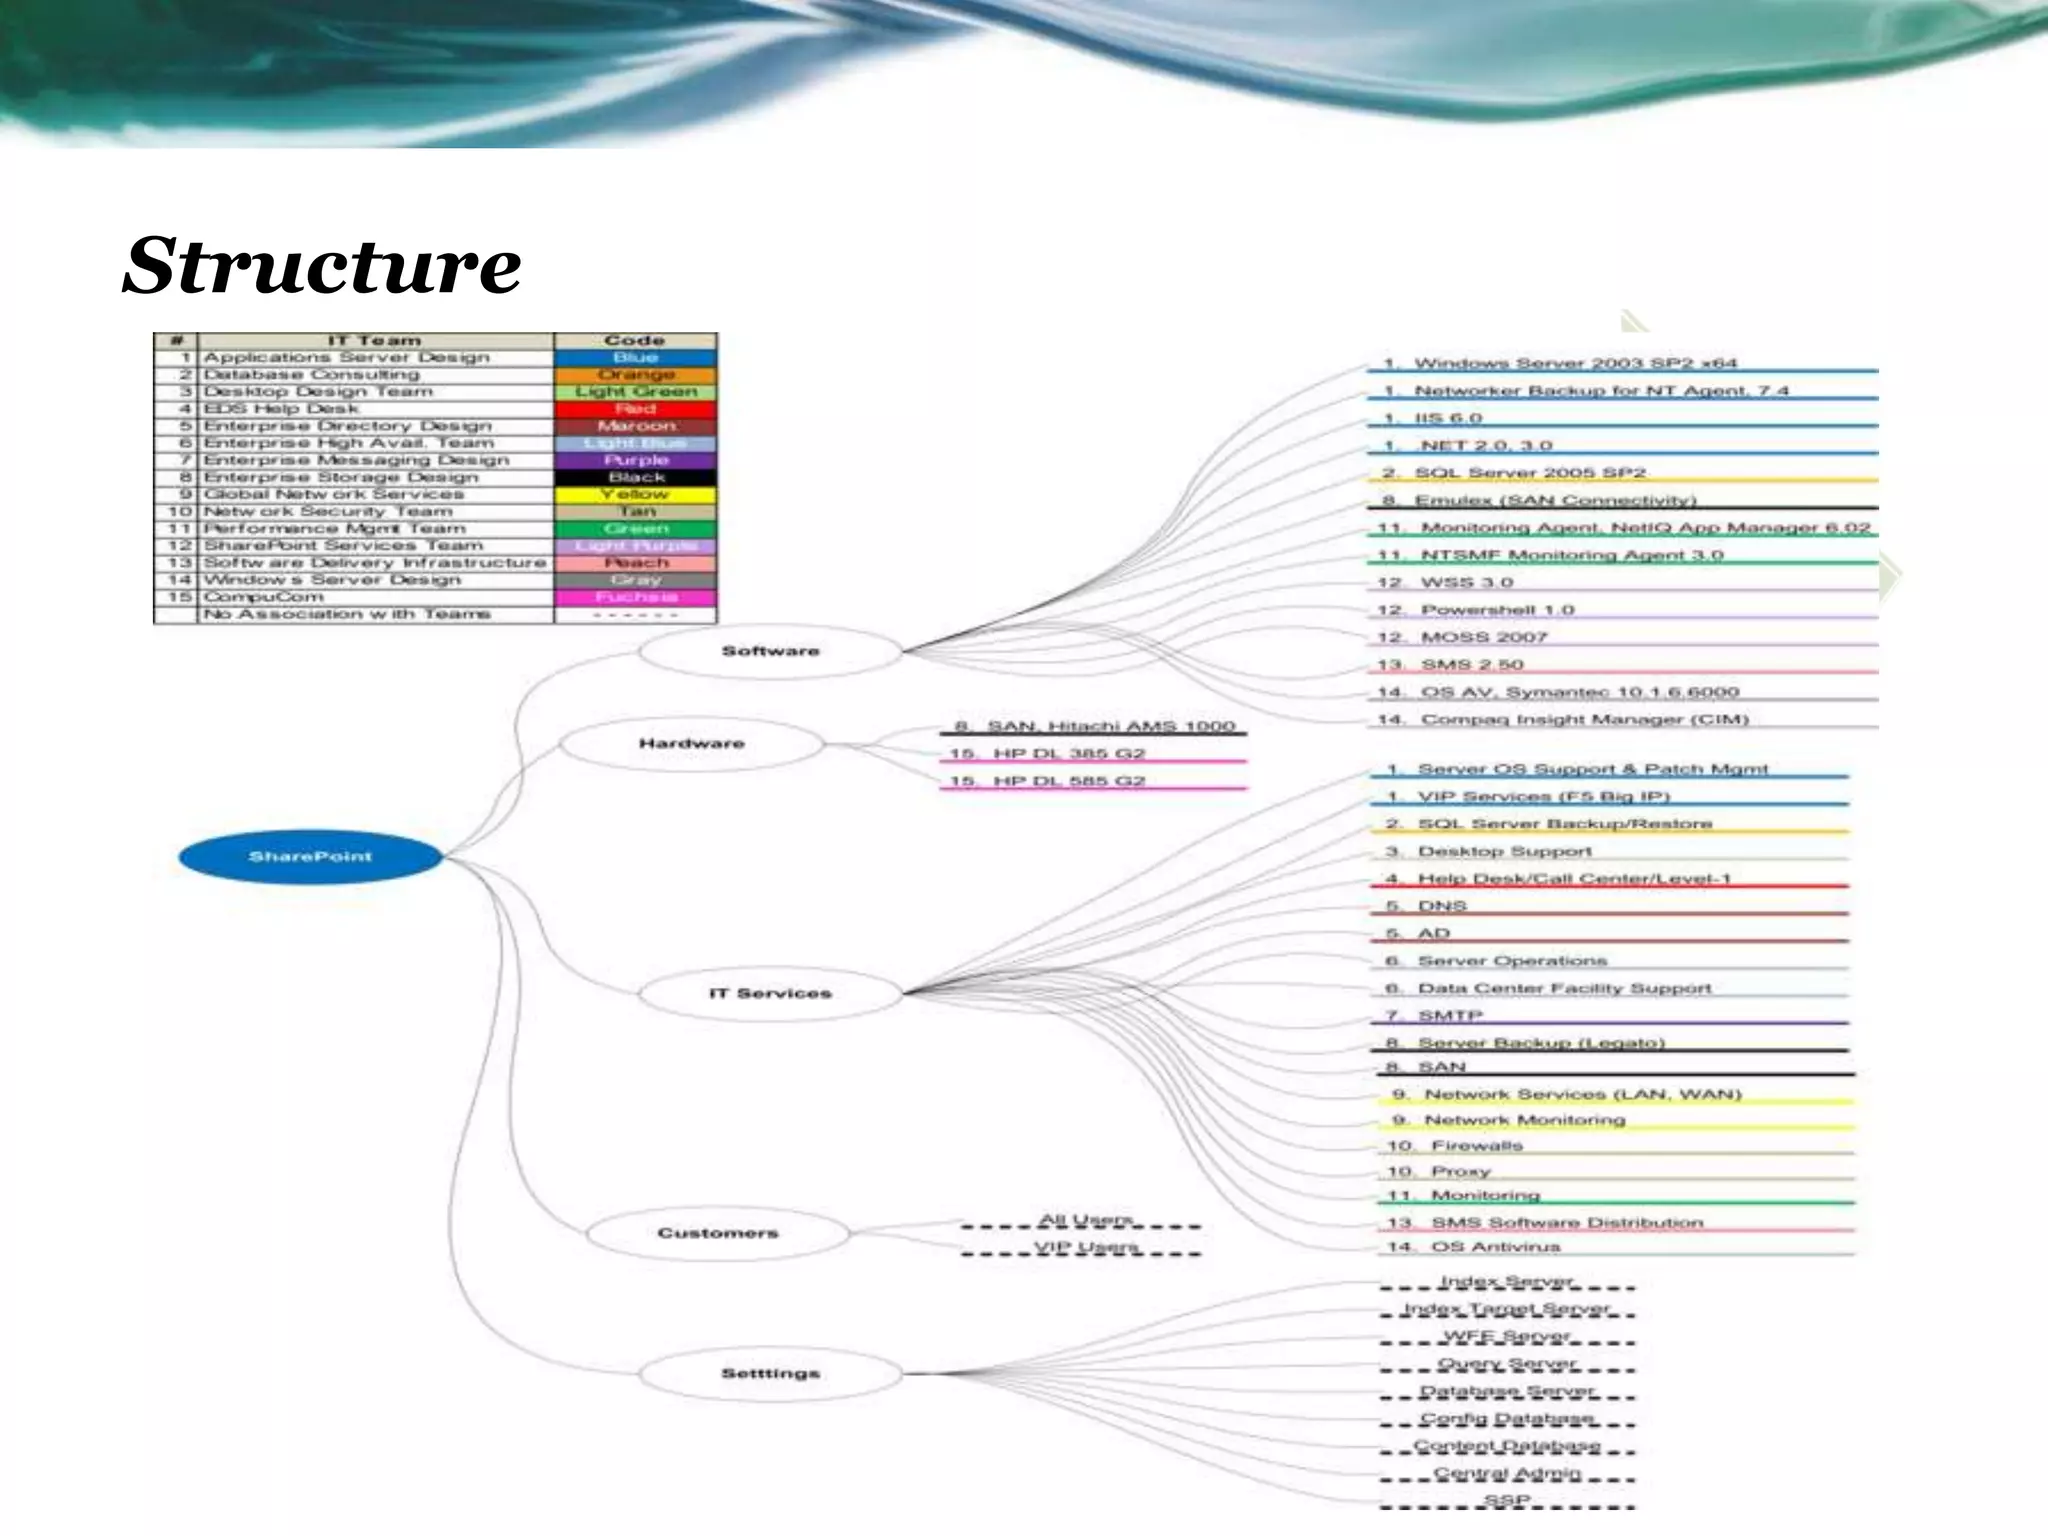
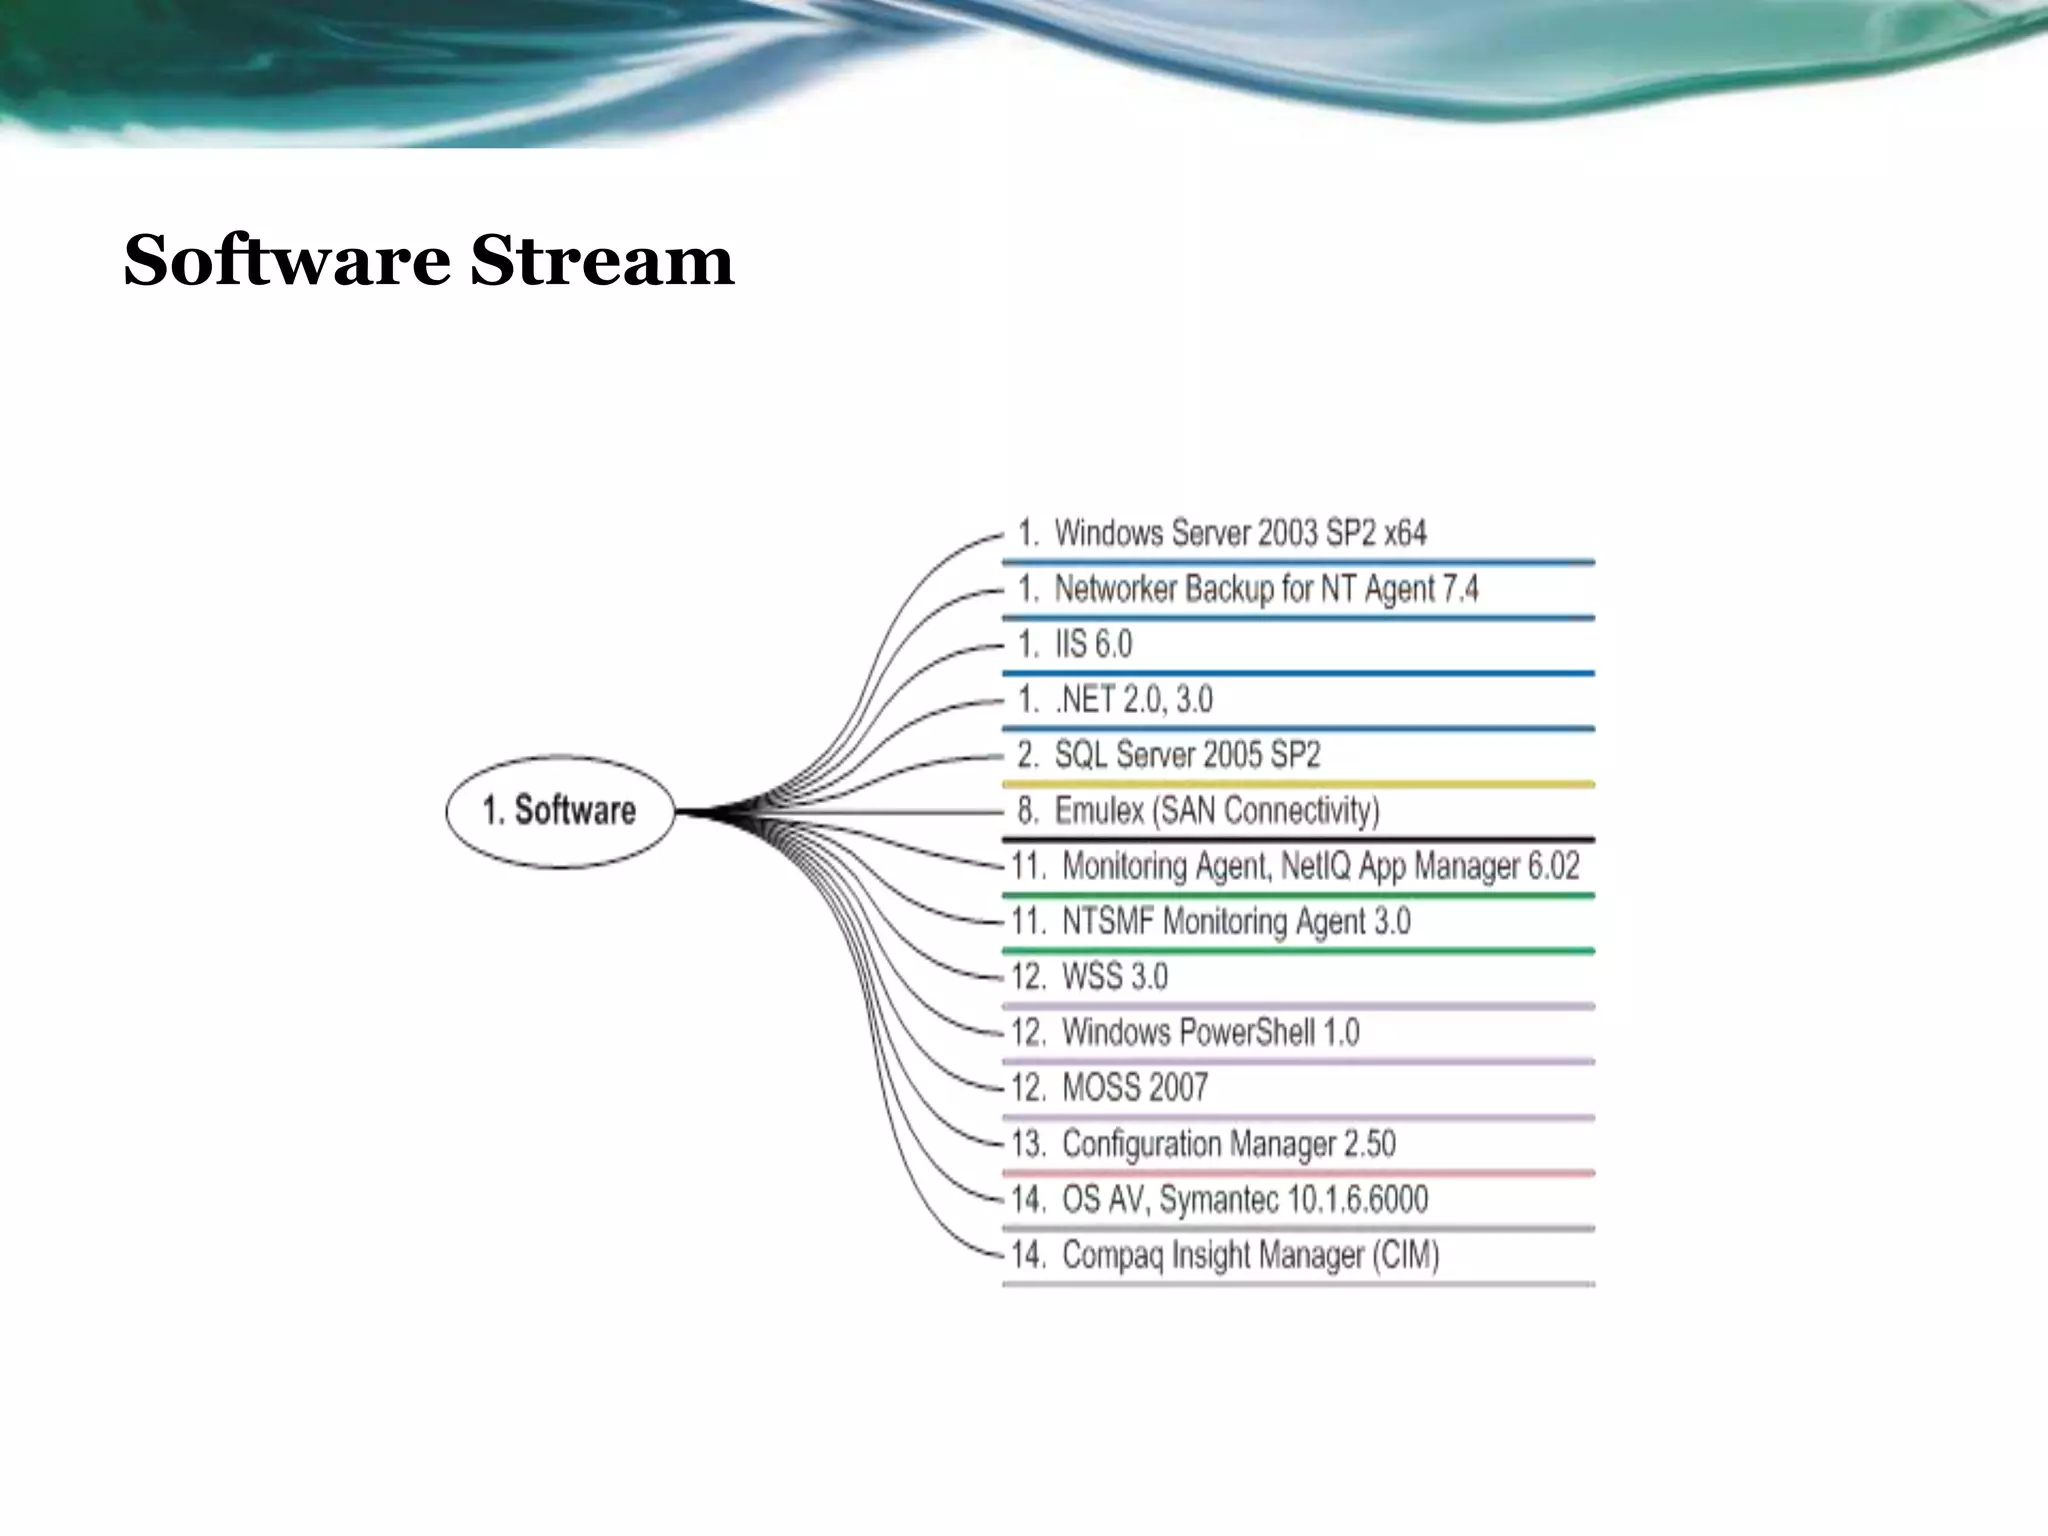
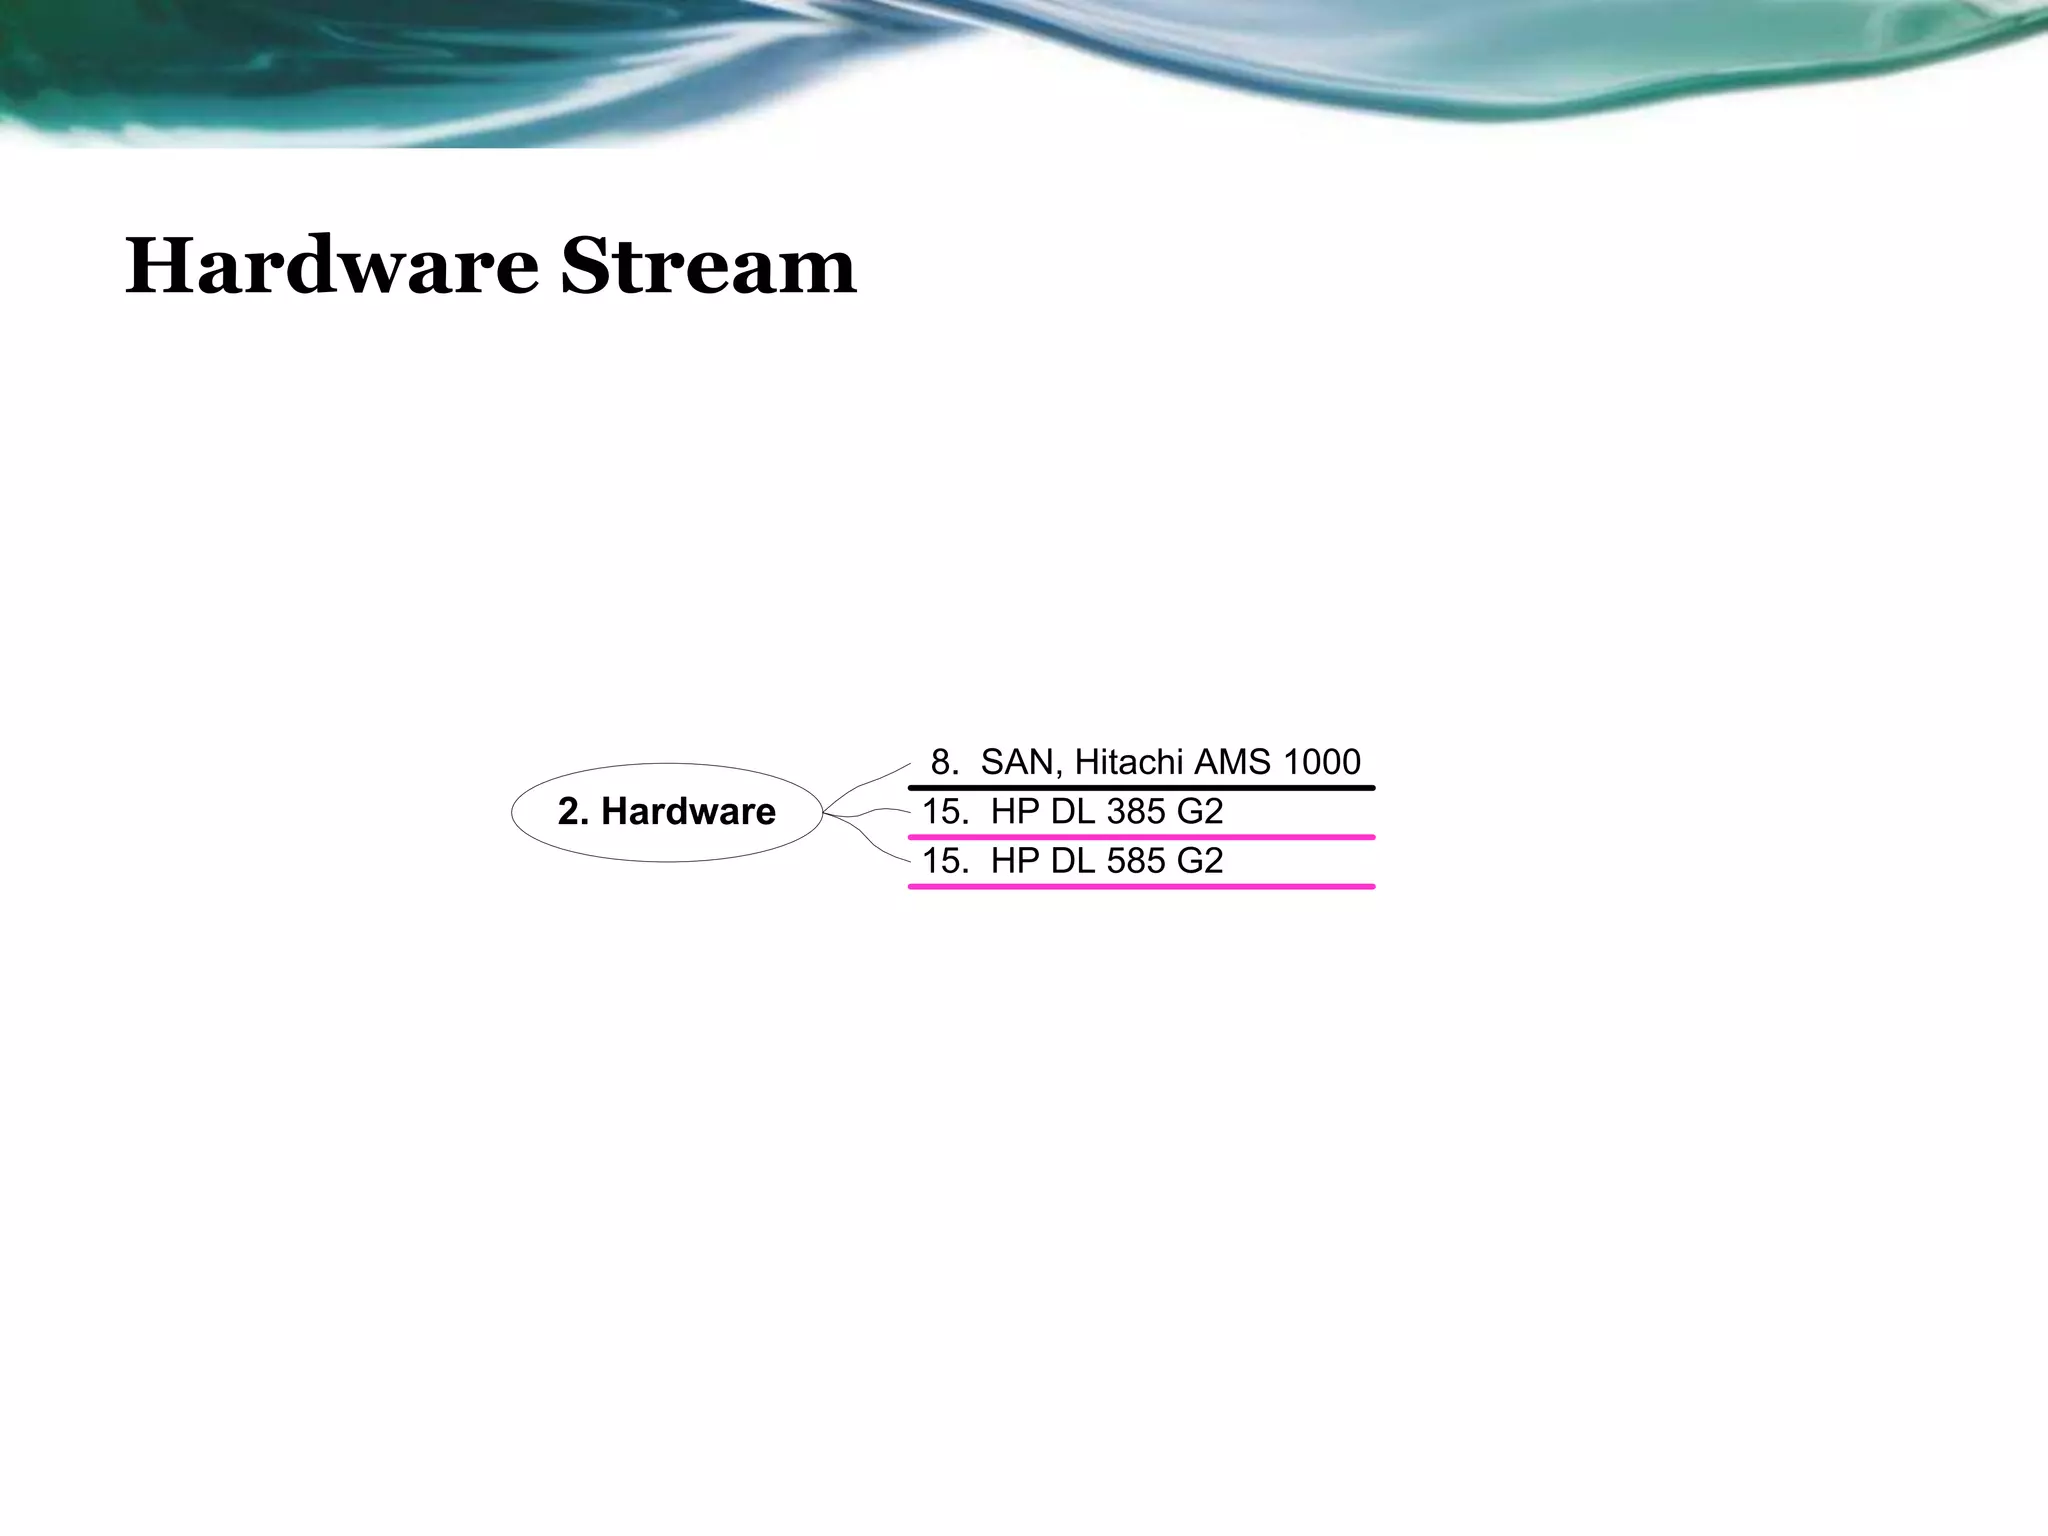
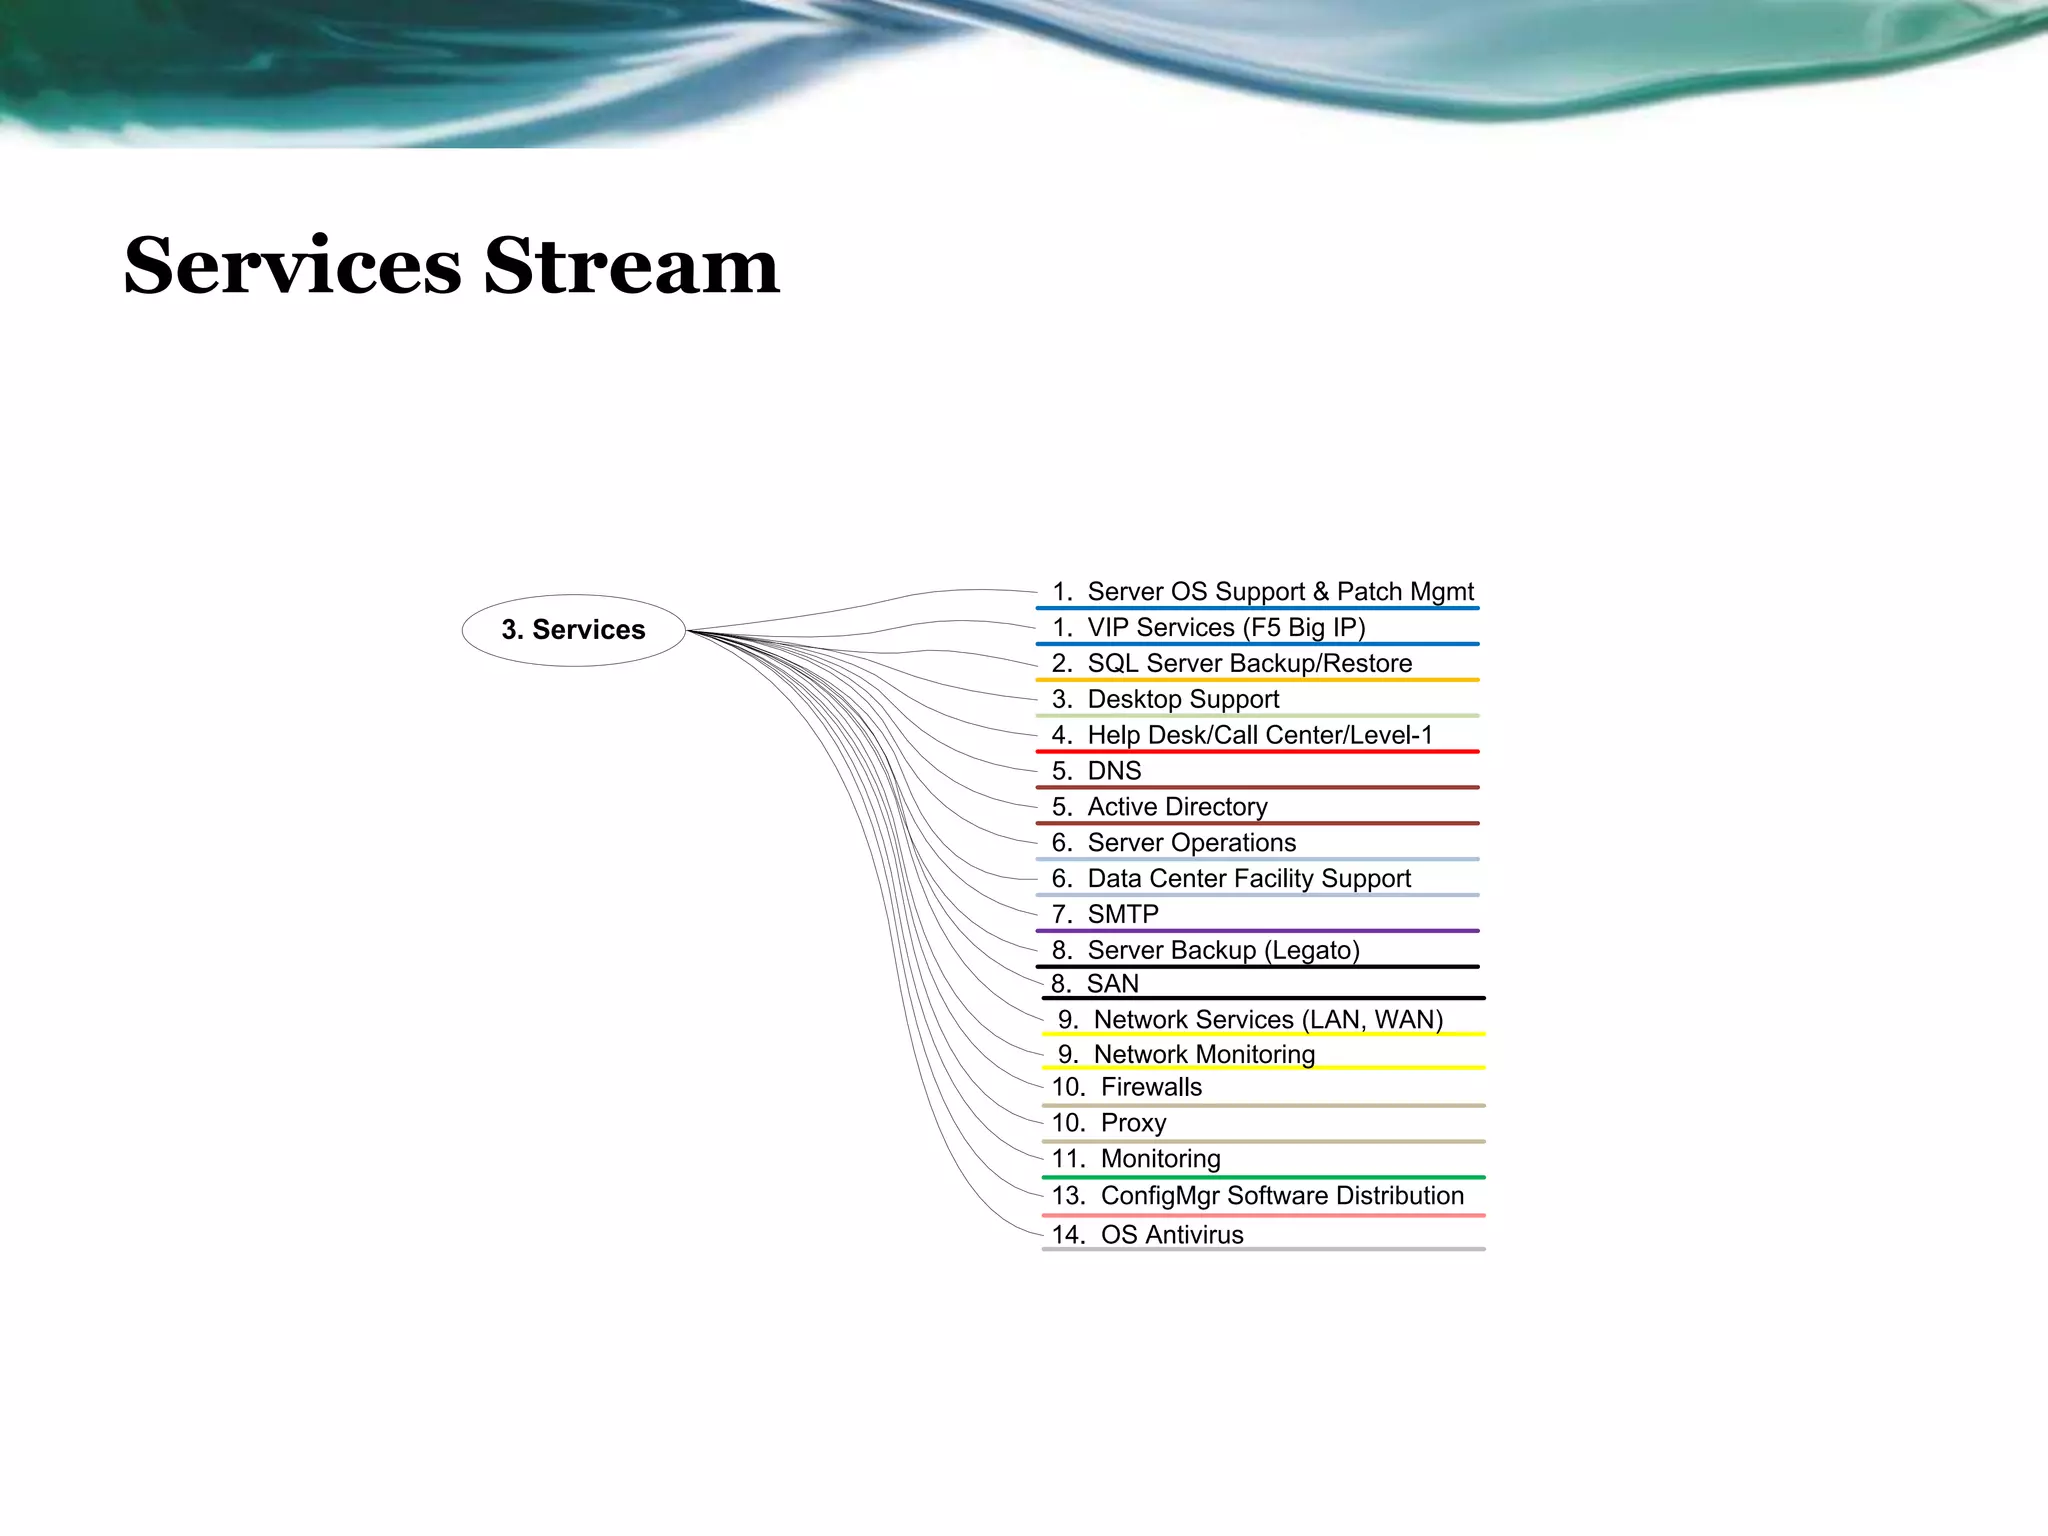
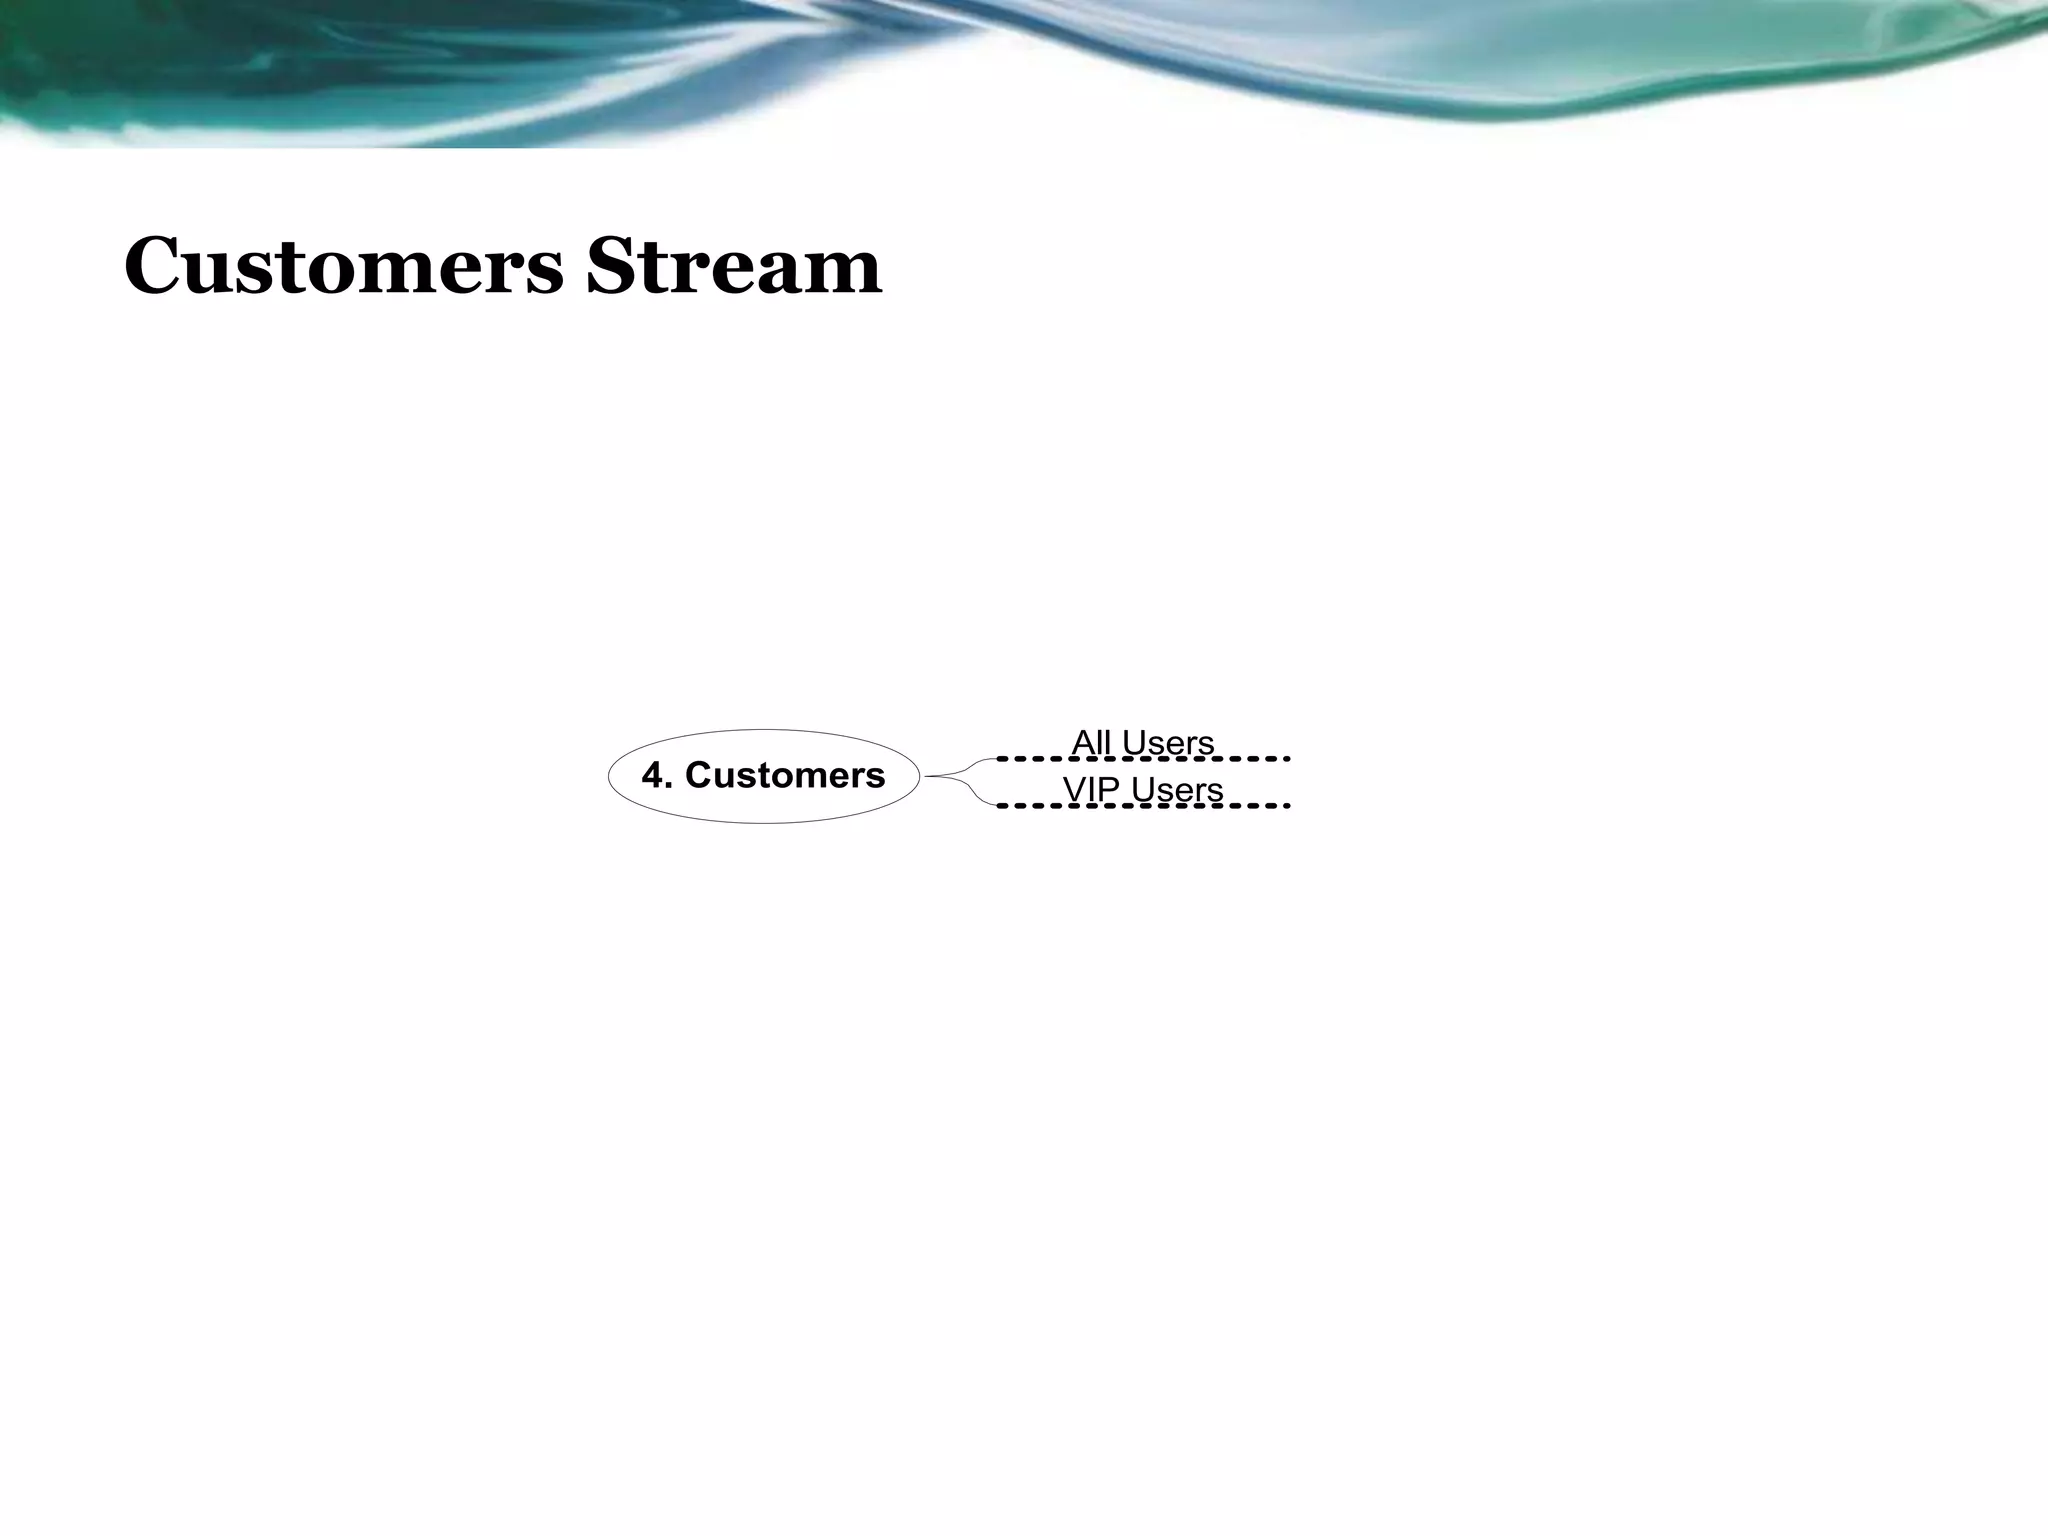
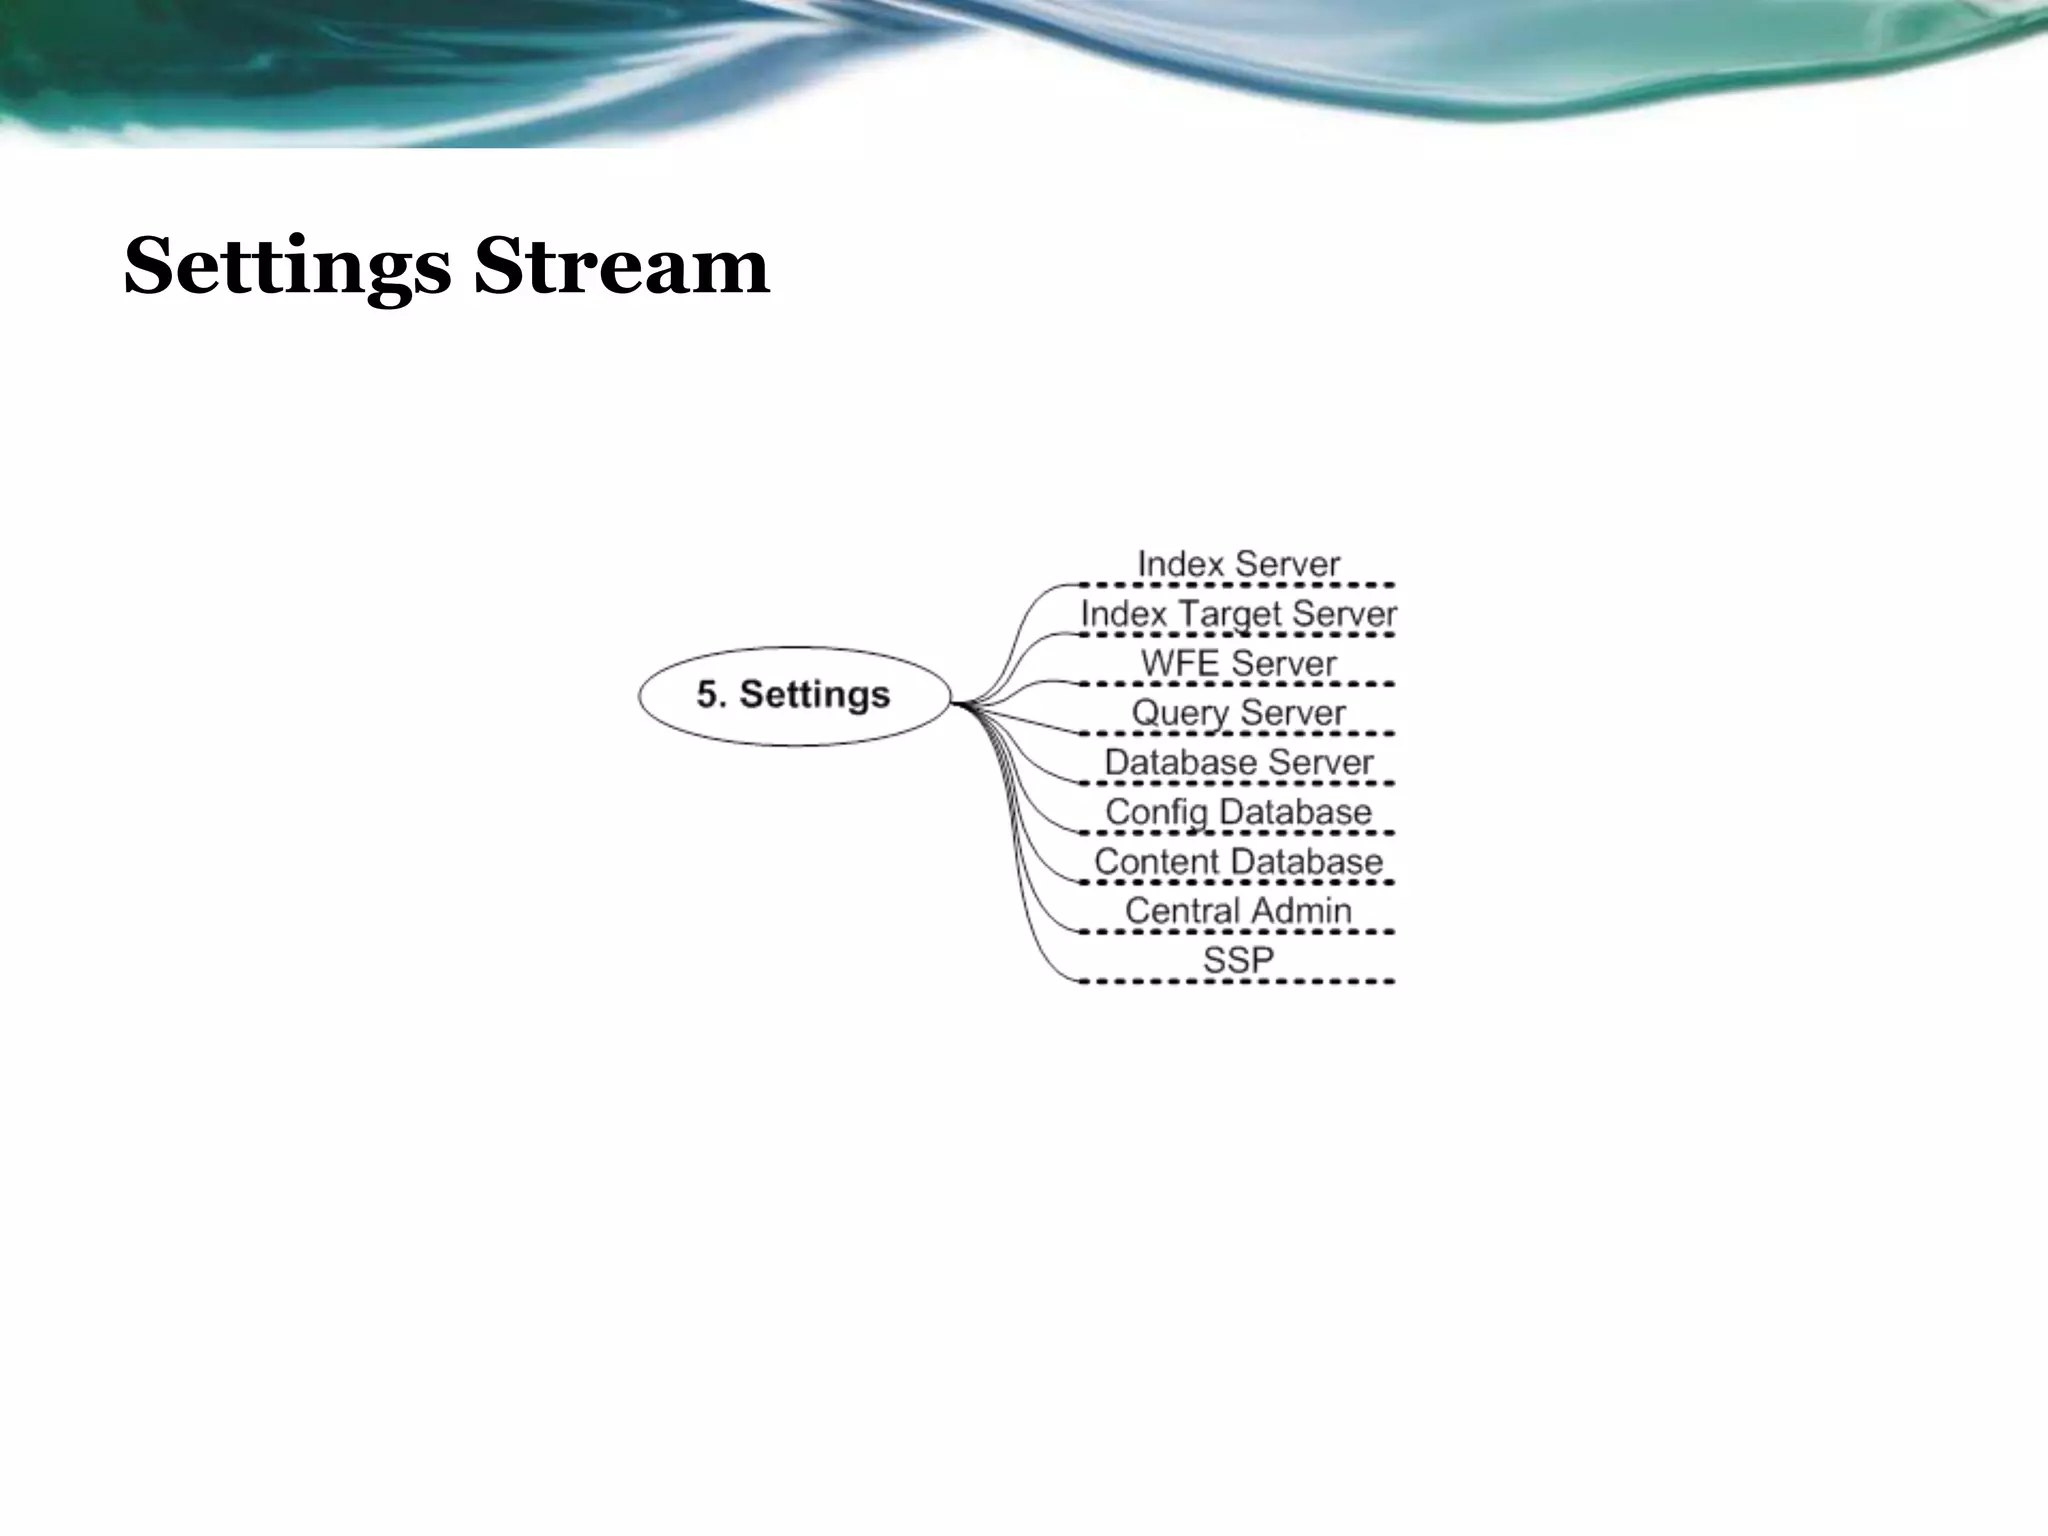
Service Mapping
Microsoft Operations Framework (MOF)

Mohamed El-Kassas
18/12/2012
Introduction

•   This Presentation is intended to introduce the
    content, structure, development, usage, and
    benefits of service maps. It will:
•   Show you a service map. It will show you
    an example of a complete service map,
    including the typical content and structure.
•   Demonstrate how to build service
    maps. It will provide detailed guidance on
    how to get started building a service map as
    well as considerations on how to take a
    programmatic approach to mapping services
    in your service delivery organization.
Intended Audience

•   This intended for those who have a basic understanding of
    Microsoft® Operations Framework (MOF) concepts and
    terminology and who are familiar with Microsoft products and
    technologies.
What Is a Service?

•   A means of delivering value to customers .
What Is a Service Map?

•   A service map is a graphical display of a service that illustrates the
    various components upon which successful delivery of that service
    relies. These components generally include hardware, software, and
    configurable settings or roles
•   . A Microsoft-developed best practice, a service map is a
    communications tool that illustrates the “what” of a service (its
    components and their relationships) as a basis for managing the
    “how” of a service (how the service is delivered and controlled to
    ensure expected availability, capacity, security, and manageability).
Why a Service Map?

•   If we want to control the quality of the experience to the user and
    customer, we must understand and control all of the components
    that make up the service.


•   They present a service-centered view of the environment, organizing
    technical capability in business-oriented terms.
•   They more readily facilitate understanding of complex systems and
    component dependencies than text-based documents for both
    technical staff and customers.
What Does a Service Map Tell Us?

•   Hardware streams that make up a service
•   Application streams that make up a service
•   Types of settings that are needed for the service to function
•   Supporting services that are needed to ensure the service stays
    available
•   Different customers that use the service
The Benefits of a Service Map

•   For Customer
•   For Technical Team
Kinds of Data Gathered in the Service
Mapping Process
Service Mapping a Restaurant’s Services

•   How would you map out a restaurant’s services?
•   What “hardware” (host podium, tables)
•   What “applications” (seating charts, menus)
•   Customers (walk-in, VIP)
•   Settings (seating times, specials)
•   Supporting Services (seating, order taking)
Service Map Content and Structure

. Most services can be decomposed into the five component categories, or
“streams,”
Stream     Typical components                   Potential data sources     Example
                                                for this service map       components
                                                stream
           All software associated with a       Software data usually      Windows
           given service including the core     comes from service         Server® 2008
Software


           application itself, any supporting   catalogs or software       SP2 x64
           or dependent applications,           portfolios. This also
           network and control software,        includes any dependent
           maintenance software, and            software related to the
           versioning information.              service being mapped.
           All servers, network devices,        Hardware data can be       HP DL 385 G2
           storage equipment, and desktop       identified through the
Hardware


           PCs required for a service to        configuration
           function, including model and        management system
           configuration information where      (CMS) or other similar
           appropriate.                         sources of configuration
                                                data.
Stream     Typical components                  Potential data sources        Example
                                               for this service map          components
                                               stream
           Other services upon which the       Service catalogs and          DNS and Help
           primary service depends.            service portfolios are a      Desk/Call
           Upstream services feed required     good source for this type     Center/Level-1
           input to the service in question,   of data.
           while downstream services are
Services


           fed output from the primary
           service. For example, a service
           like Exchange or SharePoint will
           typically rely on several
           downstream services such as
           Active Directory®, Backup, and
           Service Desk.
           The configurable settings           Configuration diagrams        Server roles such
           needed for the service to           are an excellent source       as Index Server,
           function effectively.               for setting data since they   Query Server, and
Settings


                                               typically include details     Database Server
                                               about settings or roles of    Domain
                                               other dependent               authenticated to
                                               equipment such as server      gateway IP
                                               or network devices.           address
Stream      Typical components                Potential data sources for   Example
                                              this service map stream      components
            The consumers of the service      Design packages                    Accounts
            and relevant information          created during                      payable
            about them such as                requirements analysis            department
            department, location, and         or the design phase of
Customers


            means of contact. This could      the service
            include specific business         management lifecycle
            units, geographical regions, or   are excellent sources of
            classes of users (such as         customer data. Service
            “Executives”).                    owners and the service
                                              level manager may also
                                              be able to provide data
                                              about customers.
Structure
Software Stream
Hardware Stream


                      8. SAN, Hitachi AMS 1000
        2. Hardware   15. HP DL 385 G2
                      15. HP DL 585 G2
Services Stream


                      1. Server OS Support & Patch Mgmt
        3. Services   1. VIP Services (F5 Big IP)
                      2. SQL Server Backup/Restore
                      3. Desktop Support
                      4. Help Desk/Call Center/Level-1
                      5. DNS
                      5. Active Directory
                      6. Server Operations
                      6. Data Center Facility Support
                      7. SMTP
                      8. Server Backup (Legato)
                      8. SAN
                      9. Network Services (LAN, WAN)
                      9. Network Monitoring
                      10. Firewalls
                      10. Proxy
                      11. Monitoring
                      13. ConfigMgr Software Distribution
                      14. OS Antivirus
Customers Stream


                         All Users
          4. Customers   VIP Users
Settings Stream
Building Service Maps


                                                 4. Gather
                  2. Define the   3. Select                     5. Establish    6. Maintain
1. Identify the                                  data and
                  mapping         services for                  service         the service
team                                             draw the
                  template        mapping                       relationships   maps
                                                 service maps

Service Mapping

  • 1.
    Service Mapping Microsoft OperationsFramework (MOF) Mohamed El-Kassas 18/12/2012
  • 2.
    Introduction • This Presentation is intended to introduce the content, structure, development, usage, and benefits of service maps. It will: • Show you a service map. It will show you an example of a complete service map, including the typical content and structure. • Demonstrate how to build service maps. It will provide detailed guidance on how to get started building a service map as well as considerations on how to take a programmatic approach to mapping services in your service delivery organization.
  • 3.
    Intended Audience • This intended for those who have a basic understanding of Microsoft® Operations Framework (MOF) concepts and terminology and who are familiar with Microsoft products and technologies.
  • 4.
    What Is aService? • A means of delivering value to customers .
  • 5.
    What Is aService Map? • A service map is a graphical display of a service that illustrates the various components upon which successful delivery of that service relies. These components generally include hardware, software, and configurable settings or roles • . A Microsoft-developed best practice, a service map is a communications tool that illustrates the “what” of a service (its components and their relationships) as a basis for managing the “how” of a service (how the service is delivered and controlled to ensure expected availability, capacity, security, and manageability).
  • 6.
    Why a ServiceMap? • If we want to control the quality of the experience to the user and customer, we must understand and control all of the components that make up the service. • They present a service-centered view of the environment, organizing technical capability in business-oriented terms. • They more readily facilitate understanding of complex systems and component dependencies than text-based documents for both technical staff and customers.
  • 7.
    What Does aService Map Tell Us? • Hardware streams that make up a service • Application streams that make up a service • Types of settings that are needed for the service to function • Supporting services that are needed to ensure the service stays available • Different customers that use the service
  • 8.
    The Benefits ofa Service Map • For Customer • For Technical Team
  • 9.
    Kinds of DataGathered in the Service Mapping Process
  • 10.
    Service Mapping aRestaurant’s Services • How would you map out a restaurant’s services? • What “hardware” (host podium, tables) • What “applications” (seating charts, menus) • Customers (walk-in, VIP) • Settings (seating times, specials) • Supporting Services (seating, order taking)
  • 11.
    Service Map Contentand Structure . Most services can be decomposed into the five component categories, or “streams,”
  • 12.
    Stream Typical components Potential data sources Example for this service map components stream All software associated with a Software data usually Windows given service including the core comes from service Server® 2008 Software application itself, any supporting catalogs or software SP2 x64 or dependent applications, portfolios. This also network and control software, includes any dependent maintenance software, and software related to the versioning information. service being mapped. All servers, network devices, Hardware data can be HP DL 385 G2 storage equipment, and desktop identified through the Hardware PCs required for a service to configuration function, including model and management system configuration information where (CMS) or other similar appropriate. sources of configuration data.
  • 13.
    Stream Typical components Potential data sources Example for this service map components stream Other services upon which the Service catalogs and DNS and Help primary service depends. service portfolios are a Desk/Call Upstream services feed required good source for this type Center/Level-1 input to the service in question, of data. while downstream services are Services fed output from the primary service. For example, a service like Exchange or SharePoint will typically rely on several downstream services such as Active Directory®, Backup, and Service Desk. The configurable settings Configuration diagrams Server roles such needed for the service to are an excellent source as Index Server, function effectively. for setting data since they Query Server, and Settings typically include details Database Server about settings or roles of Domain other dependent authenticated to equipment such as server gateway IP or network devices. address
  • 14.
    Stream Typical components Potential data sources for Example this service map stream components The consumers of the service Design packages Accounts and relevant information created during payable about them such as requirements analysis department department, location, and or the design phase of Customers means of contact. This could the service include specific business management lifecycle units, geographical regions, or are excellent sources of classes of users (such as customer data. Service “Executives”). owners and the service level manager may also be able to provide data about customers.
  • 15.
  • 16.
  • 17.
    Hardware Stream 8. SAN, Hitachi AMS 1000 2. Hardware 15. HP DL 385 G2 15. HP DL 585 G2
  • 18.
    Services Stream 1. Server OS Support & Patch Mgmt 3. Services 1. VIP Services (F5 Big IP) 2. SQL Server Backup/Restore 3. Desktop Support 4. Help Desk/Call Center/Level-1 5. DNS 5. Active Directory 6. Server Operations 6. Data Center Facility Support 7. SMTP 8. Server Backup (Legato) 8. SAN 9. Network Services (LAN, WAN) 9. Network Monitoring 10. Firewalls 10. Proxy 11. Monitoring 13. ConfigMgr Software Distribution 14. OS Antivirus
  • 19.
    Customers Stream All Users 4. Customers VIP Users
  • 20.
  • 21.
    Building Service Maps 4. Gather 2. Define the 3. Select 5. Establish 6. Maintain 1. Identify the data and mapping services for service the service team draw the template mapping relationships maps service maps

Editor's Notes

  • #2 This template can be used as a starter file to give updates for project milestones.SectionsRight-click on a slide to add sections. Sections can help to organize your slides or facilitate collaboration between multiple authors.NotesUse the Notes section for delivery notes or to provide additional details for the audience. View these notes in Presentation View during your presentation. Keep in mind the font size (important for accessibility, visibility, videotaping, and online production)Coordinated colors Pay particular attention to the graphs, charts, and text boxes.Consider that attendees will print in black and white or grayscale. Run a test print to make sure your colors work when printed in pure black and white and grayscale.Graphics, tables, and graphsKeep it simple: If possible, use consistent, non-distracting styles and colors.Label all graphs and tables.
  • #3 What is the project about?Define the goal of this projectIs it similar to projects in the past or is it a new effort?Define the scope of this projectIs it an independent project or is it related to other projects?* Note that this slide is not necessary for weekly status meetings
  • #4 * If any of these issues caused a schedule delay or need to be discussed further, include details in next slide.
  • #5 Duplicate this slide as necessary if there is more than one issue.This and related slides can be moved to the appendix or hidden if necessary.
  • #6 Duplicate this slide as necessary if there is more than one issue.This and related slides can be moved to the appendix or hidden if necessary.
  • #7 Duplicate this slide as necessary if there is more than one issue.This and related slides can be moved to the appendix or hidden if necessary.
  • #8 Duplicate this slide as necessary if there is more than one issue.This and related slides can be moved to the appendix or hidden if necessary.
  • #9 Duplicate this slide as necessary if there is more than one issue.This and related slides can be moved to the appendix or hidden if necessary.
  • #10 Duplicate this slide as necessary if there is more than one issue.This and related slides can be moved to the appendix or hidden if necessary.
  • #11 Duplicate this slide as necessary if there is more than one issue.This and related slides can be moved to the appendix or hidden if necessary.
  • #12 Duplicate this slide as necessary if there is more than one issue.This and related slides can be moved to the appendix or hidden if necessary.
  • #13 Duplicate this slide as necessary if there is more than one issue.This and related slides can be moved to the appendix or hidden if necessary.
  • #14 Duplicate this slide as necessary if there is more than one issue.This and related slides can be moved to the appendix or hidden if necessary.
  • #15 Duplicate this slide as necessary if there is more than one issue.This and related slides can be moved to the appendix or hidden if necessary.
  • #16 The following slides show several examples of timelines using SmartArt graphics.Include a timeline for the project, clearly marking milestones, important dates, and highlight where the project is now.
  • #17 The following slides show several examples of timelines using SmartArt graphics.Include a timeline for the project, clearly marking milestones, important dates, and highlight where the project is now.
  • #18 The following slides show several examples of timelines using SmartArt graphics.Include a timeline for the project, clearly marking milestones, important dates, and highlight where the project is now.
  • #19 The following slides show several examples of timelines using SmartArt graphics.Include a timeline for the project, clearly marking milestones, important dates, and highlight where the project is now.
  • #20 The following slides show several examples of timelines using SmartArt graphics.Include a timeline for the project, clearly marking milestones, important dates, and highlight where the project is now.
  • #21 The following slides show several examples of timelines using SmartArt graphics.Include a timeline for the project, clearly marking milestones, important dates, and highlight where the project is now.
  • #22 The following slides show several examples of timelines using SmartArt graphics.Include a timeline for the project, clearly marking milestones, important dates, and highlight where the project is now.