
Downloaded 110 times
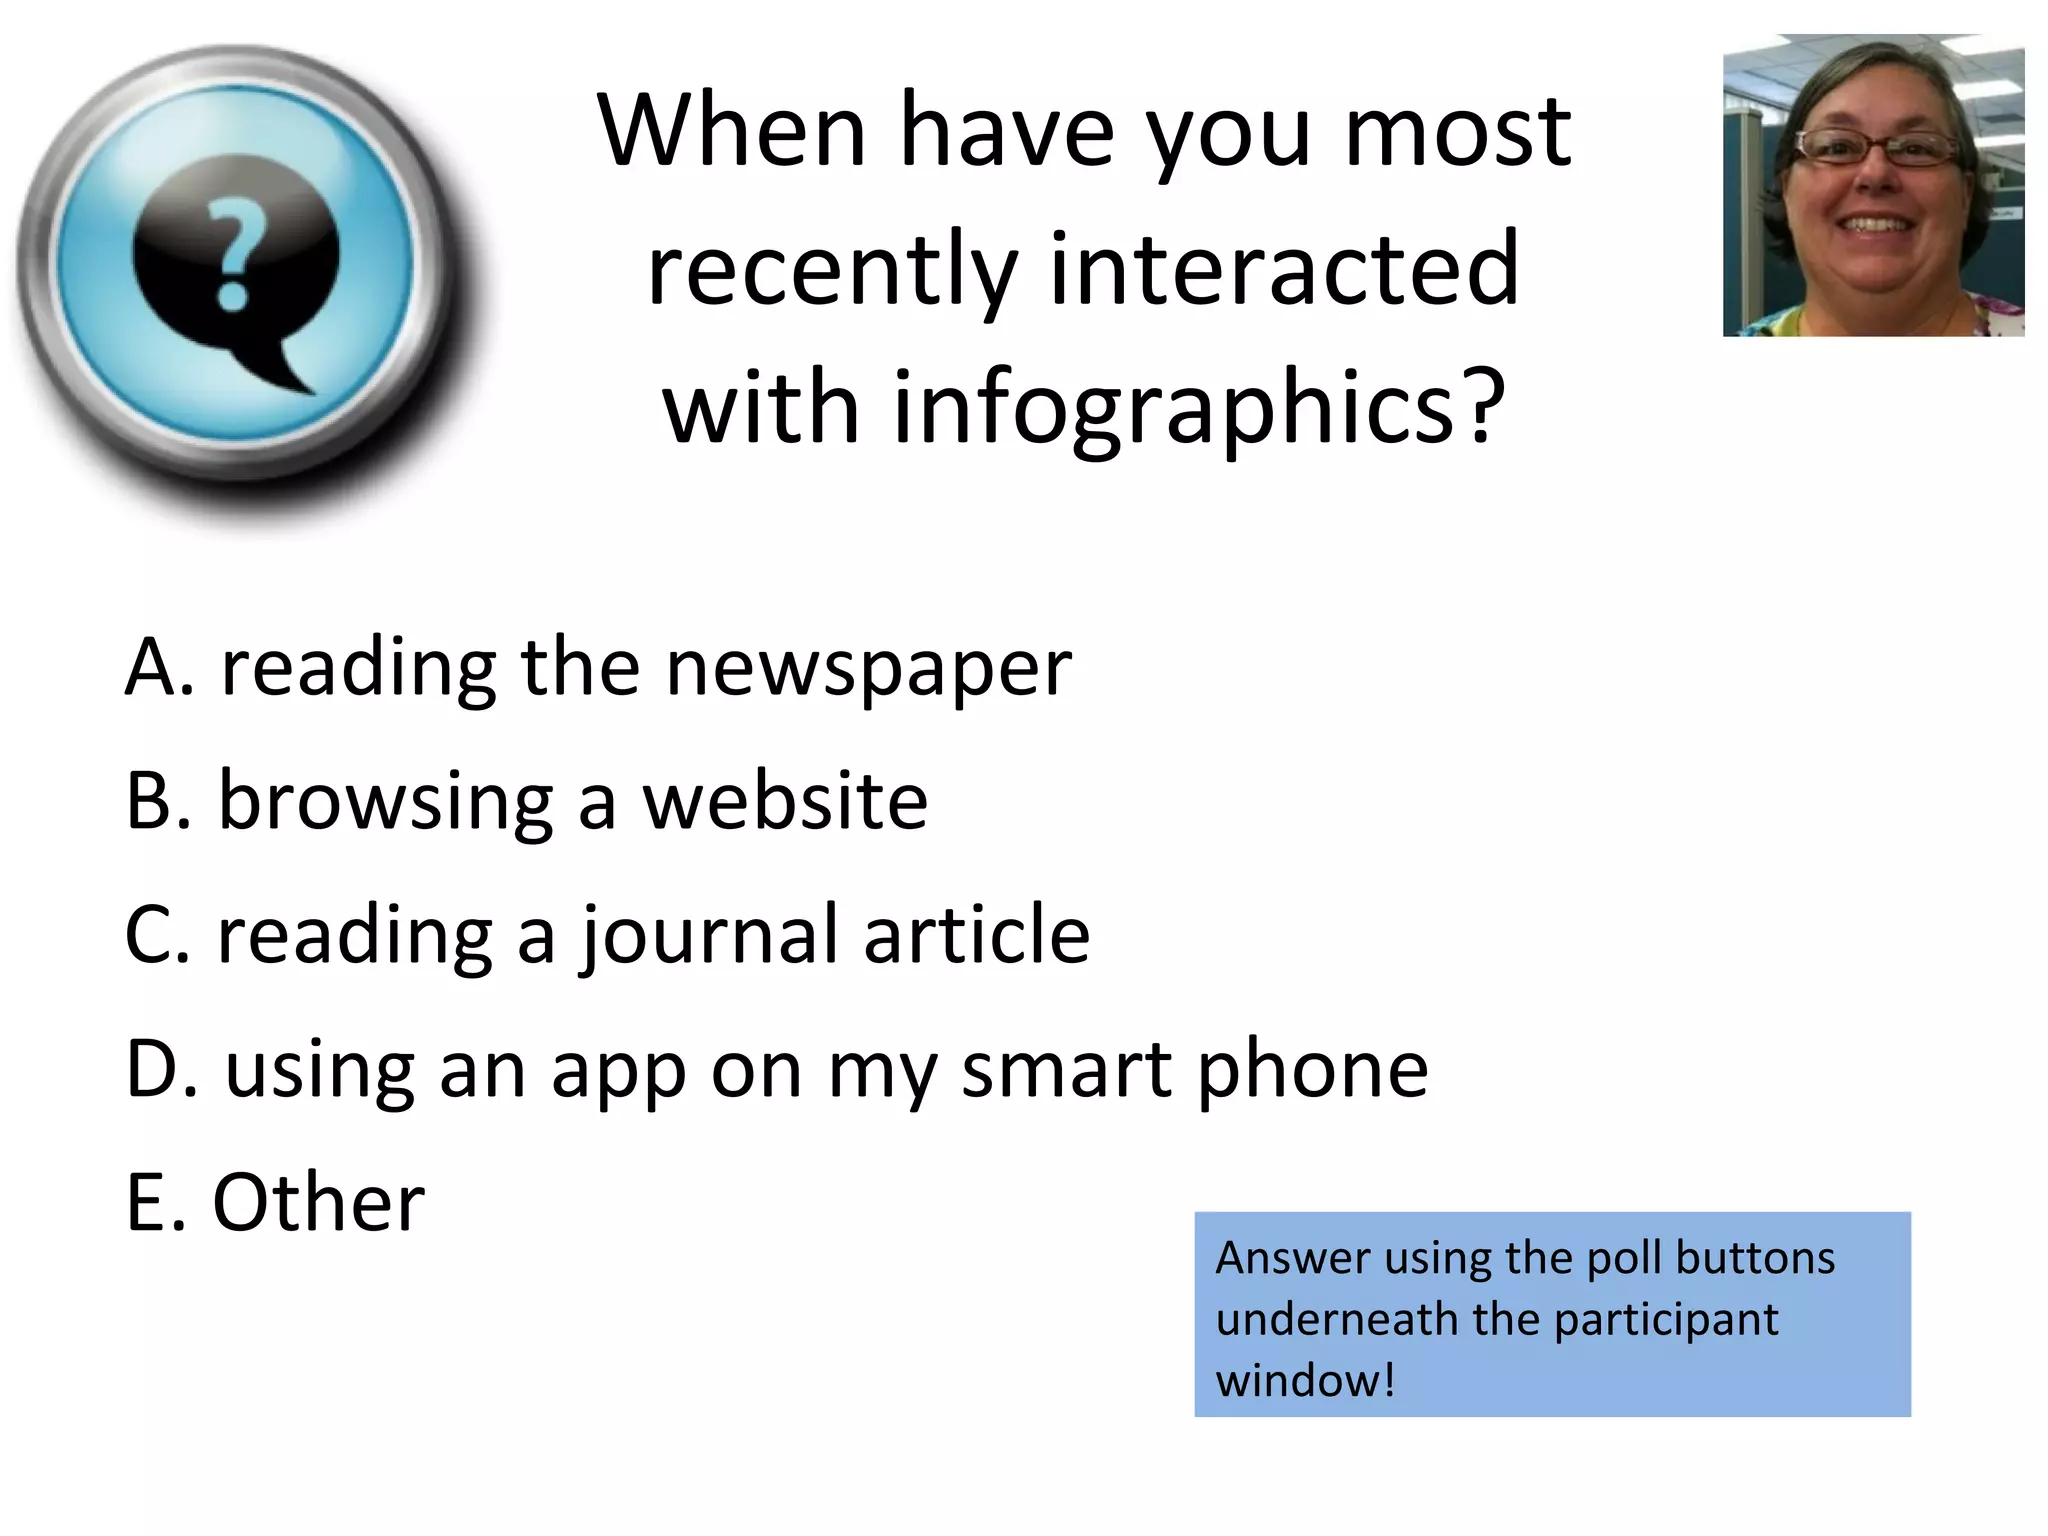
![Today ’s presenters Jessica Fries-Gaither Education Resource Specialist The Ohio State University College of Education and Human Ecology School of Teaching and Learning [email_address] Terry Shiverdecker Science Content Specialist Ohio Resource Center Ohio State University College of Education and Human Ecology School of Teaching and Learning [email_address]](https://image.slidesharecdn.com/visualliteracy2-110414133215-phpapp01/75/Visual-Literacy-Part-2-6-2048.jpg)
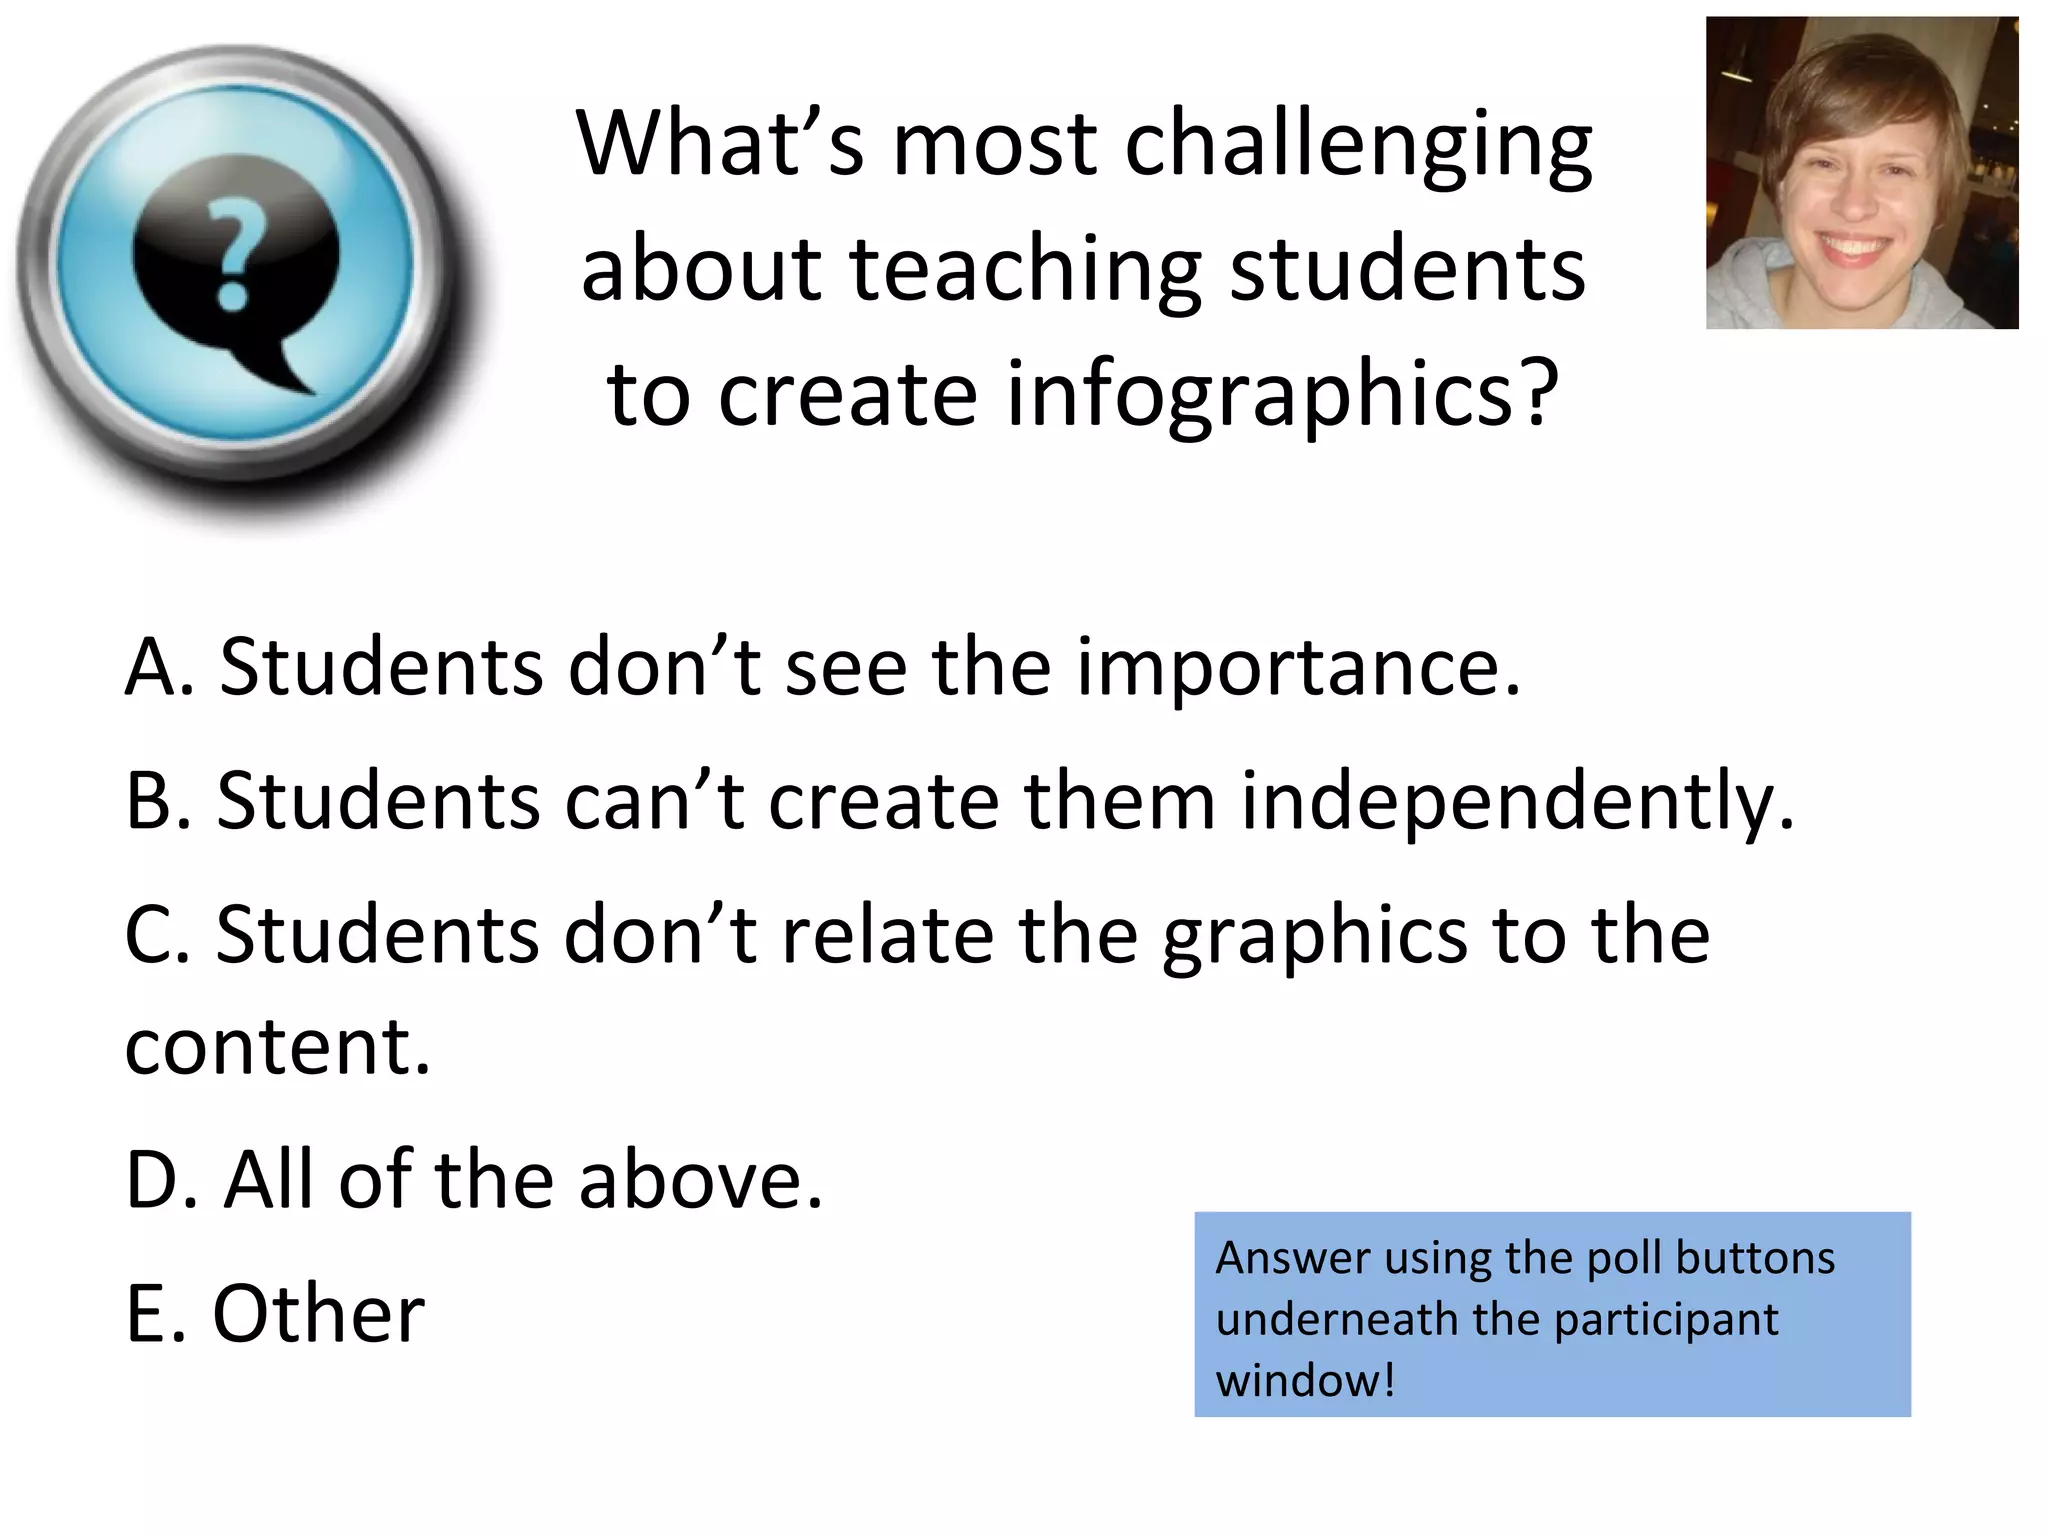
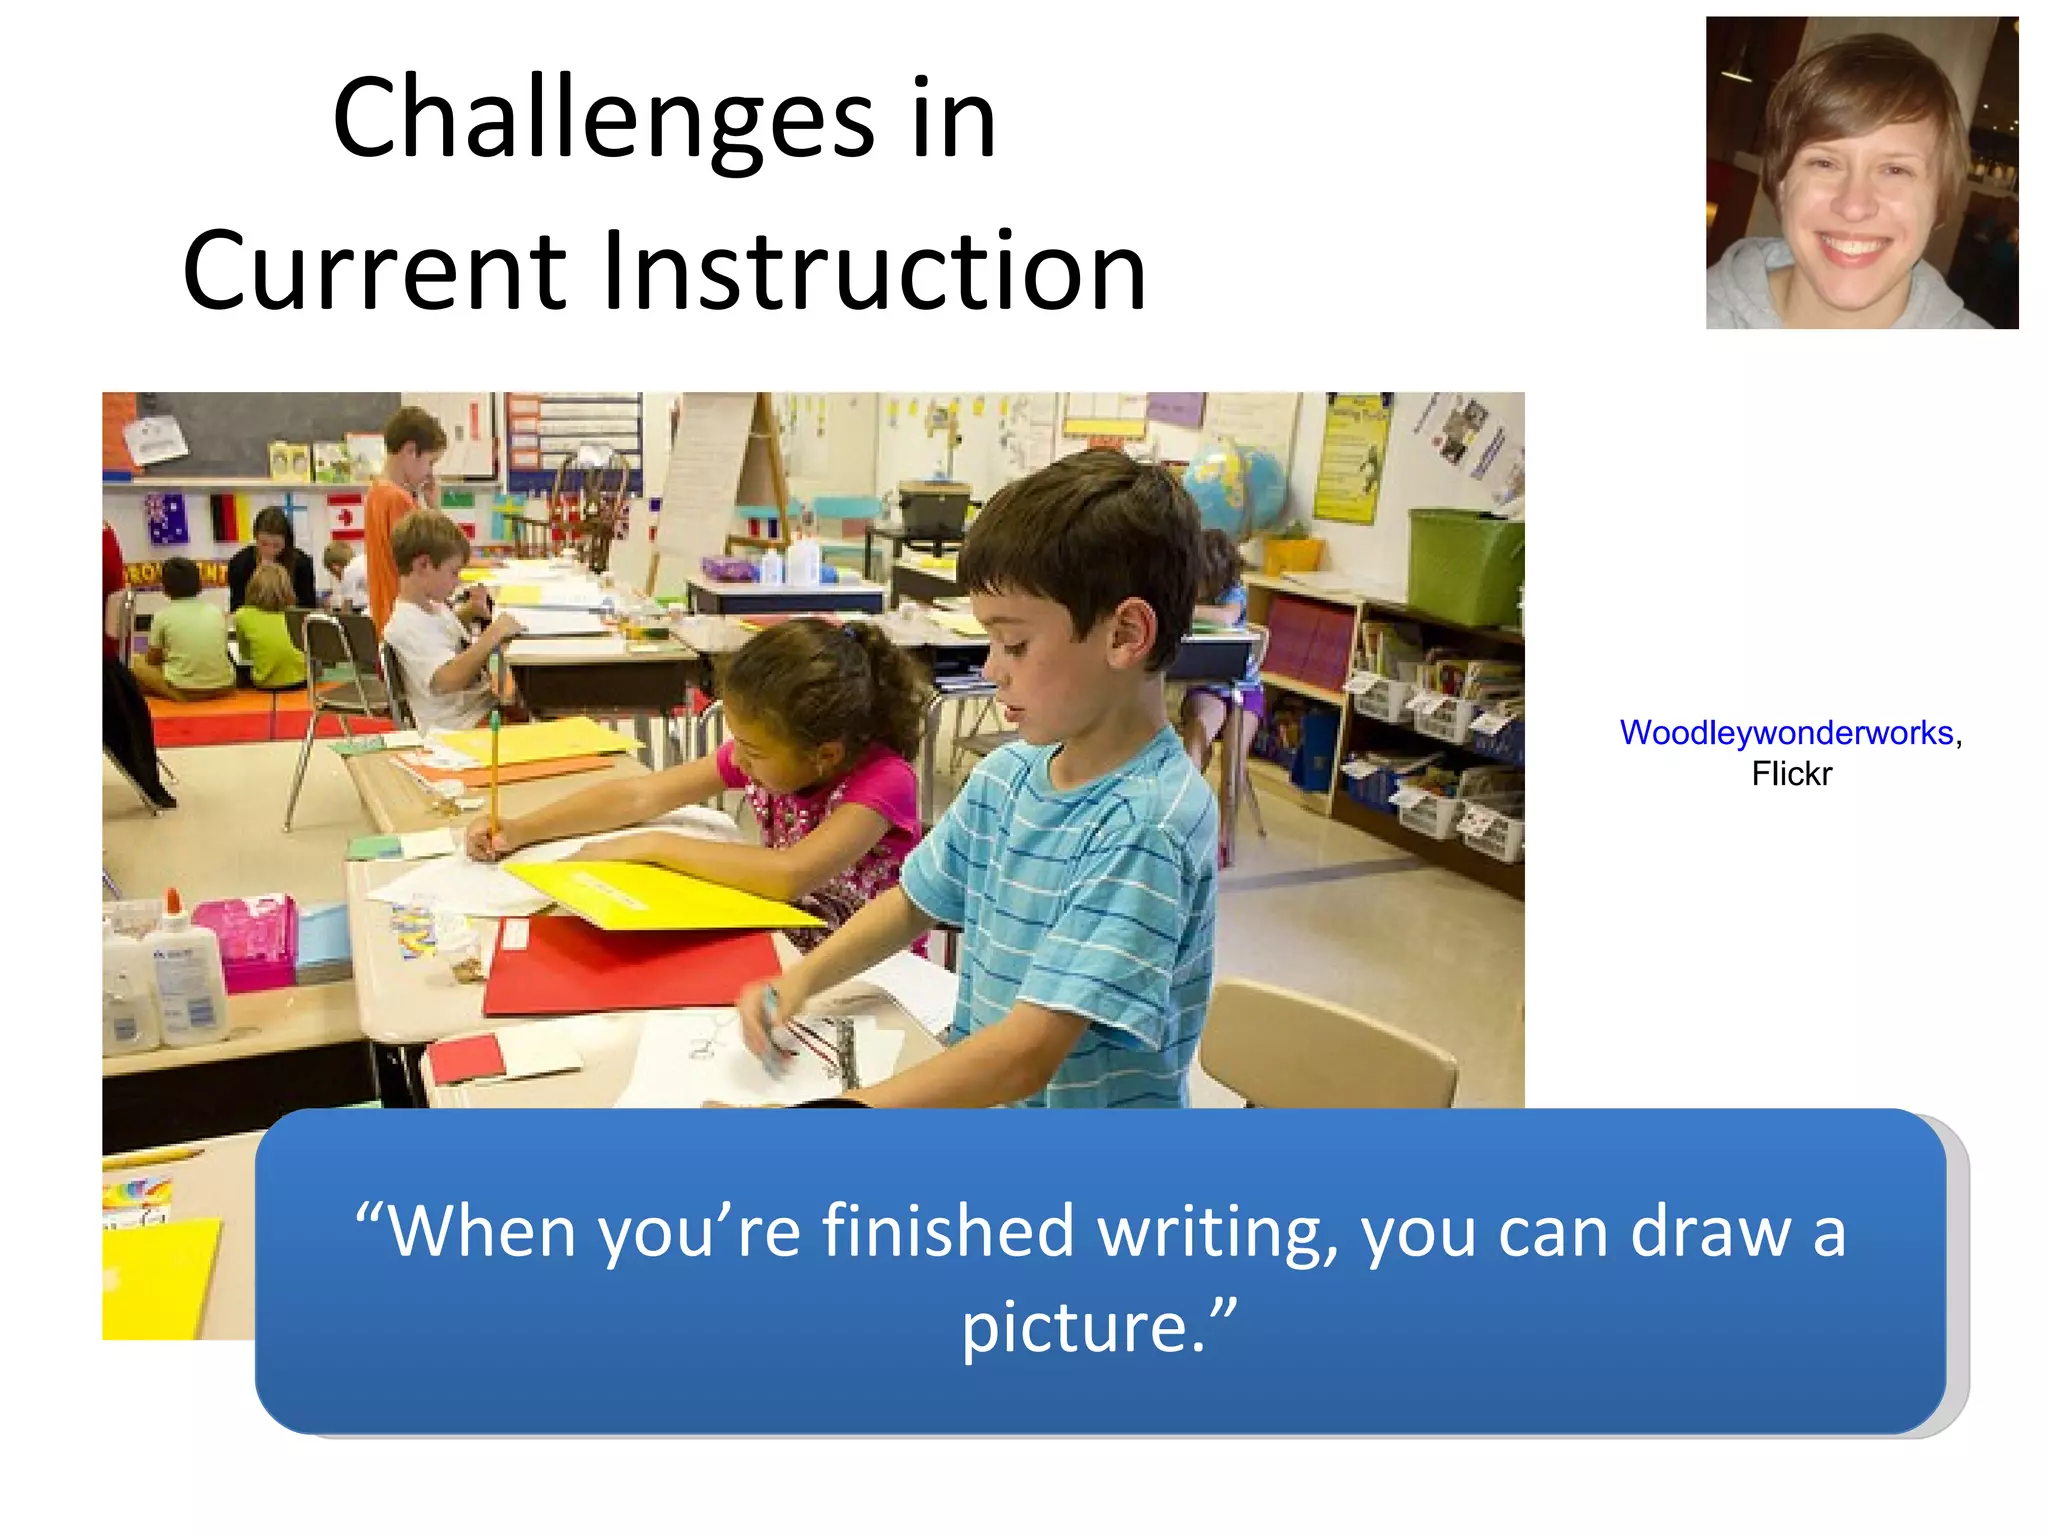
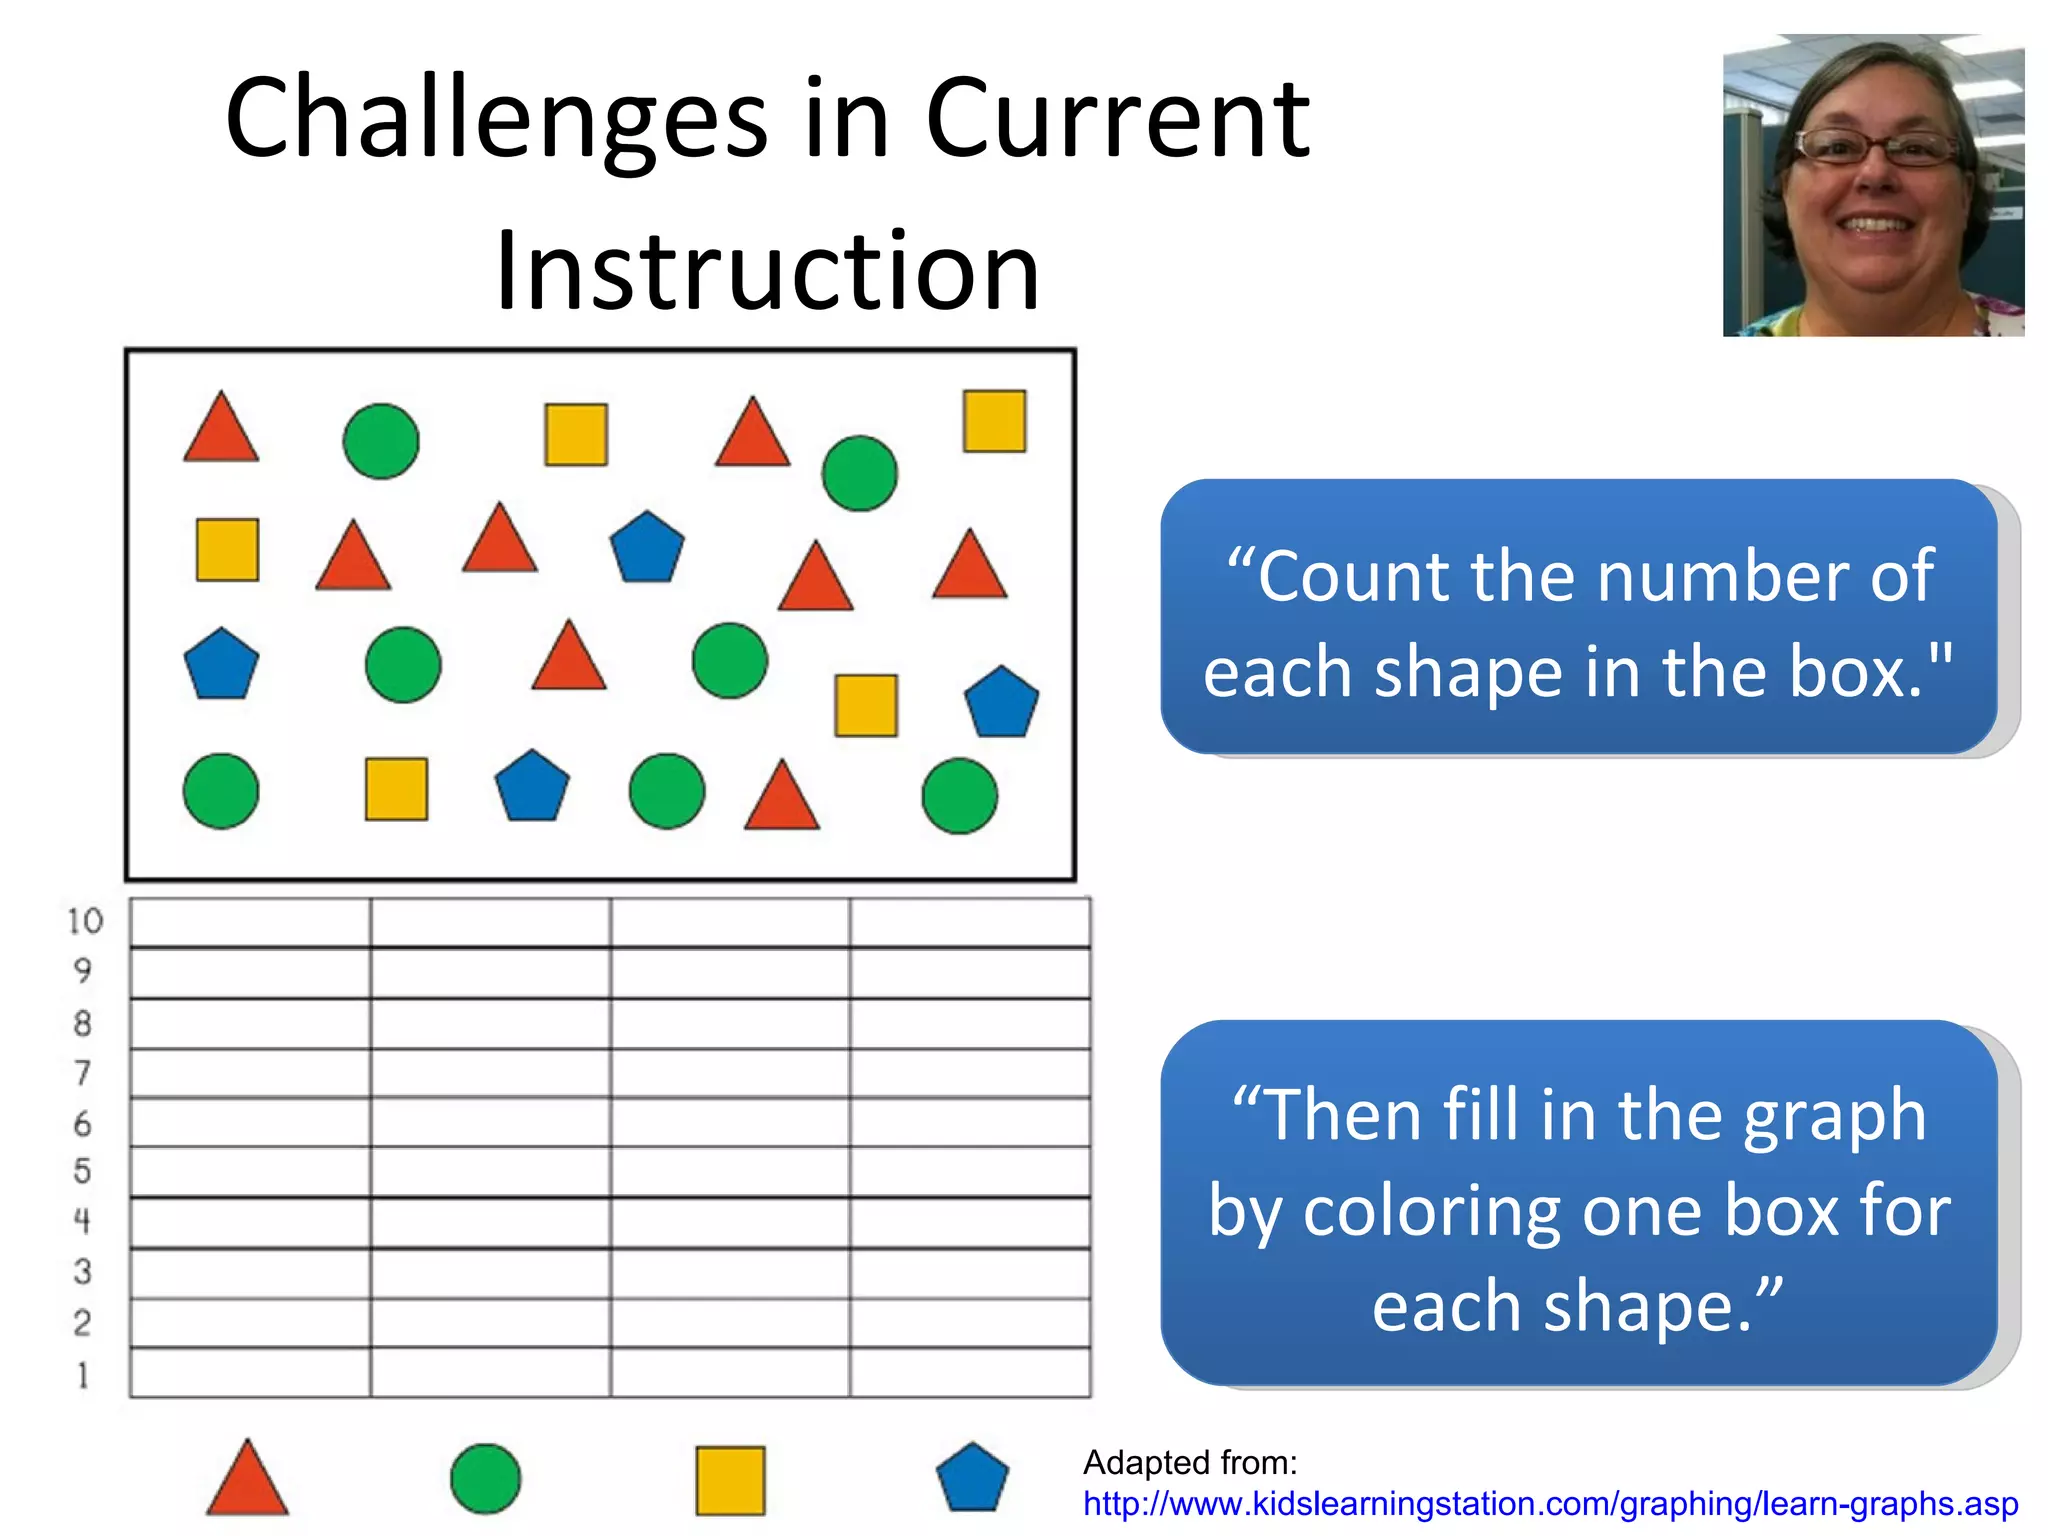
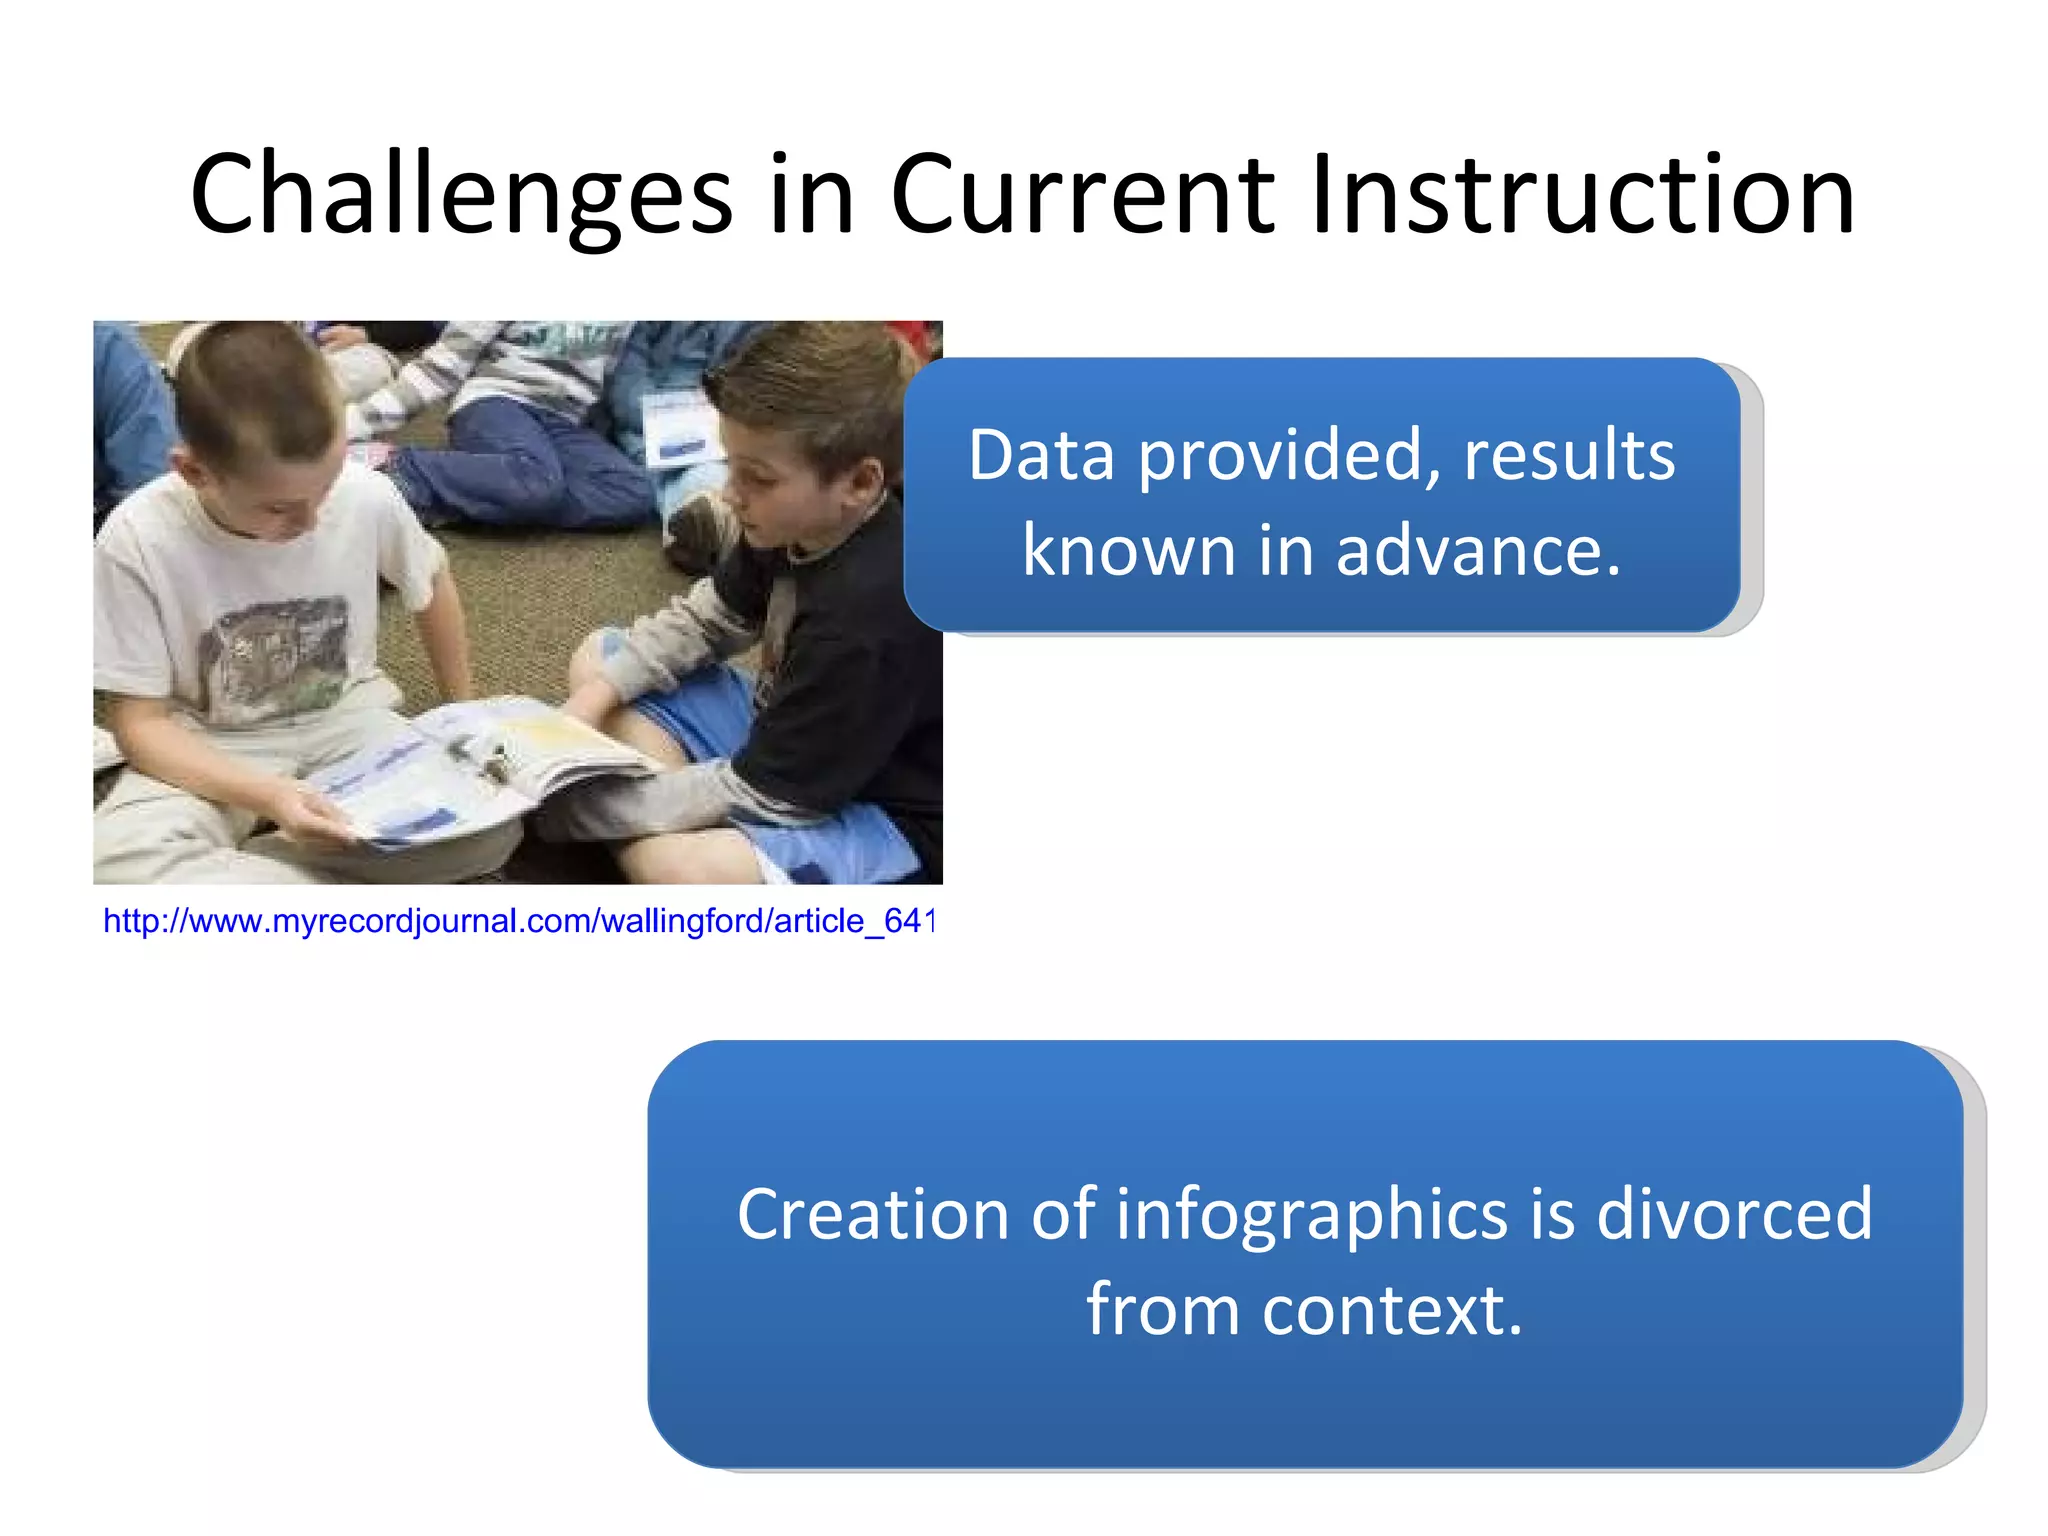
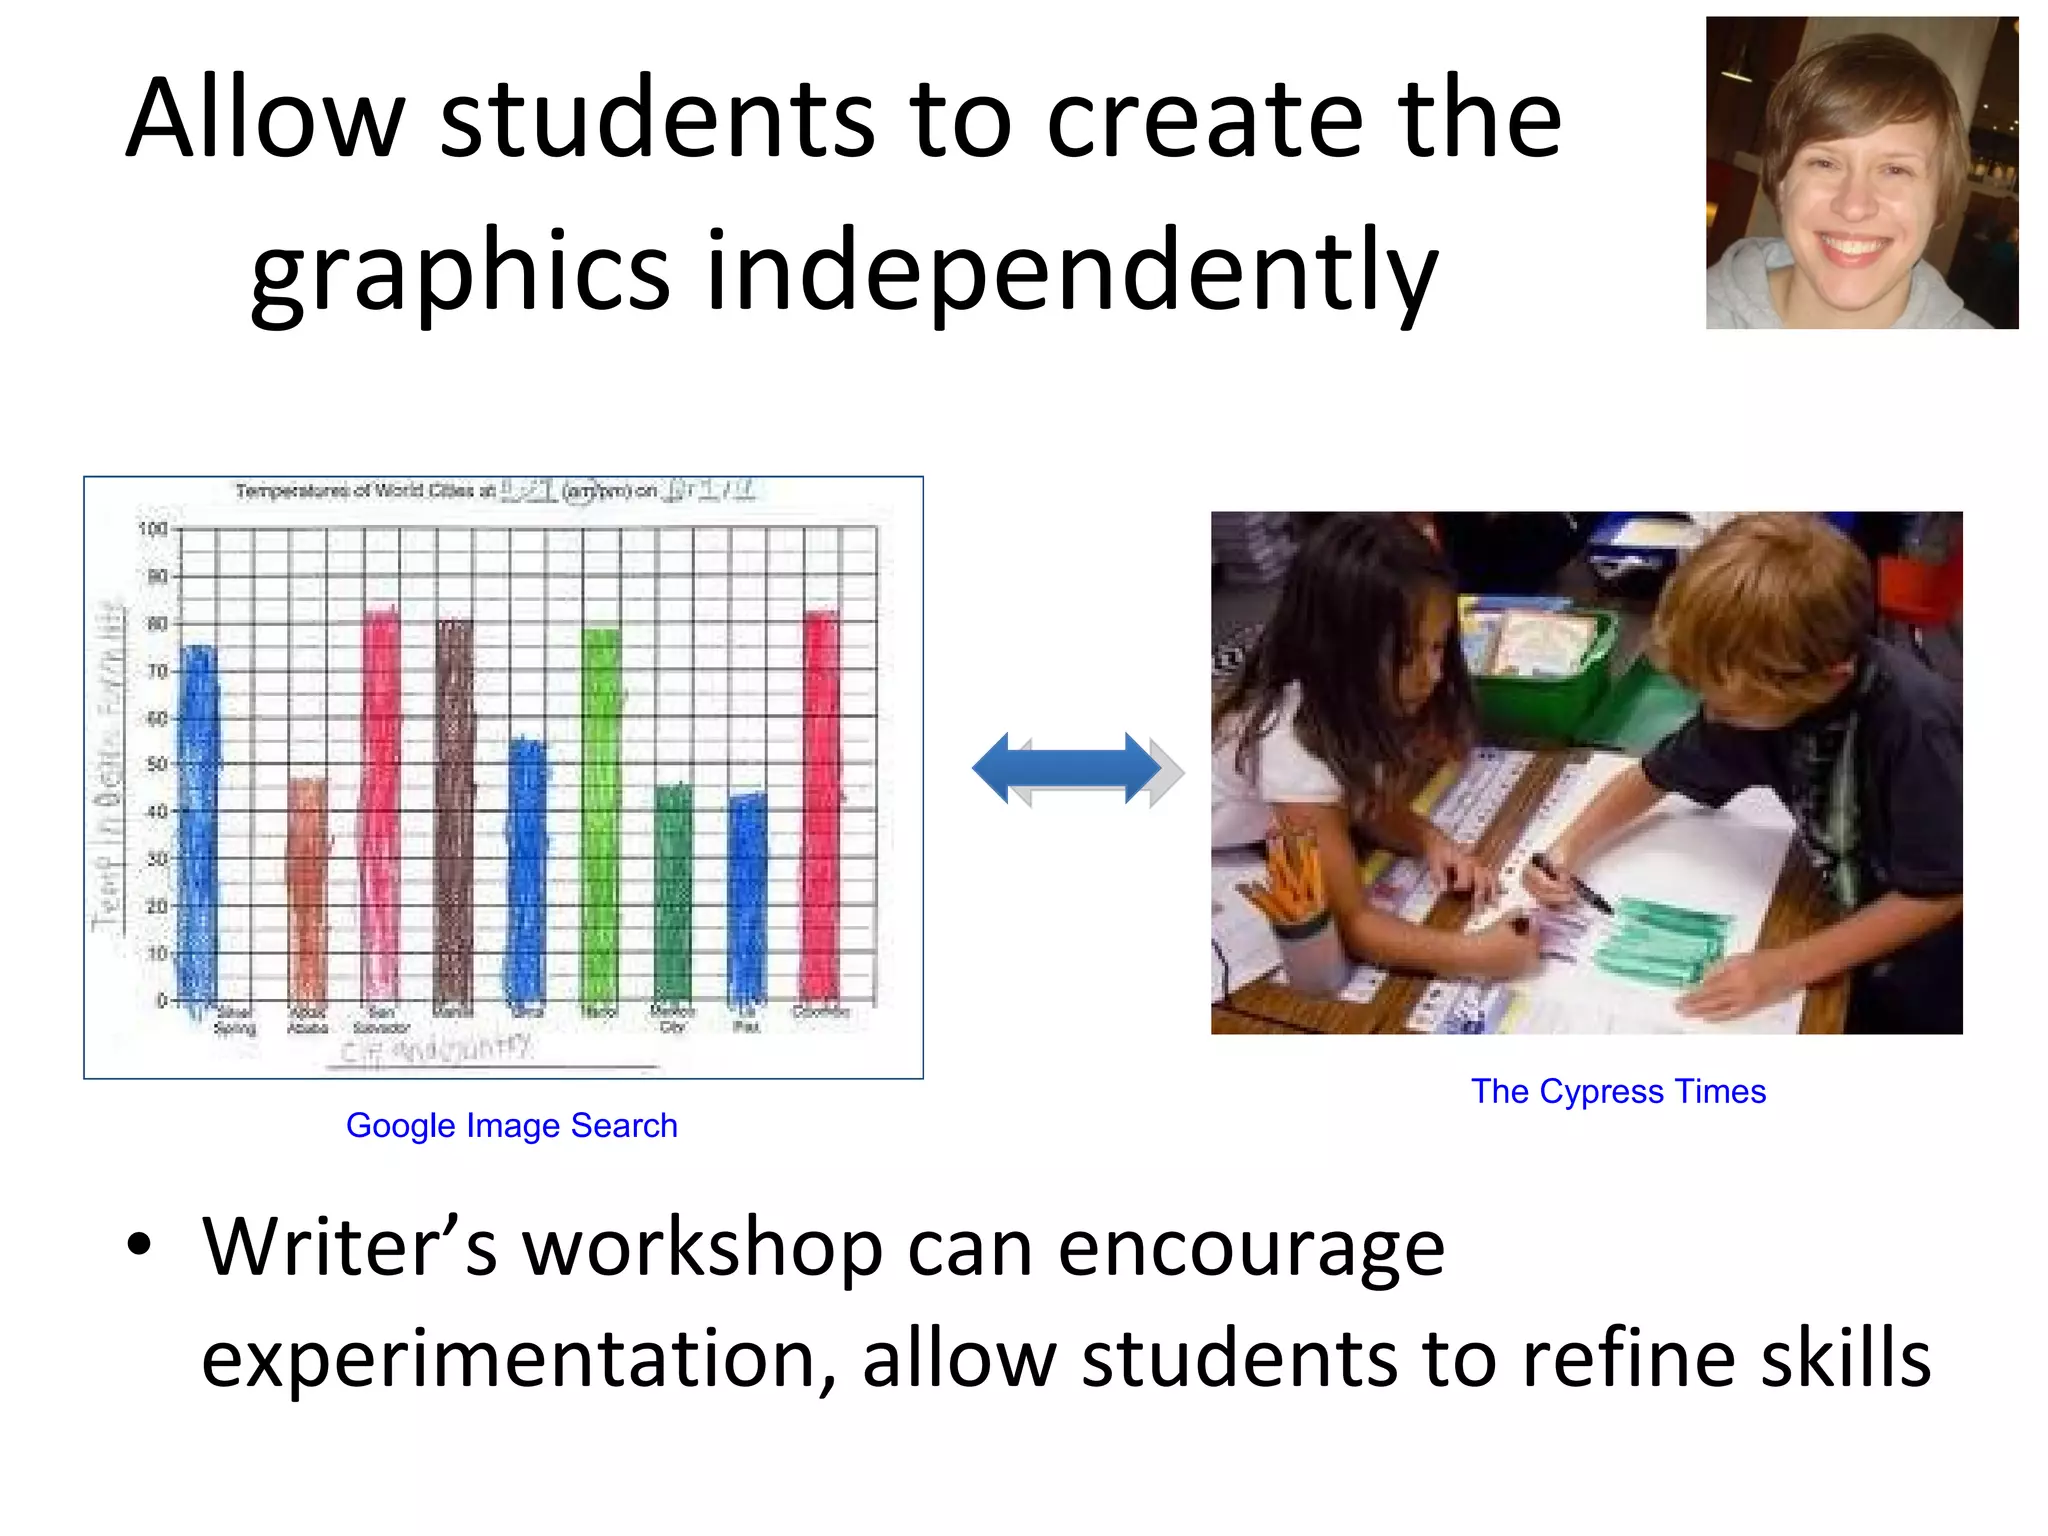

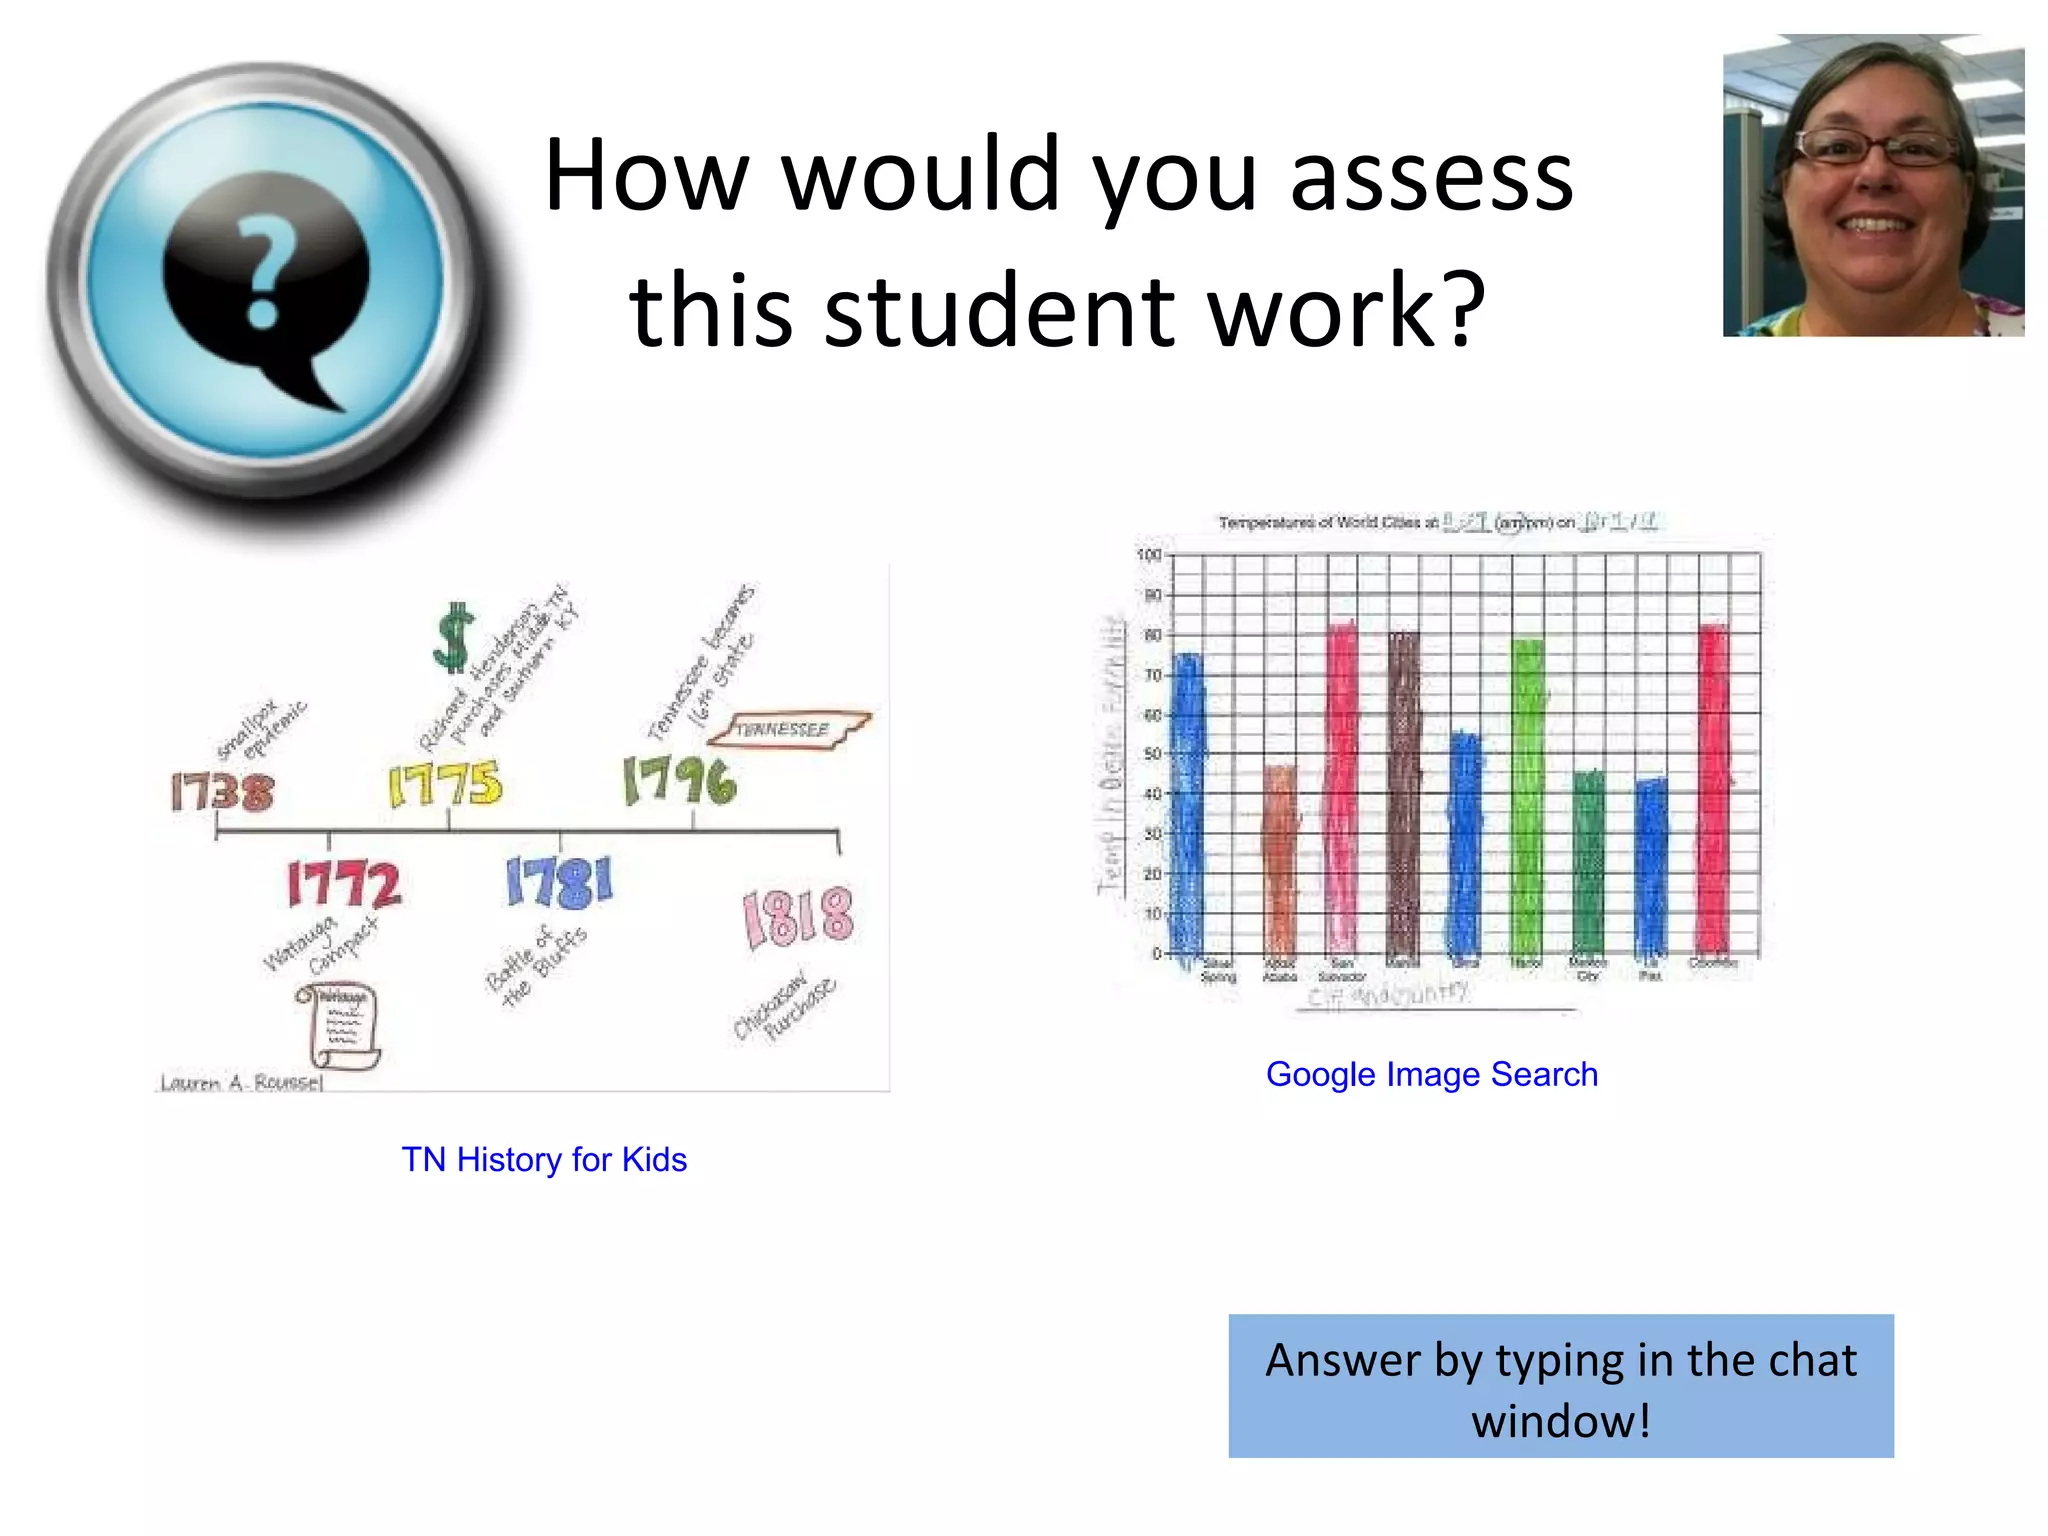
![Thank you! Jessica Fries-Gaither: [email_address] Terry Shiverdecker: [email_address] Today ’s slides available at: http://slidesha.re/visuallit2 Archived recording at: http://wiki.nsdl.org/index.php/BeyondPenguins/Seminars](https://image.slidesharecdn.com/visualliteracy2-110414133215-phpapp01/75/Visual-Literacy-Part-2-31-2048.jpg)
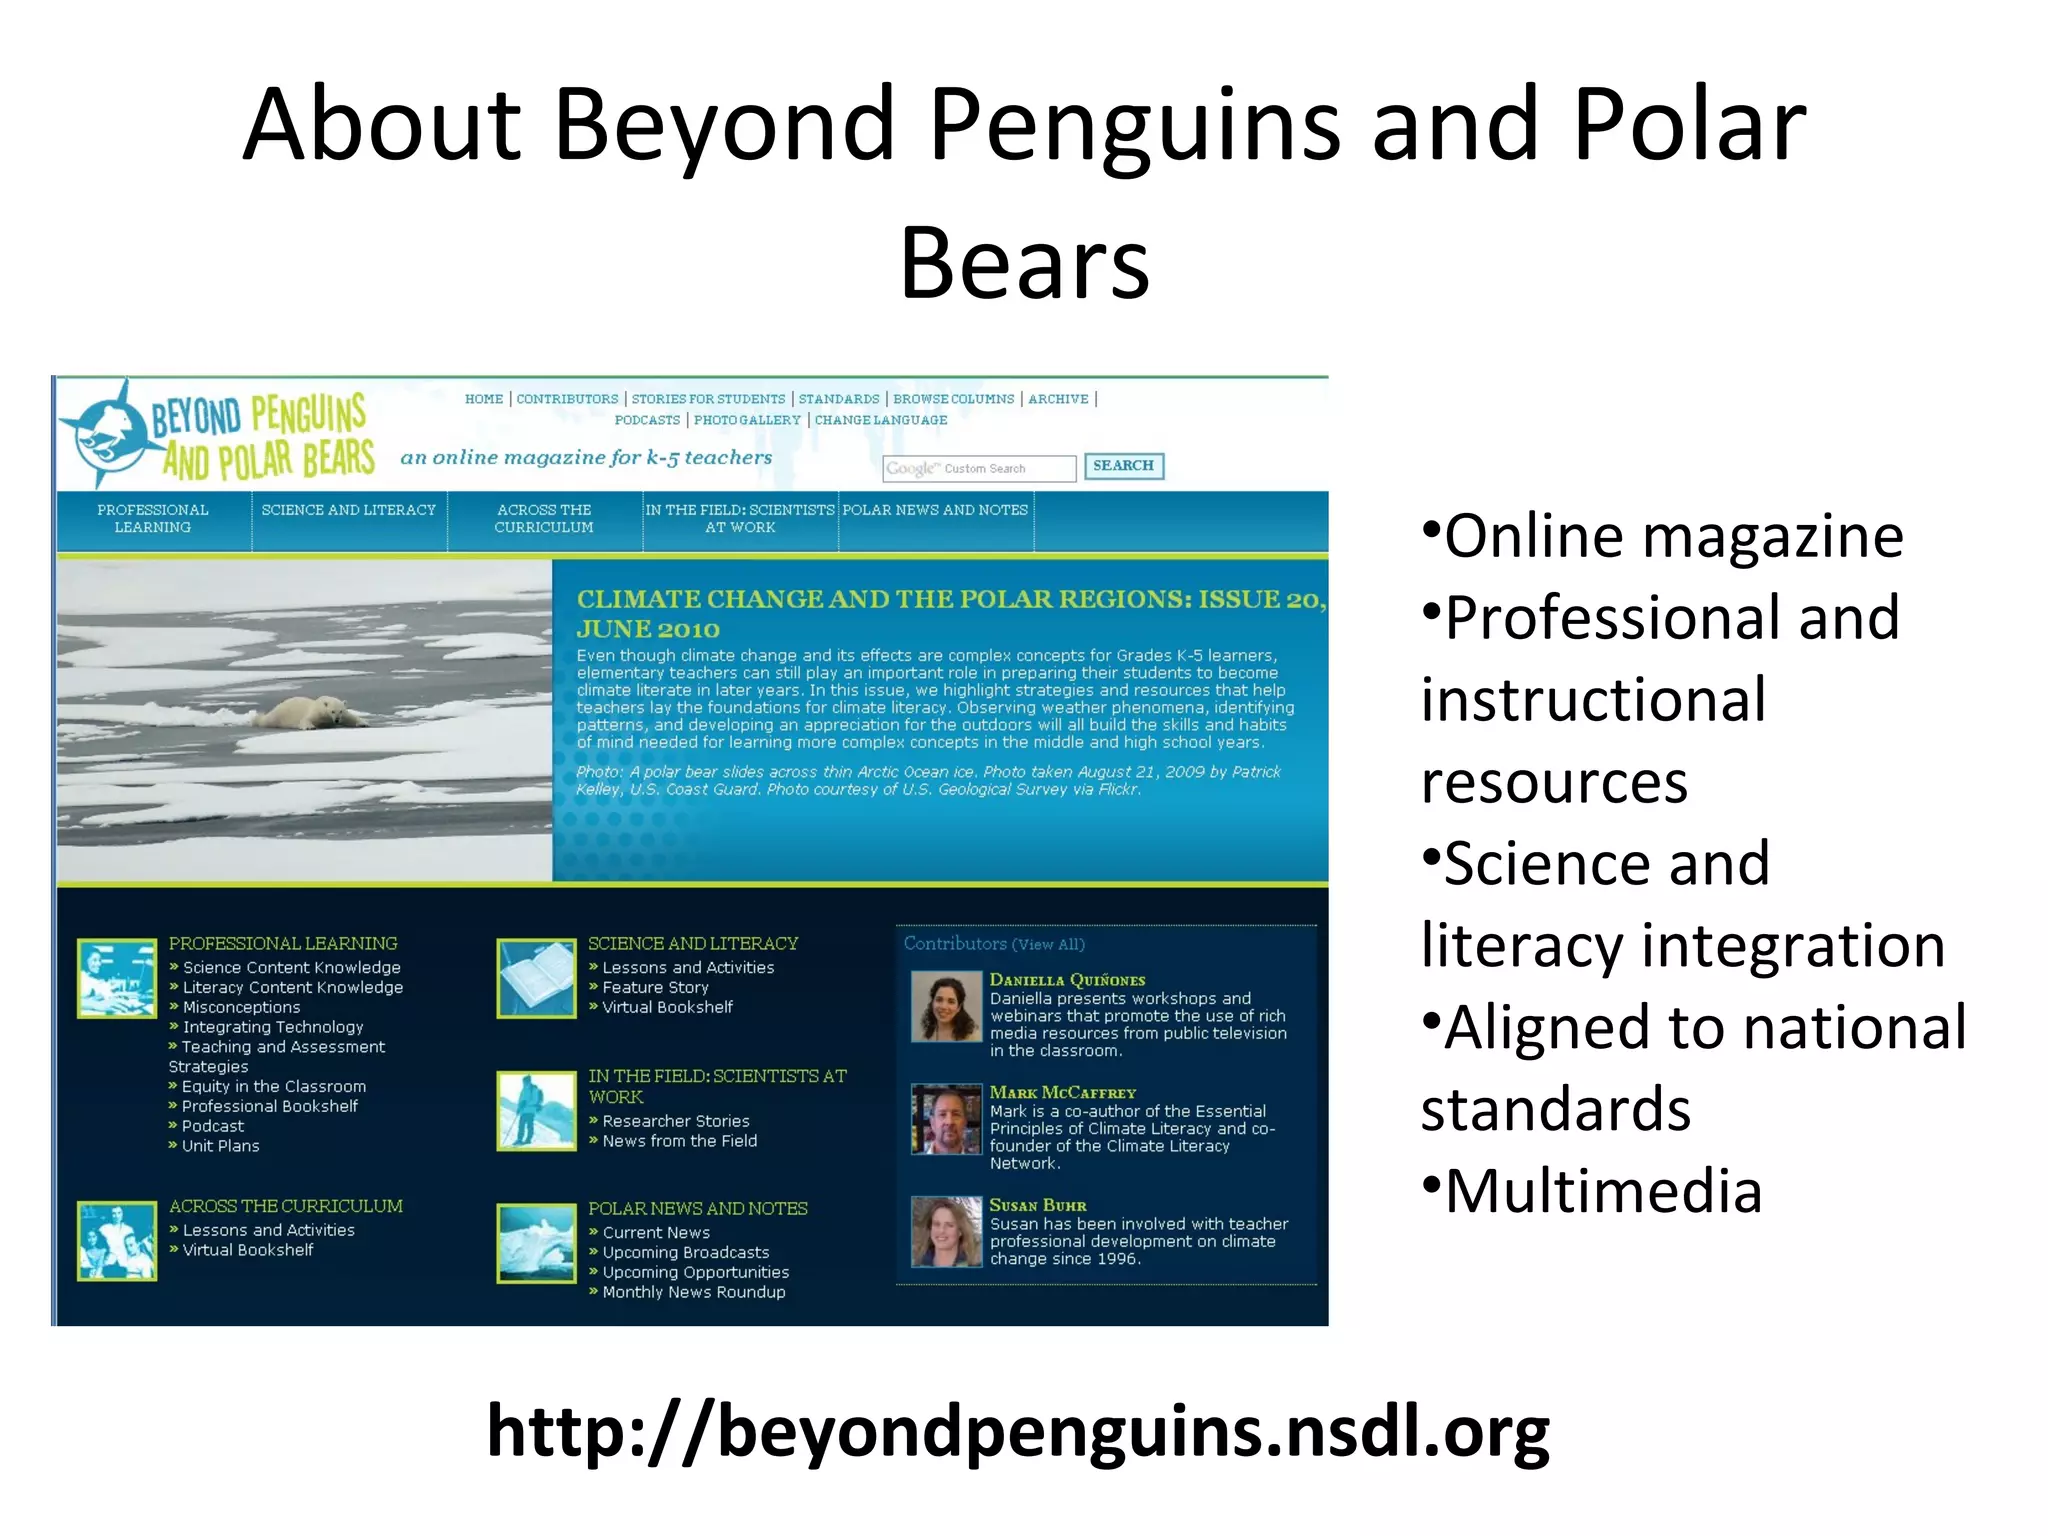
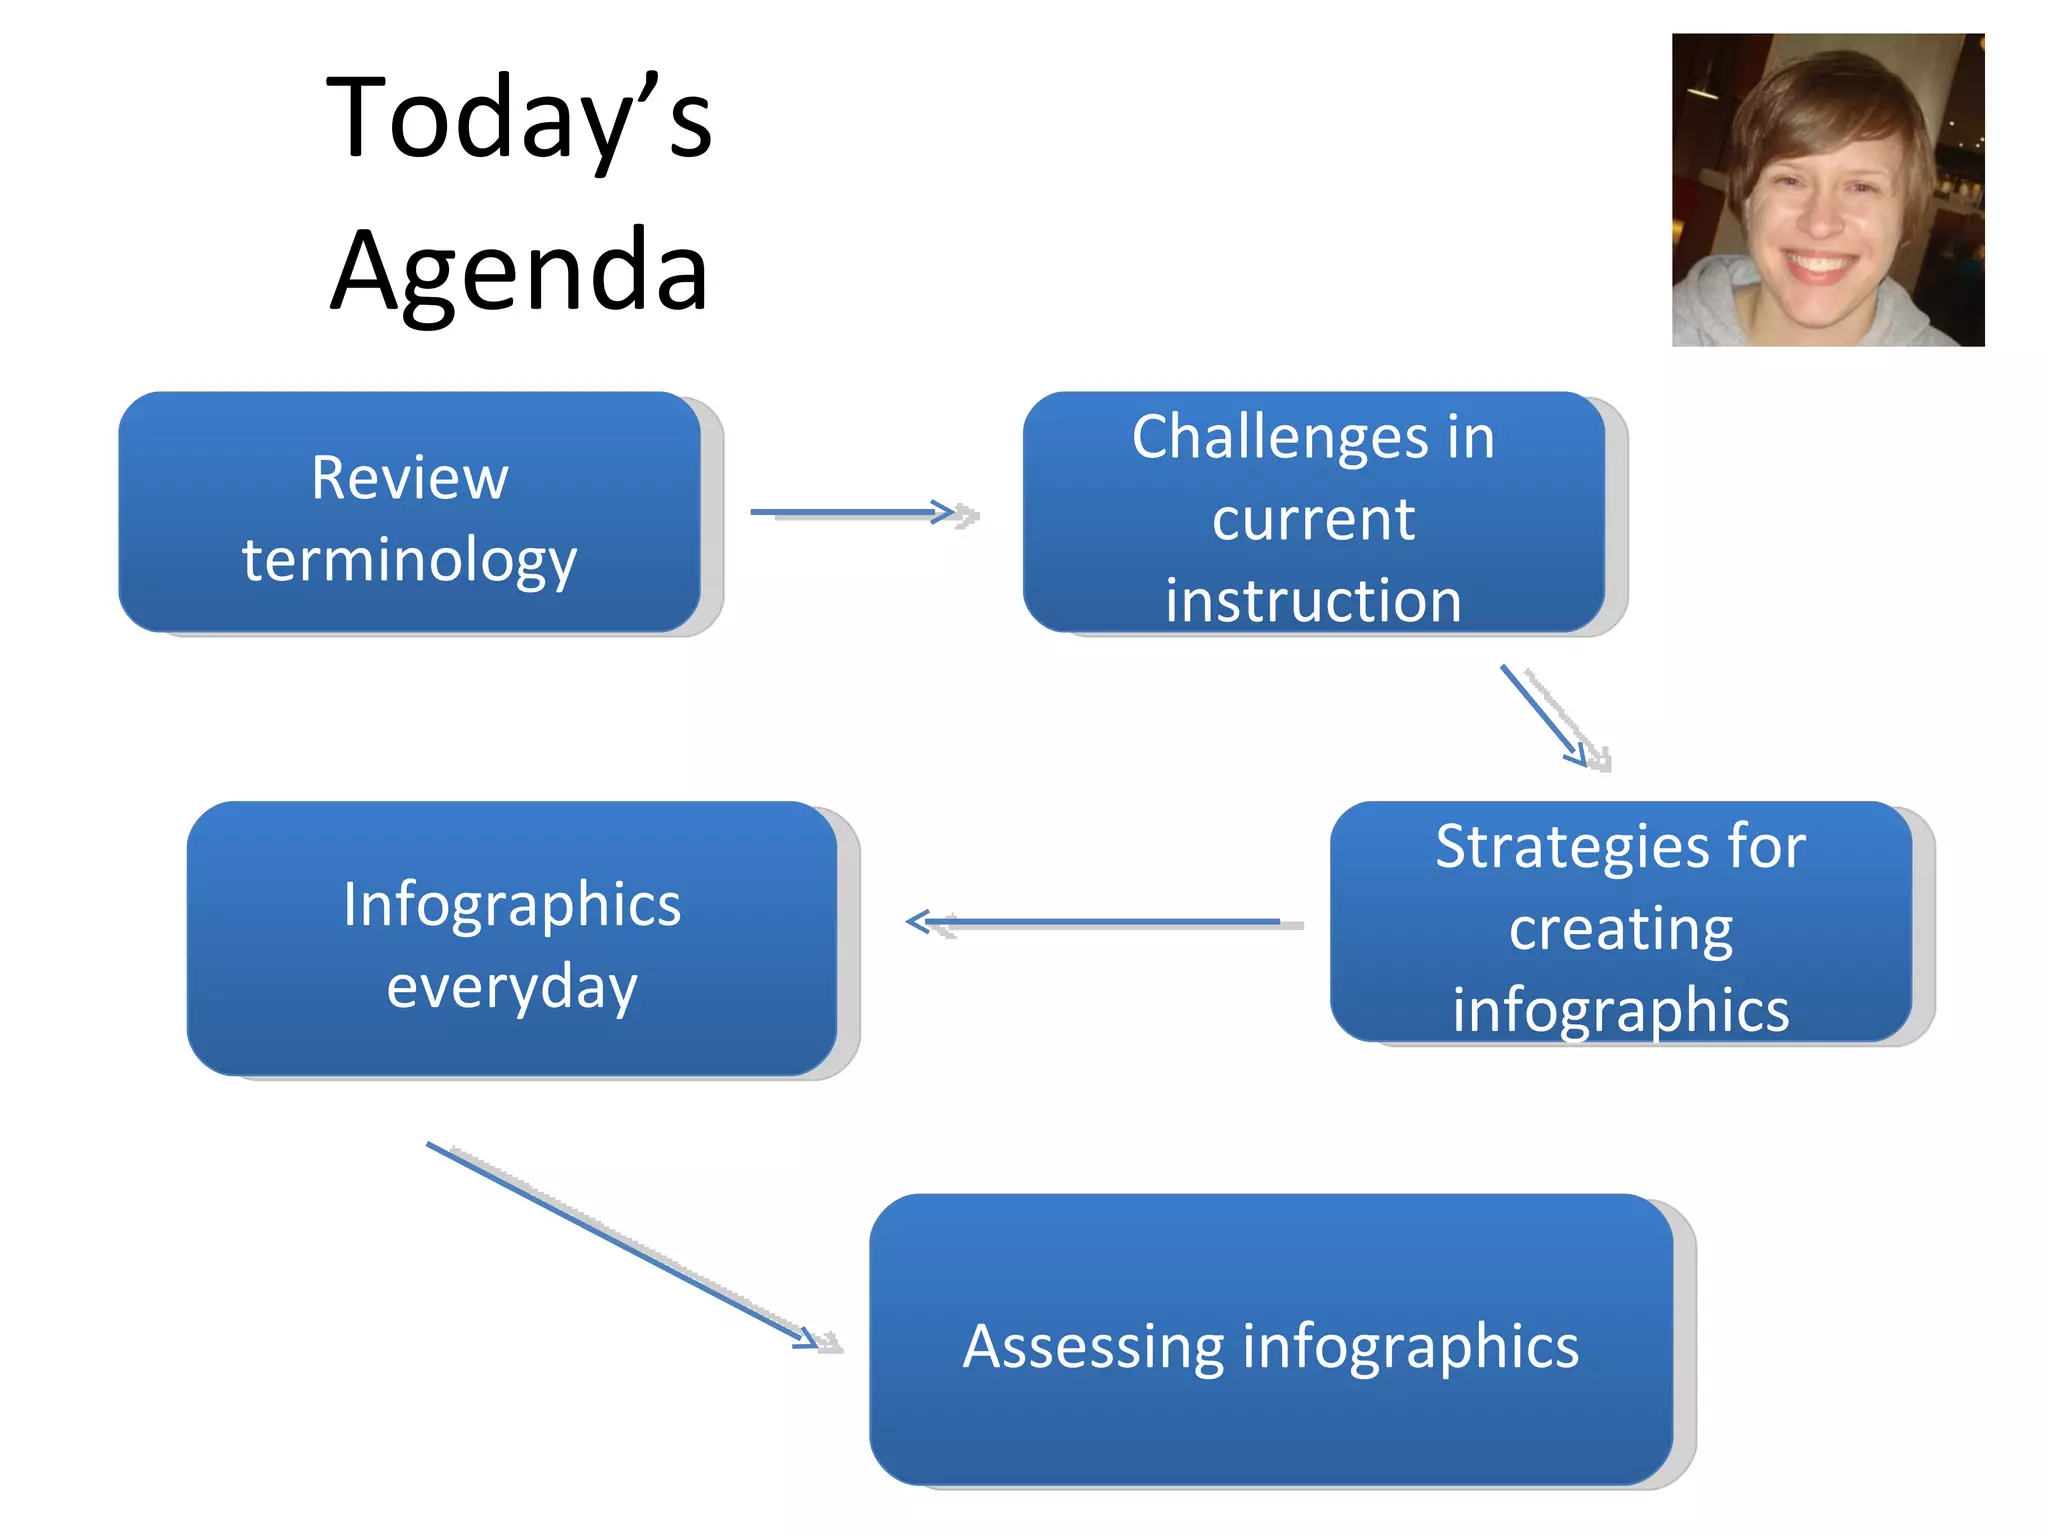
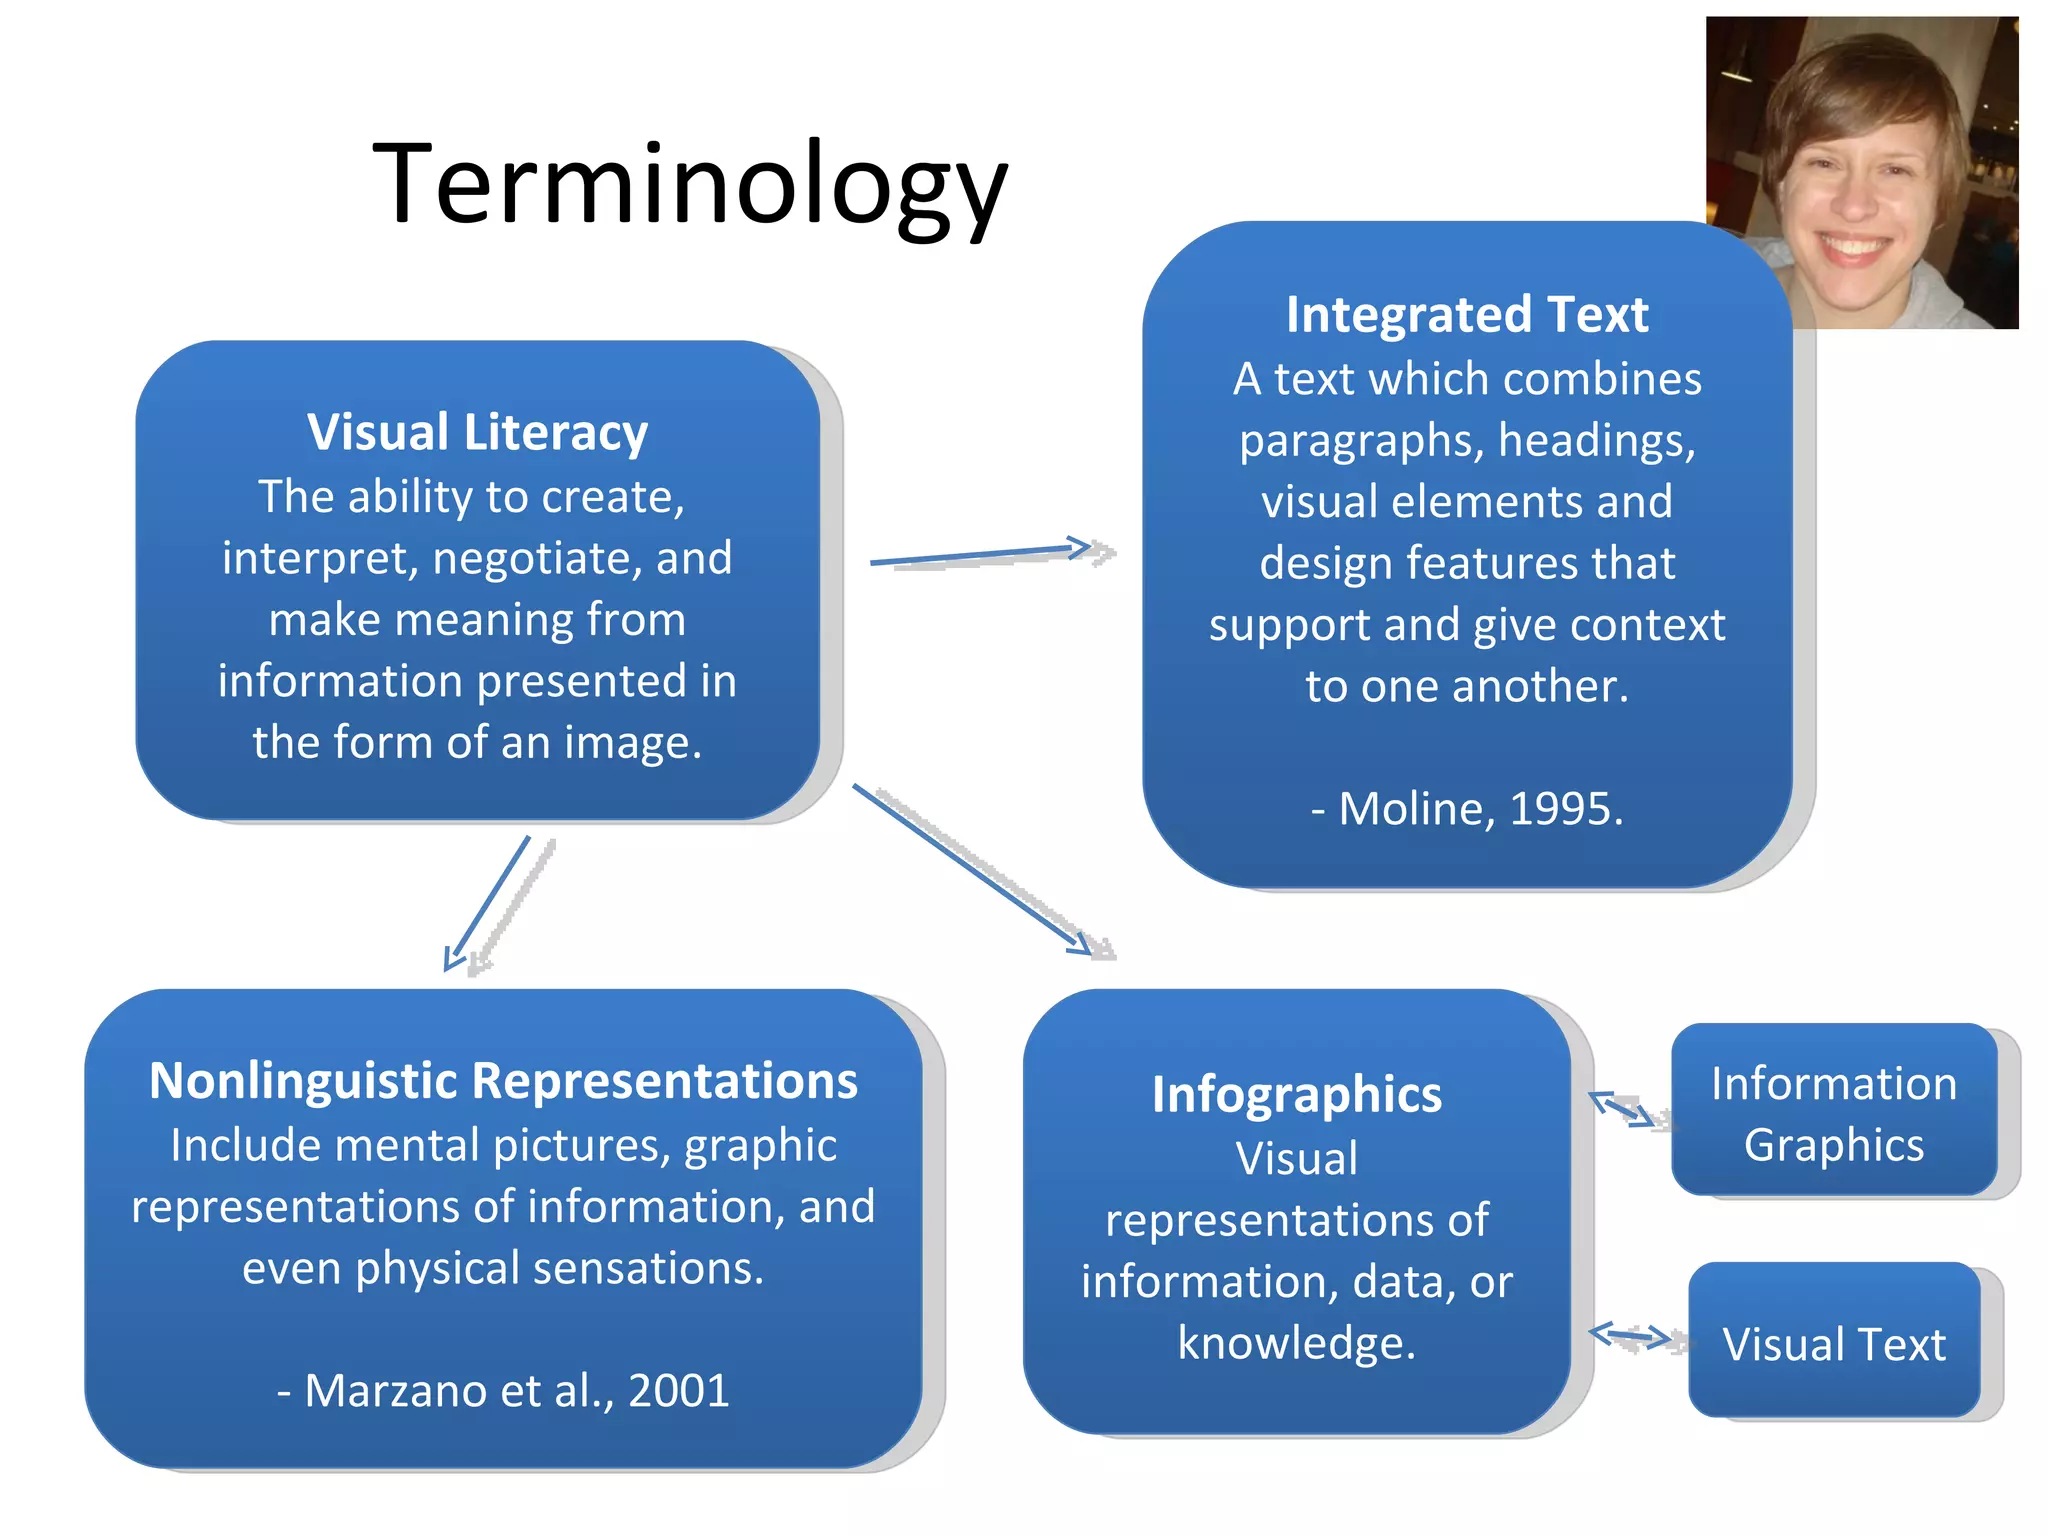
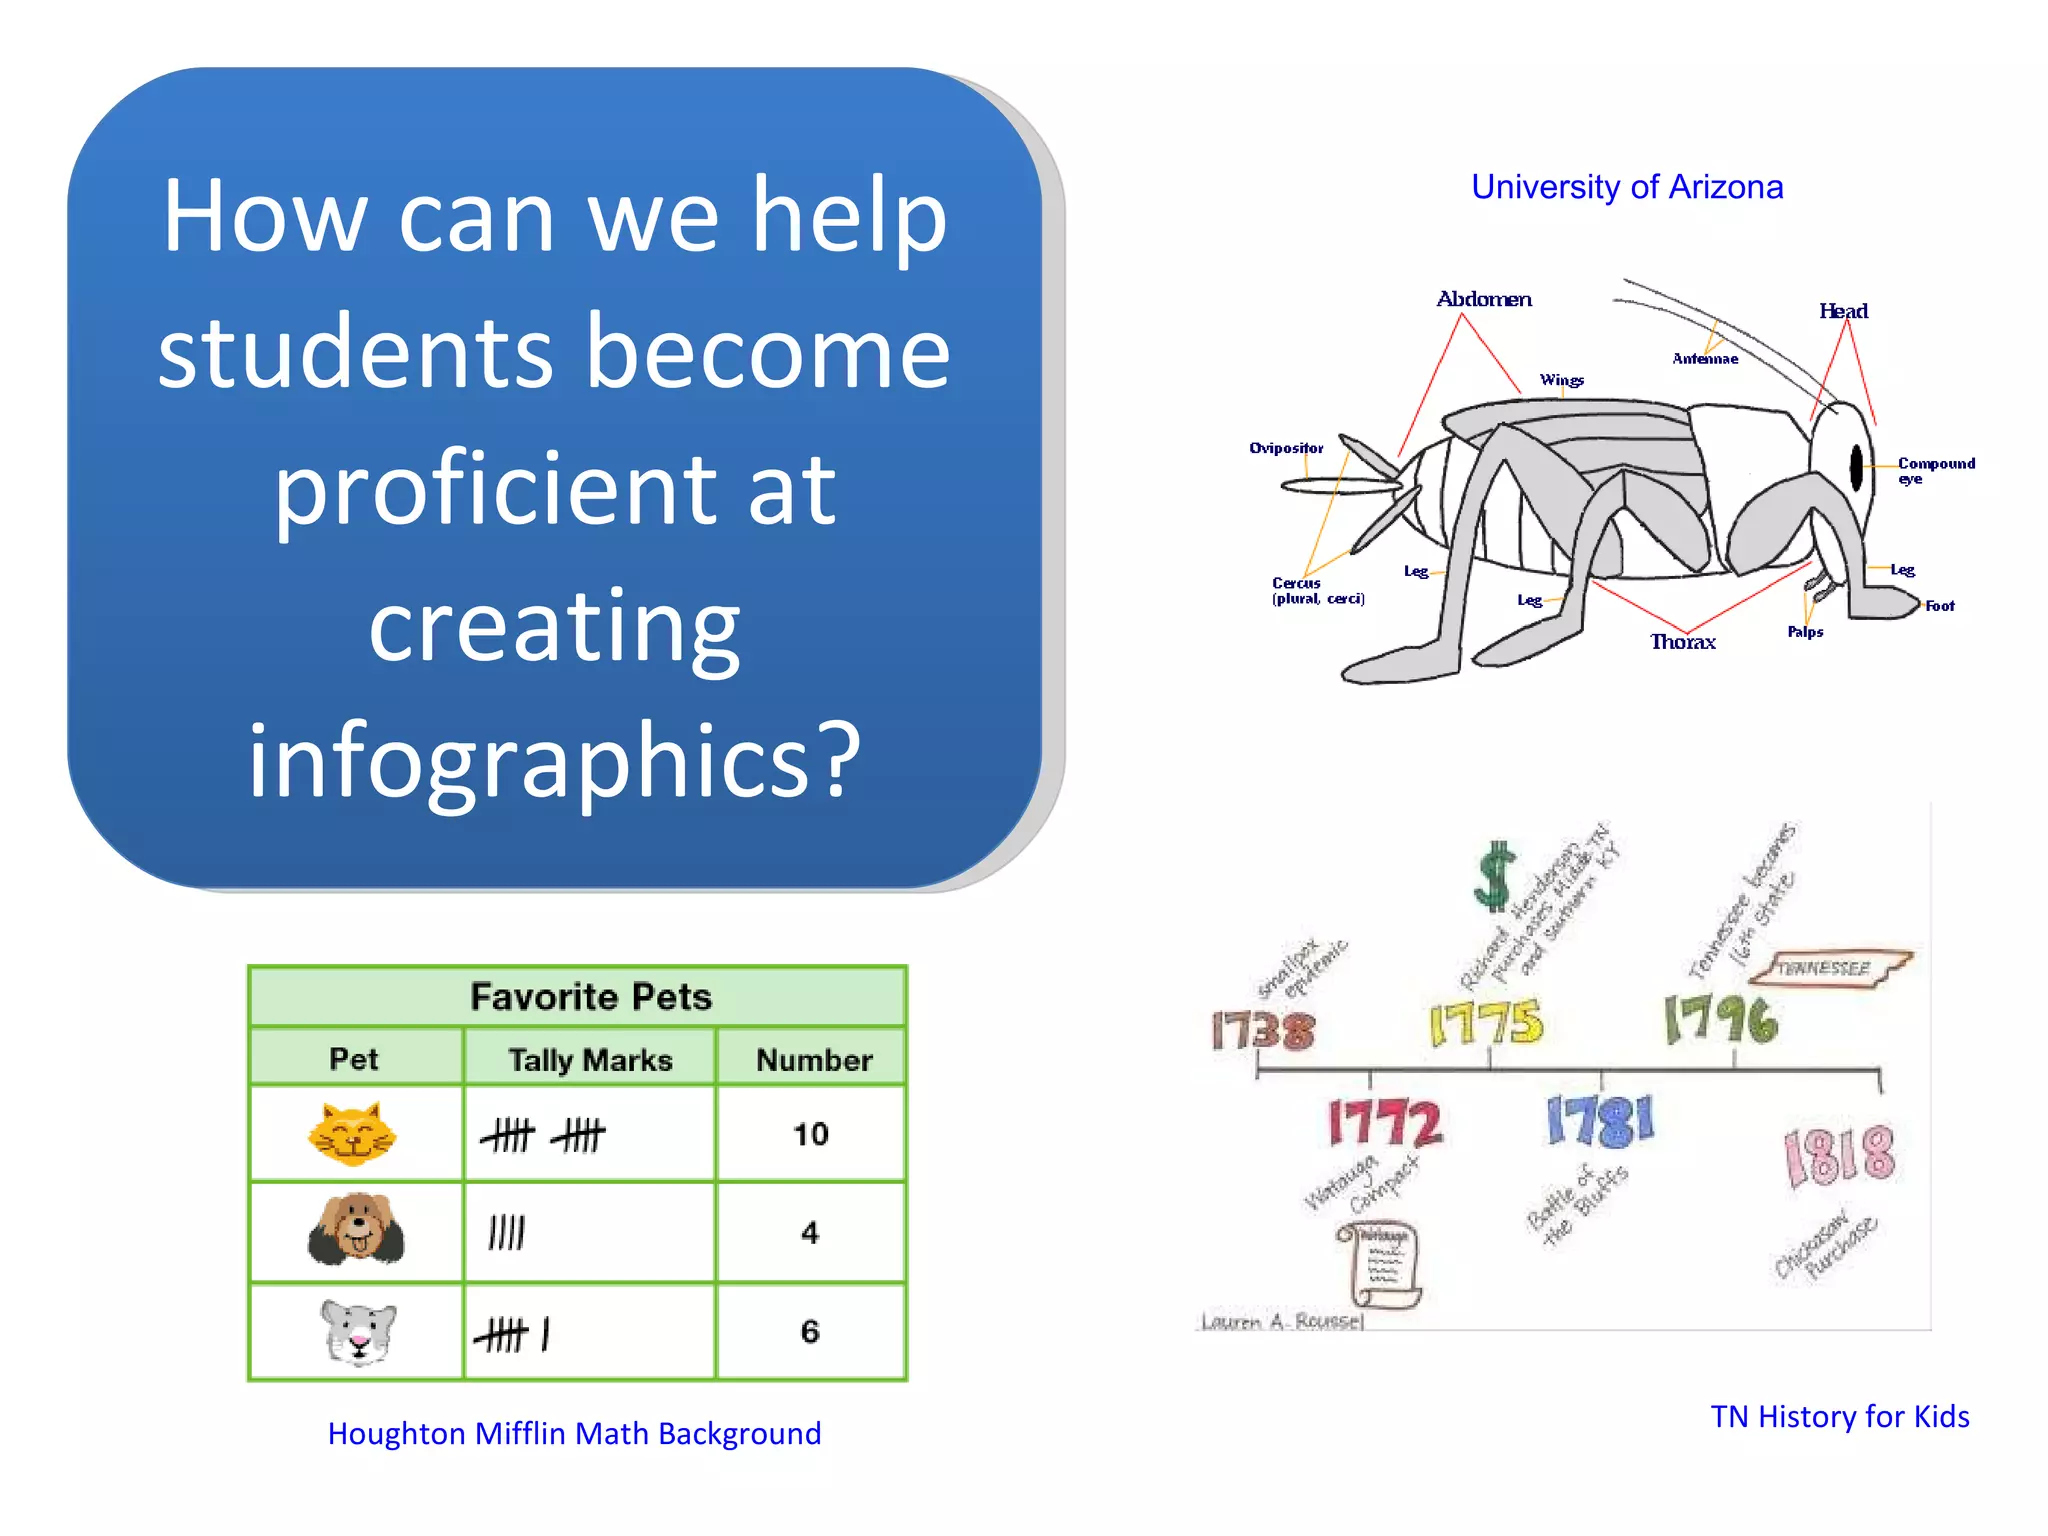
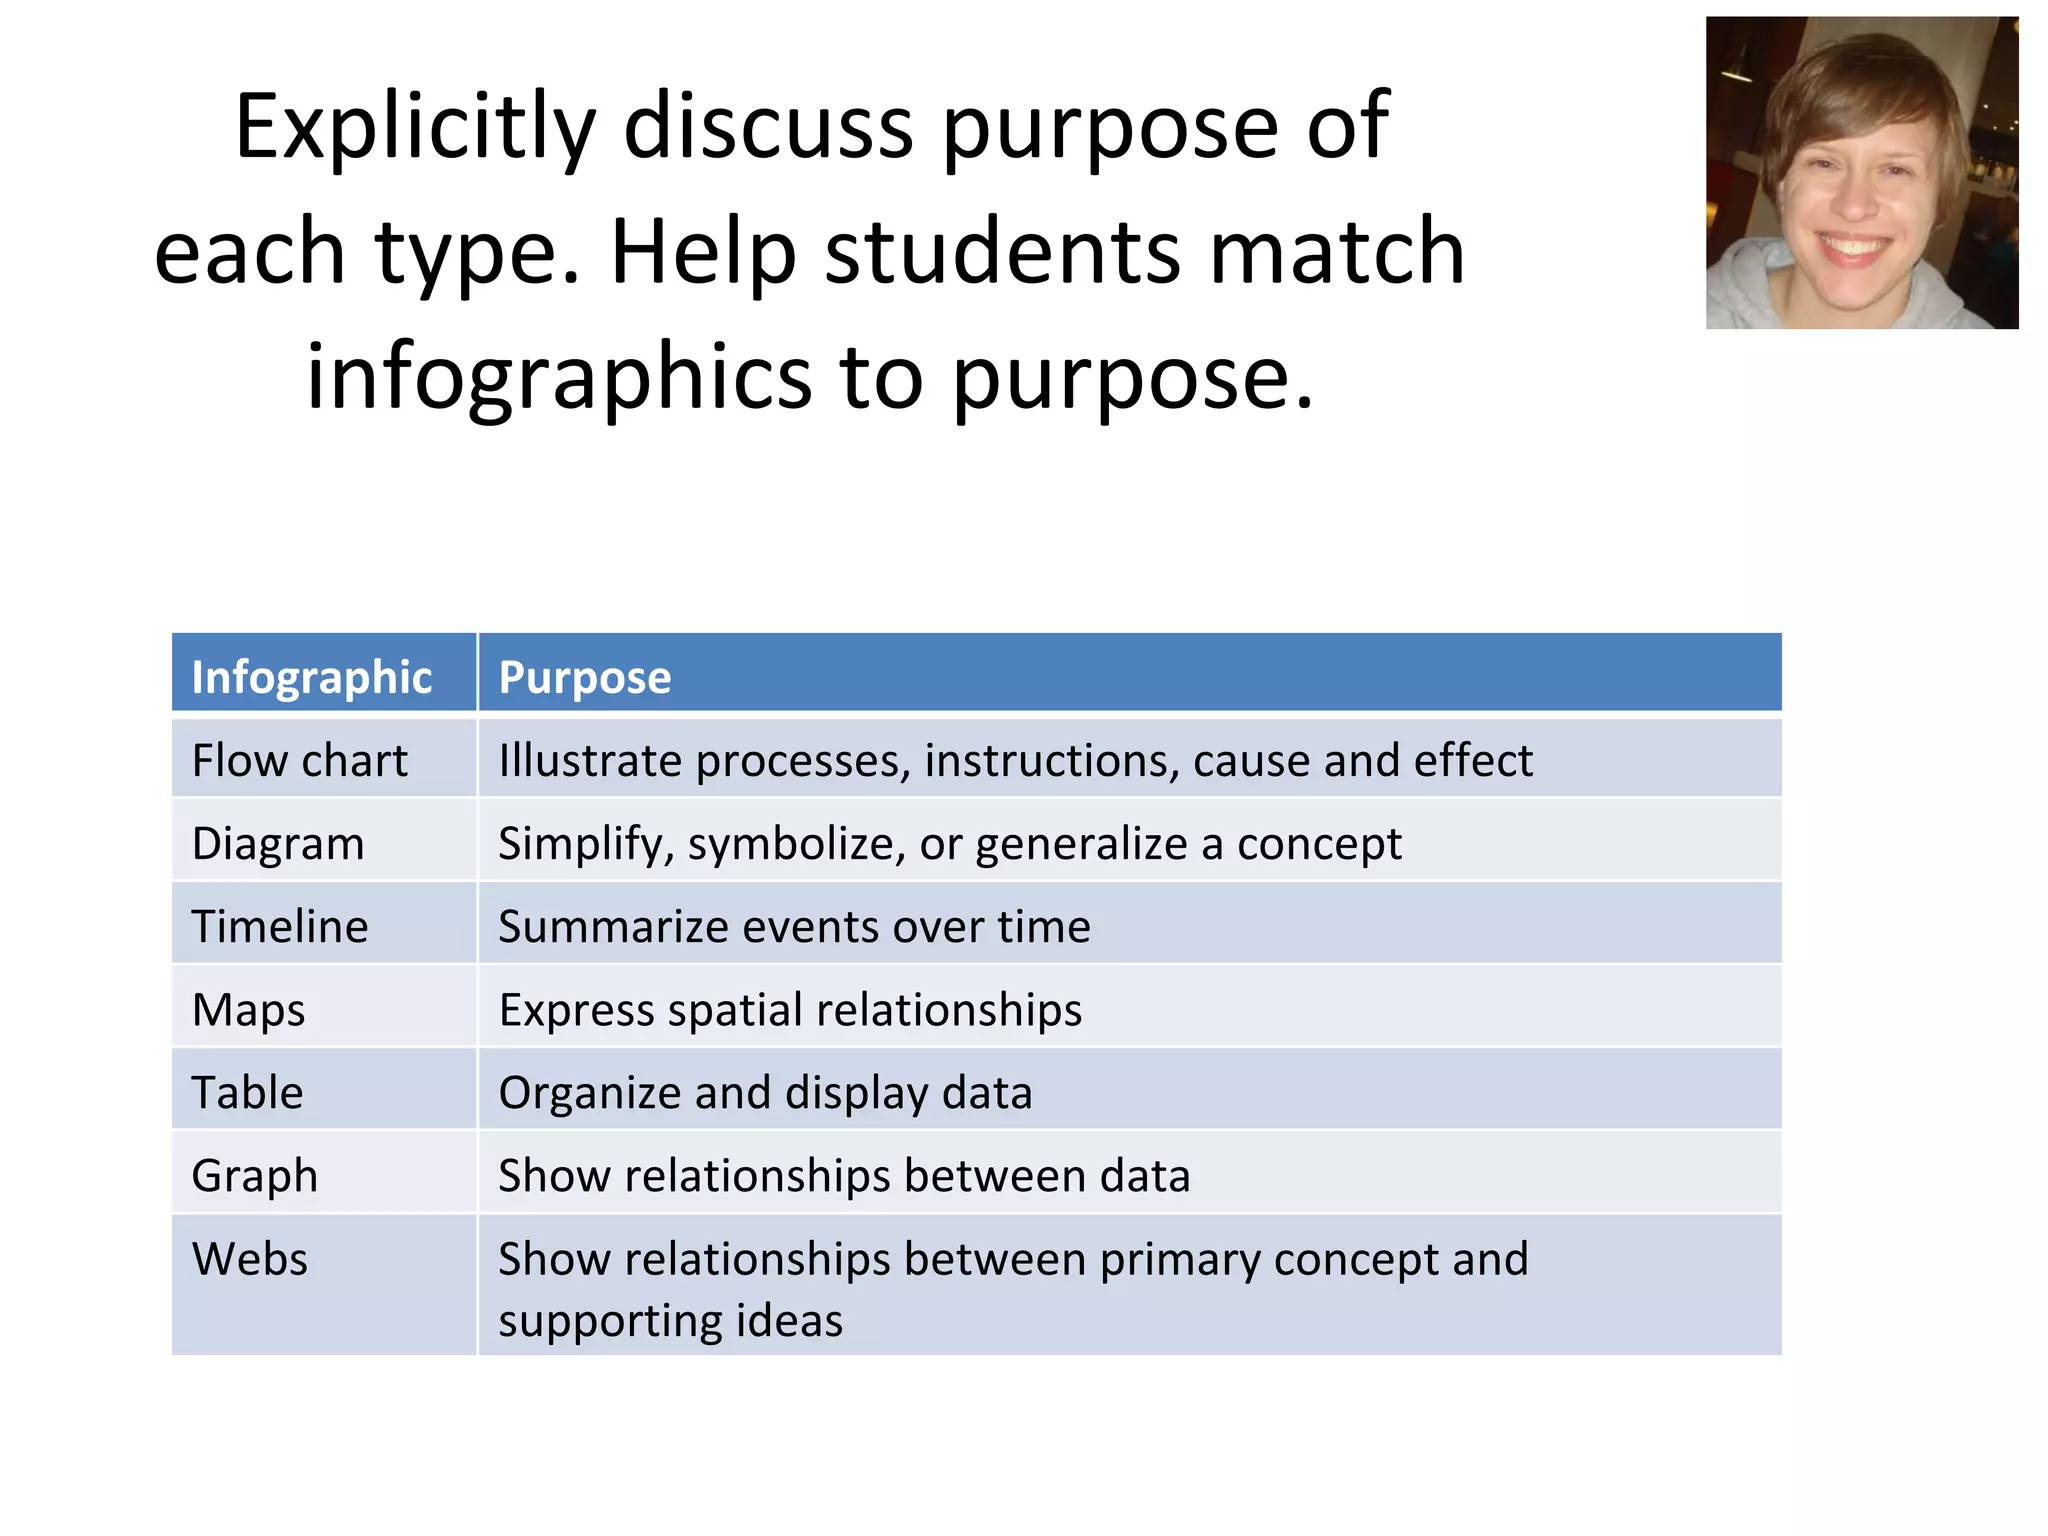
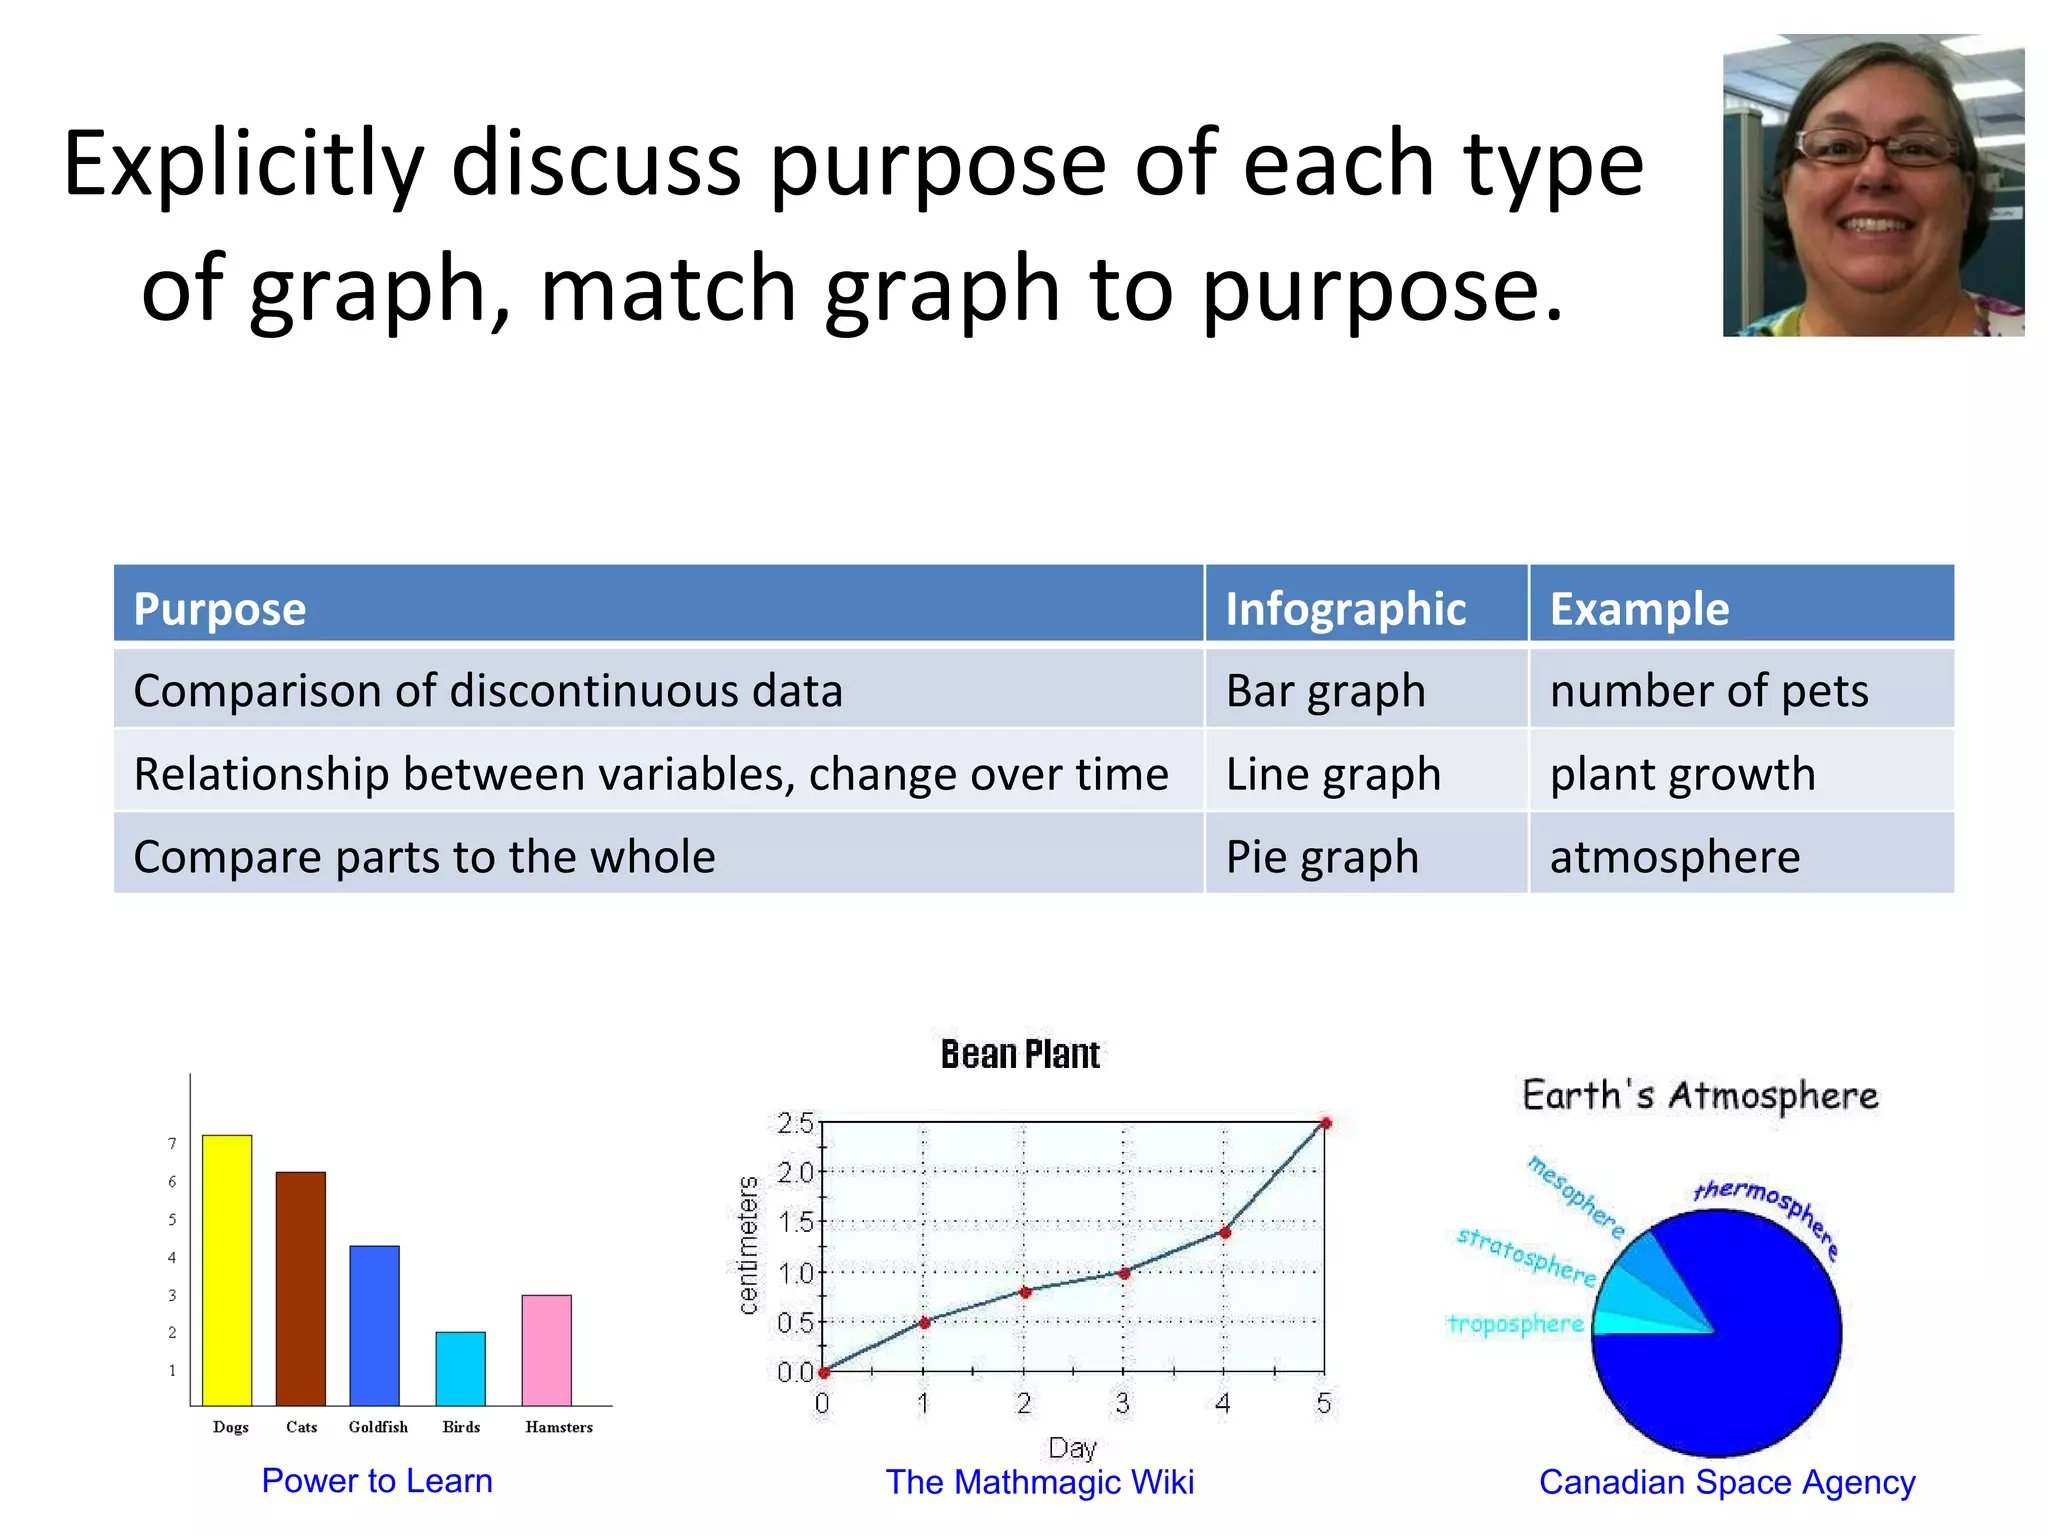
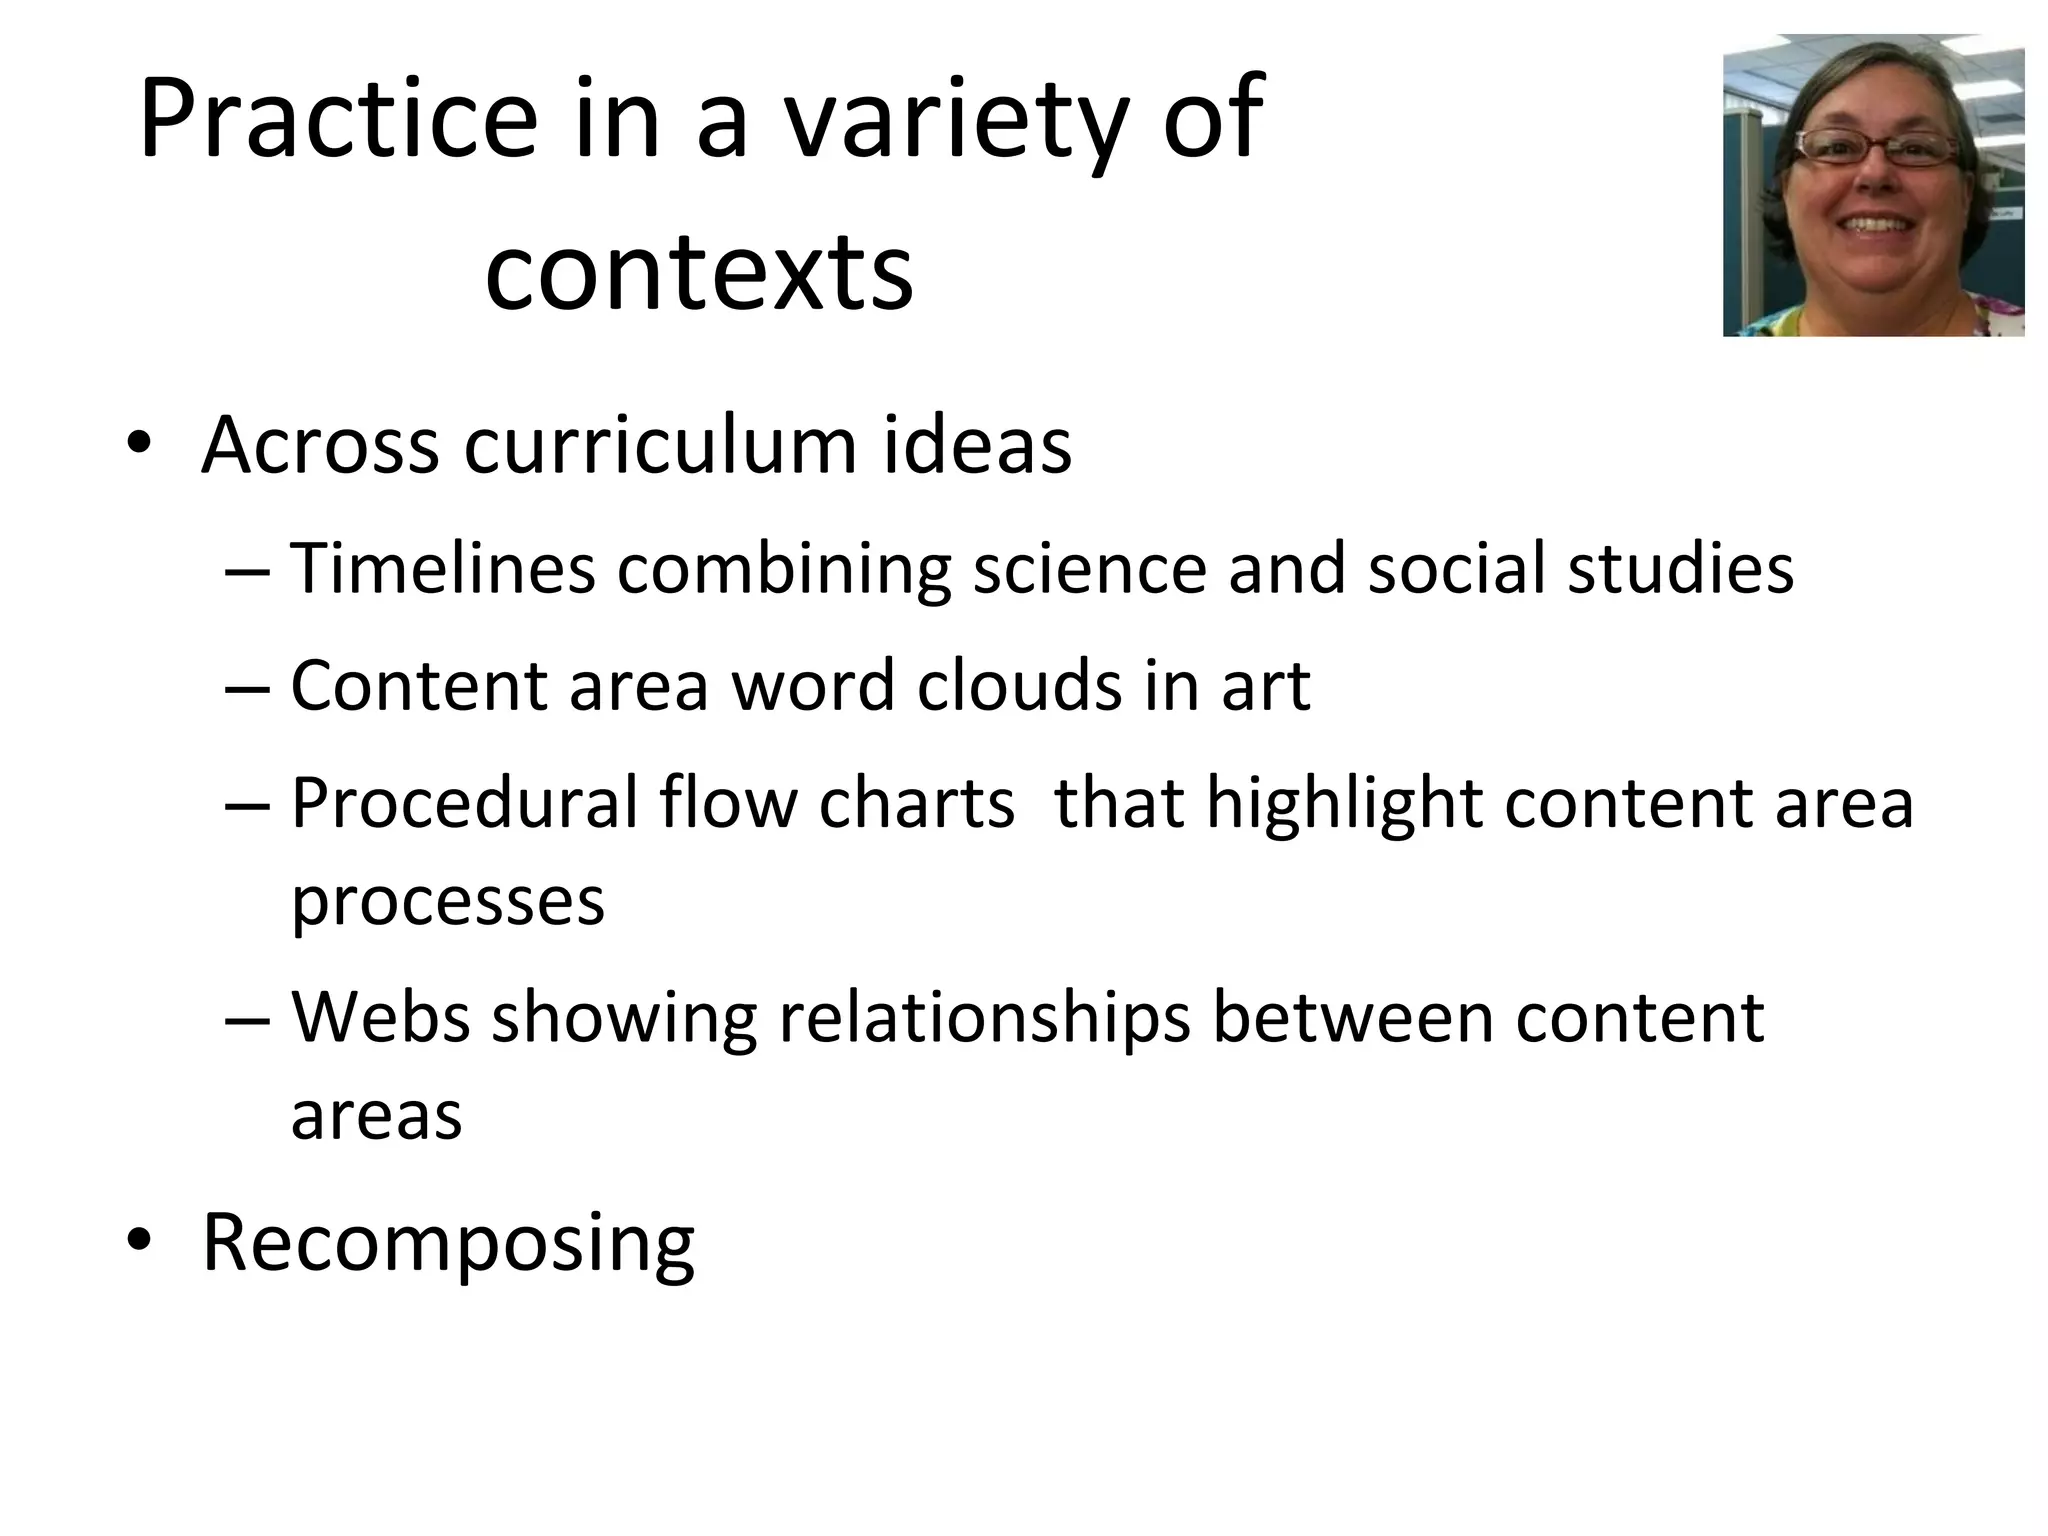
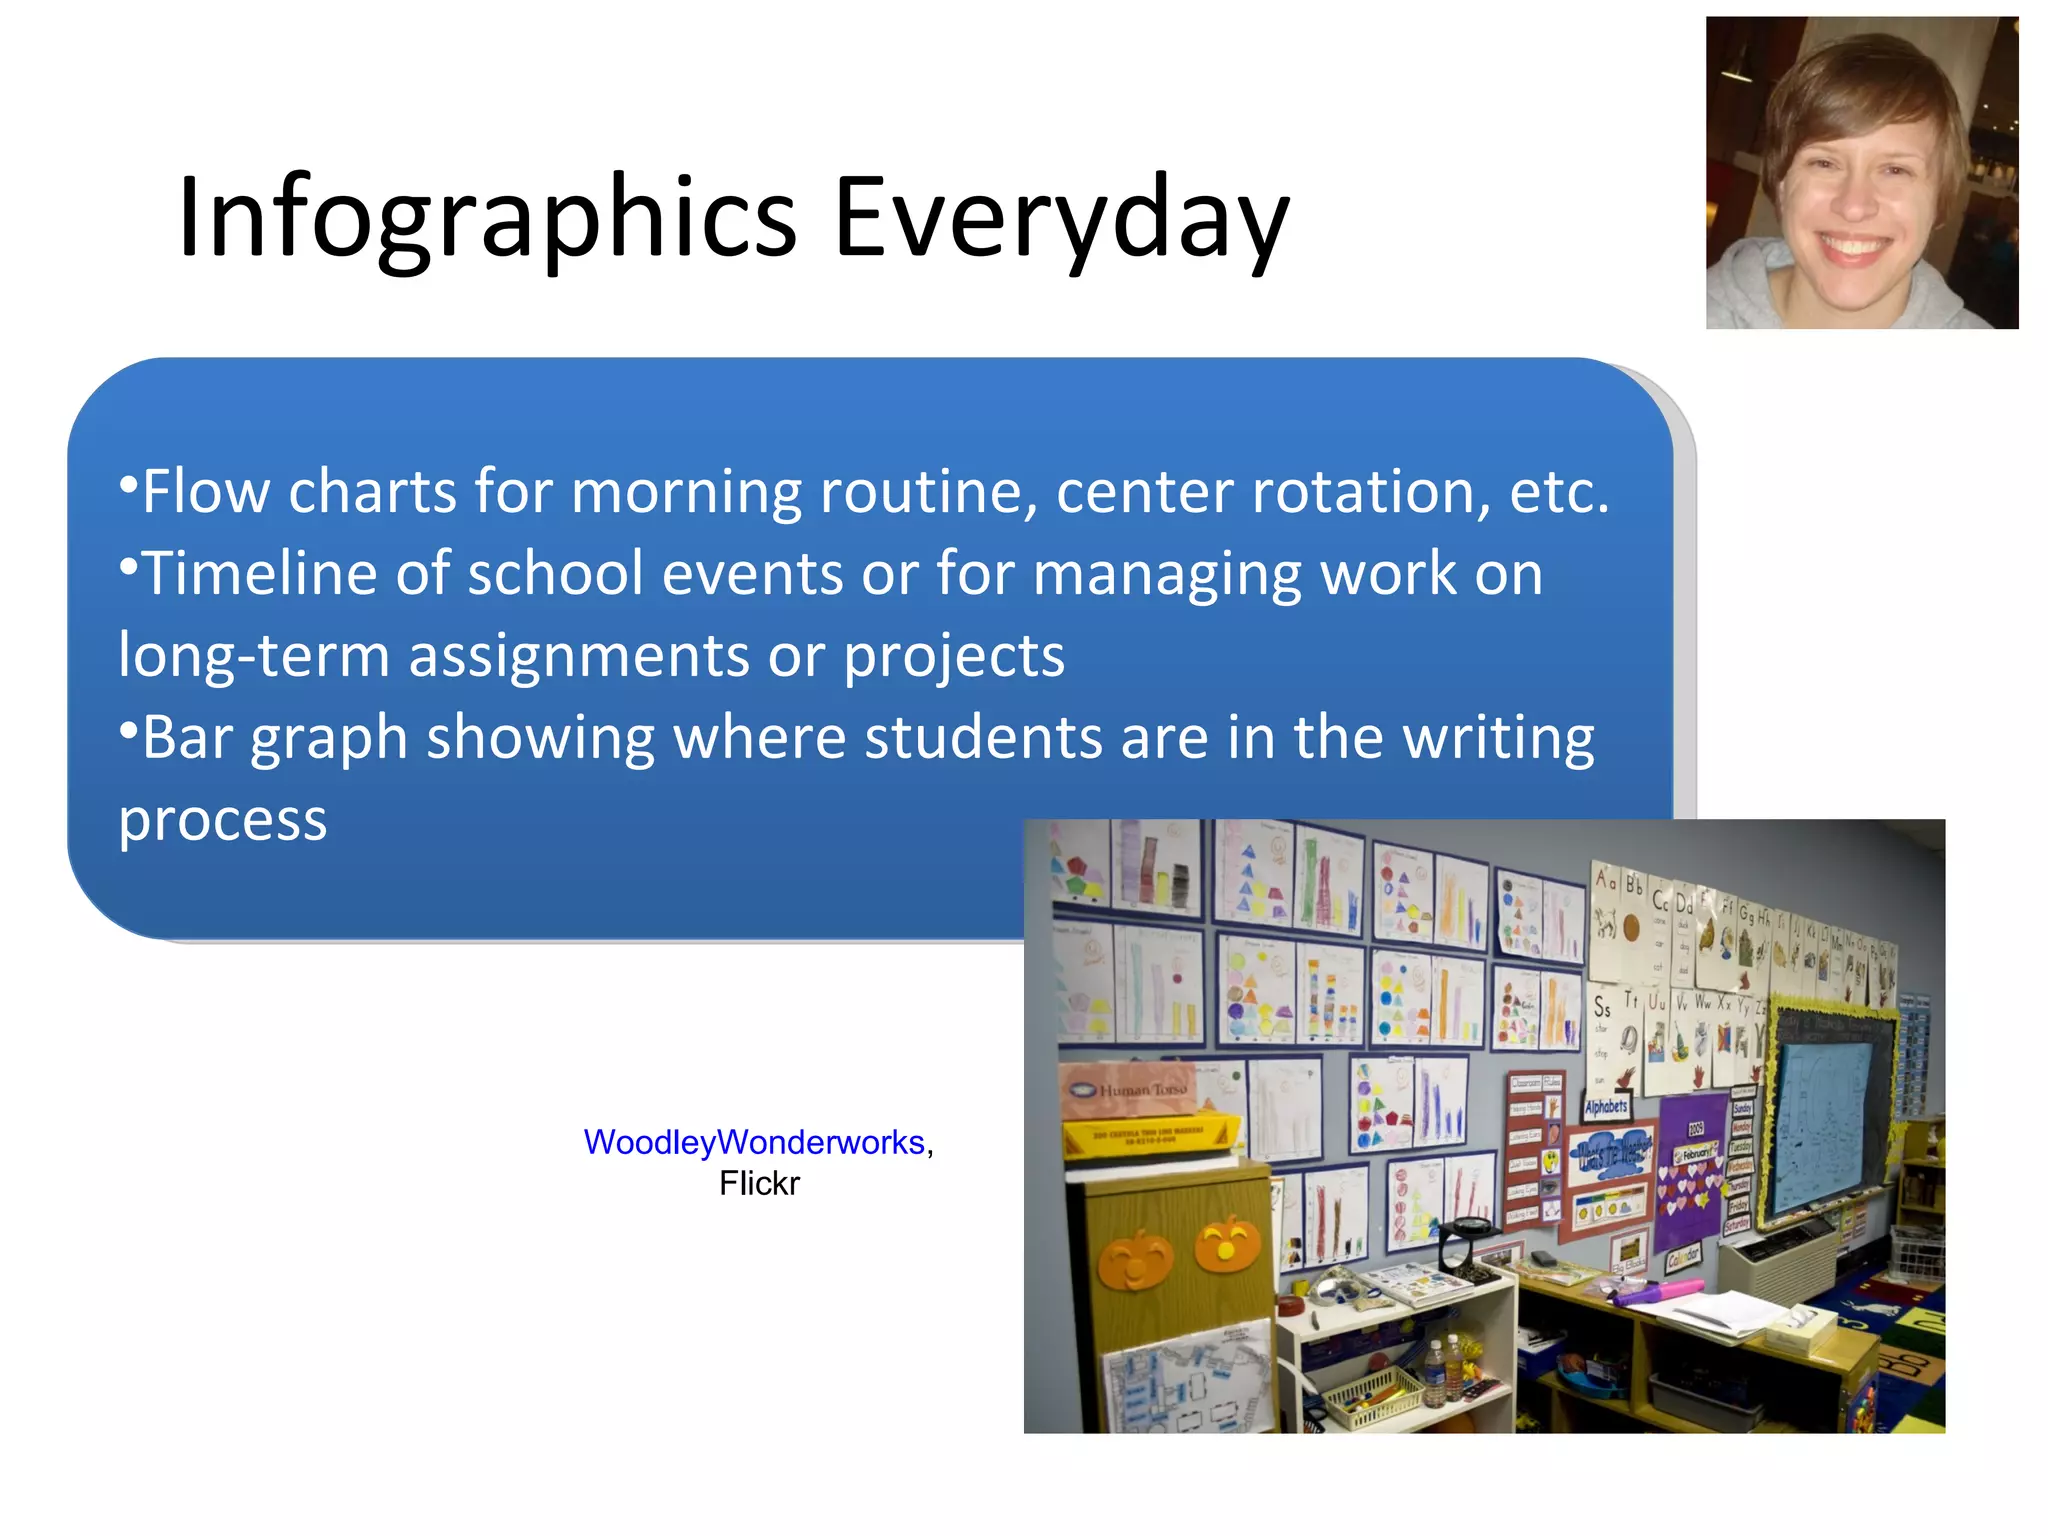
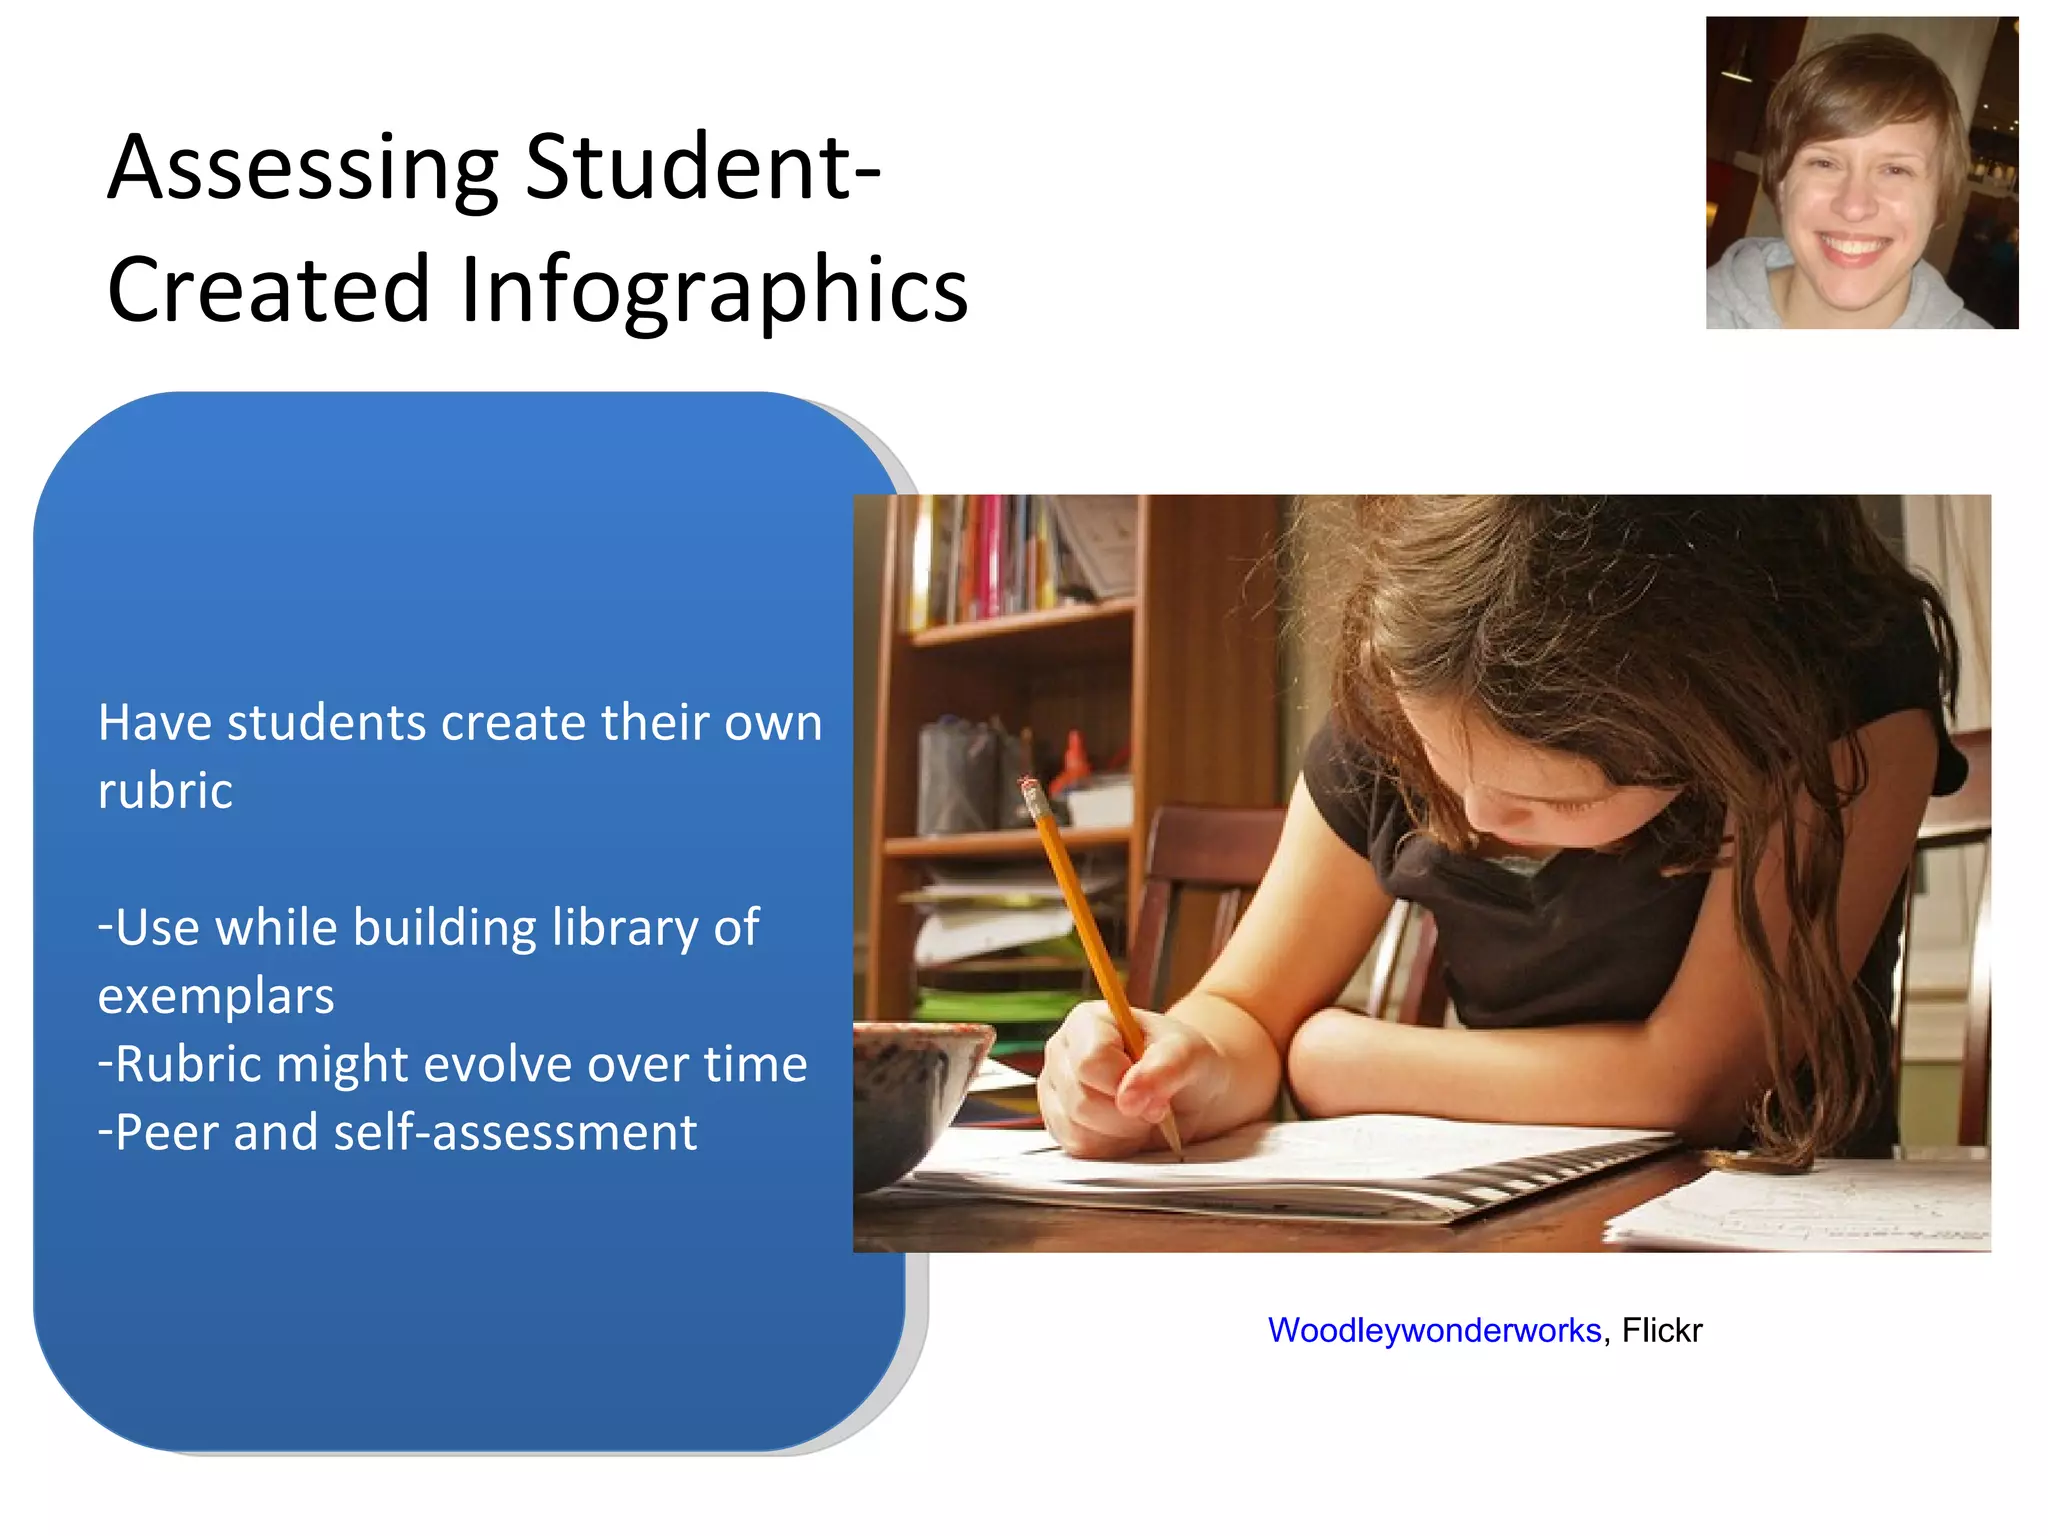
1. The document discusses strategies for teaching students to create infographics, which are visual representations of information. 2. Some challenges in current instruction are that creating infographics is often divorced from context and students don't see the importance or relate graphics to content. 3. The document recommends focusing instruction on one type of infographic at a time, explicitly discussing the purpose of each type, and providing authentic contexts for students to practice creating infographics across the curriculum.


