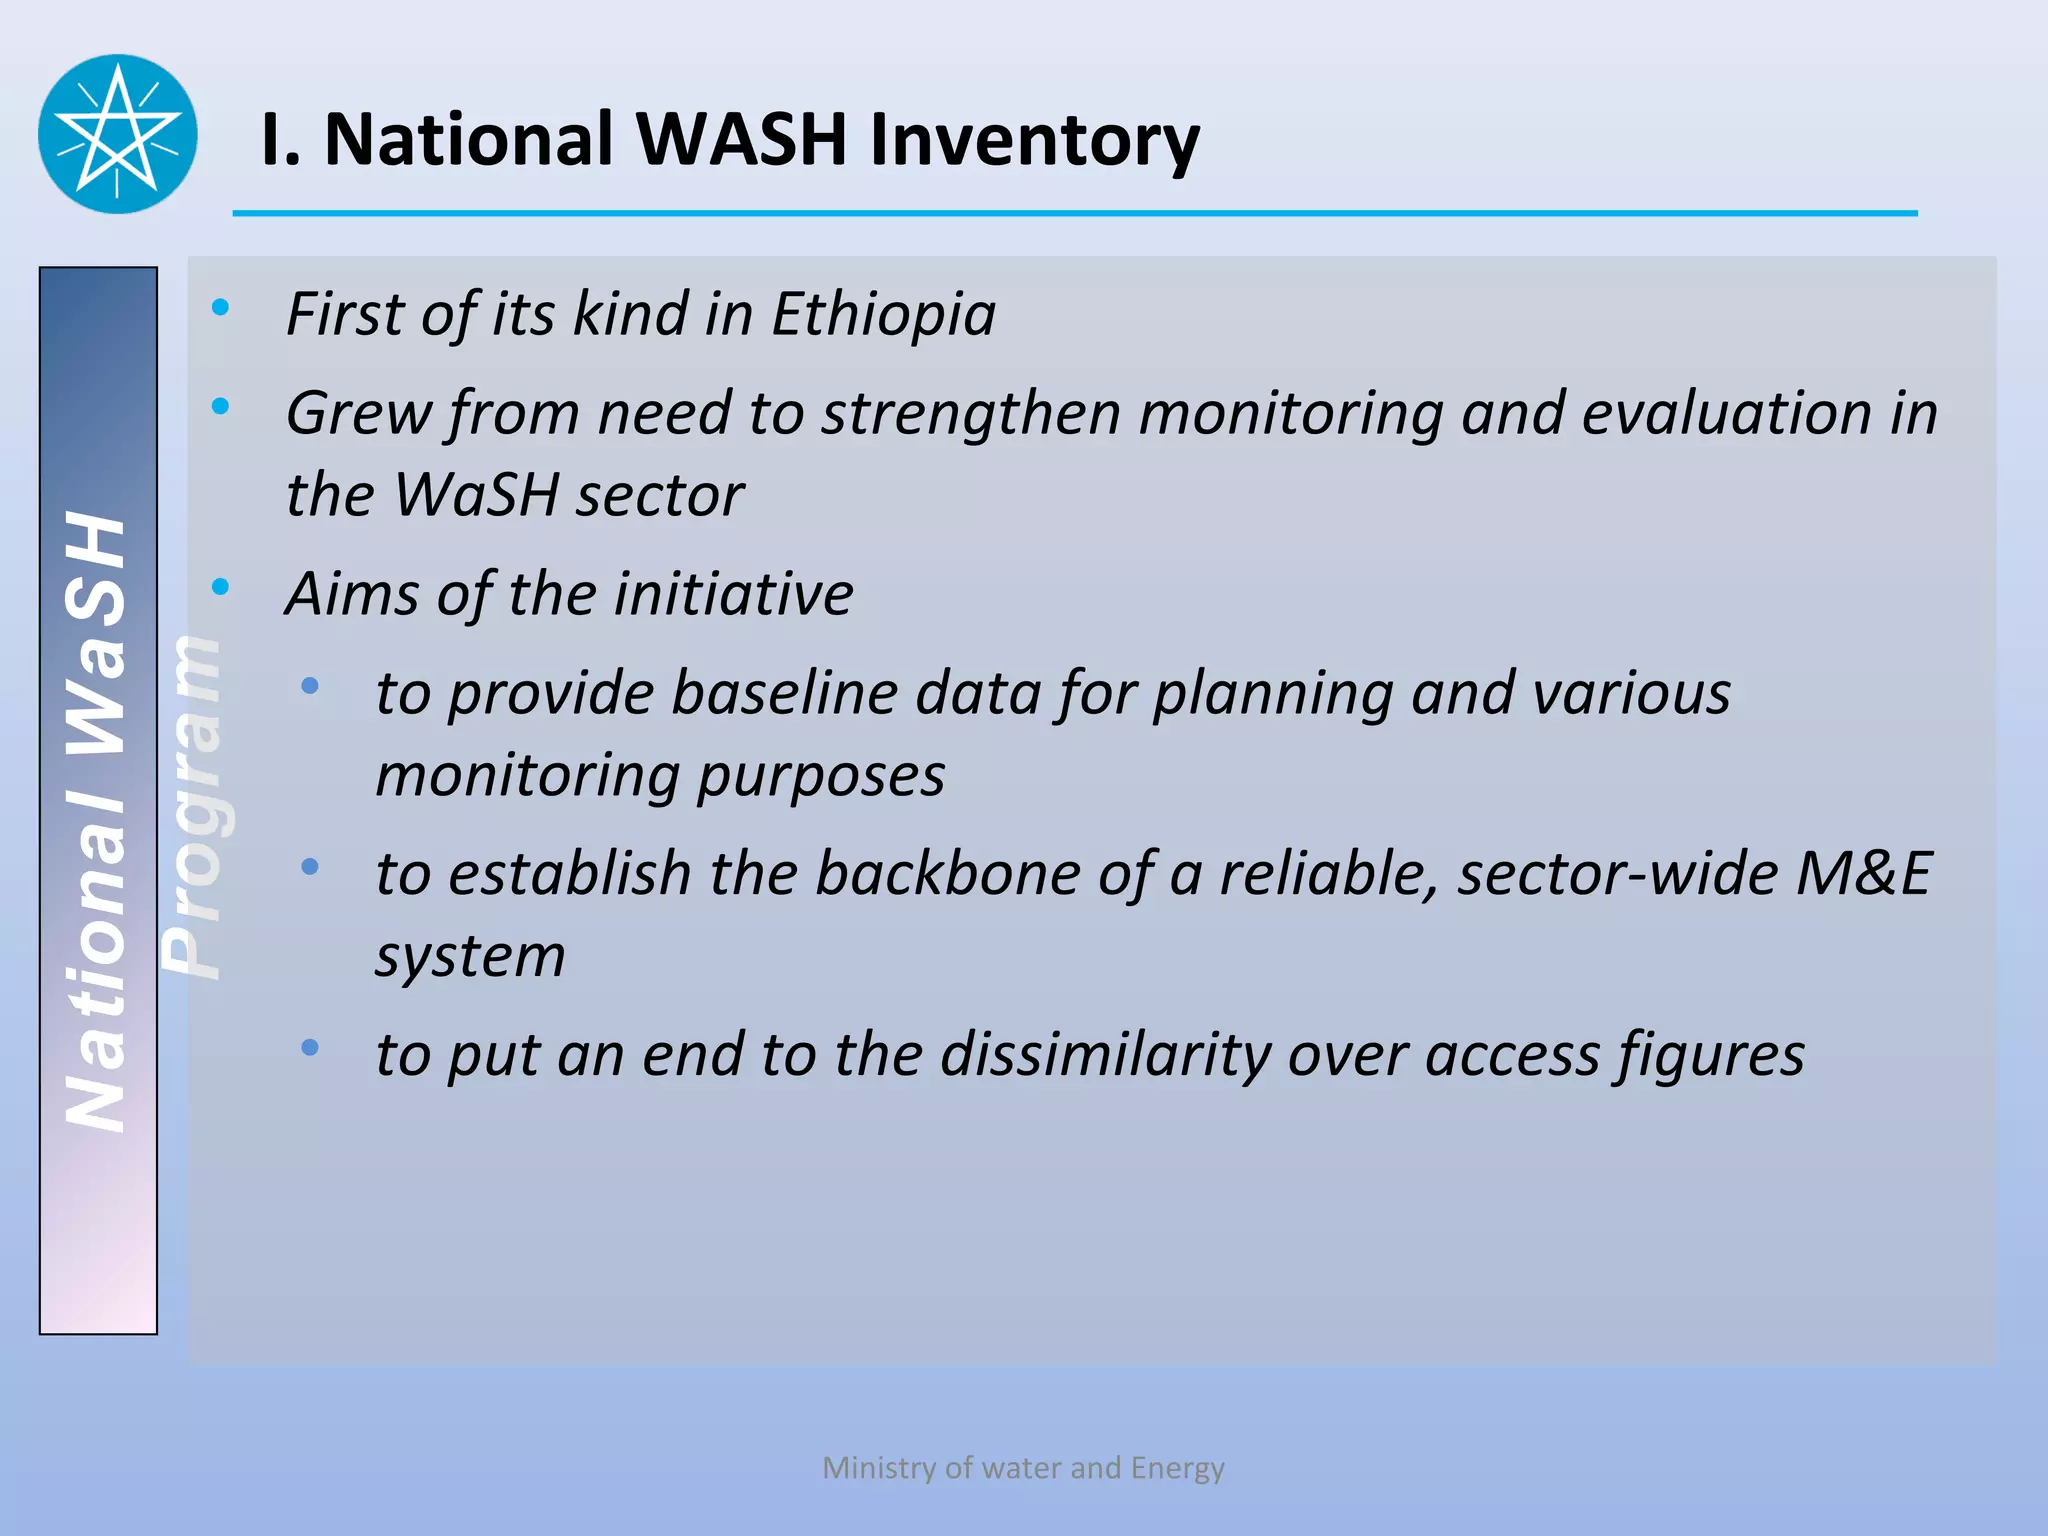
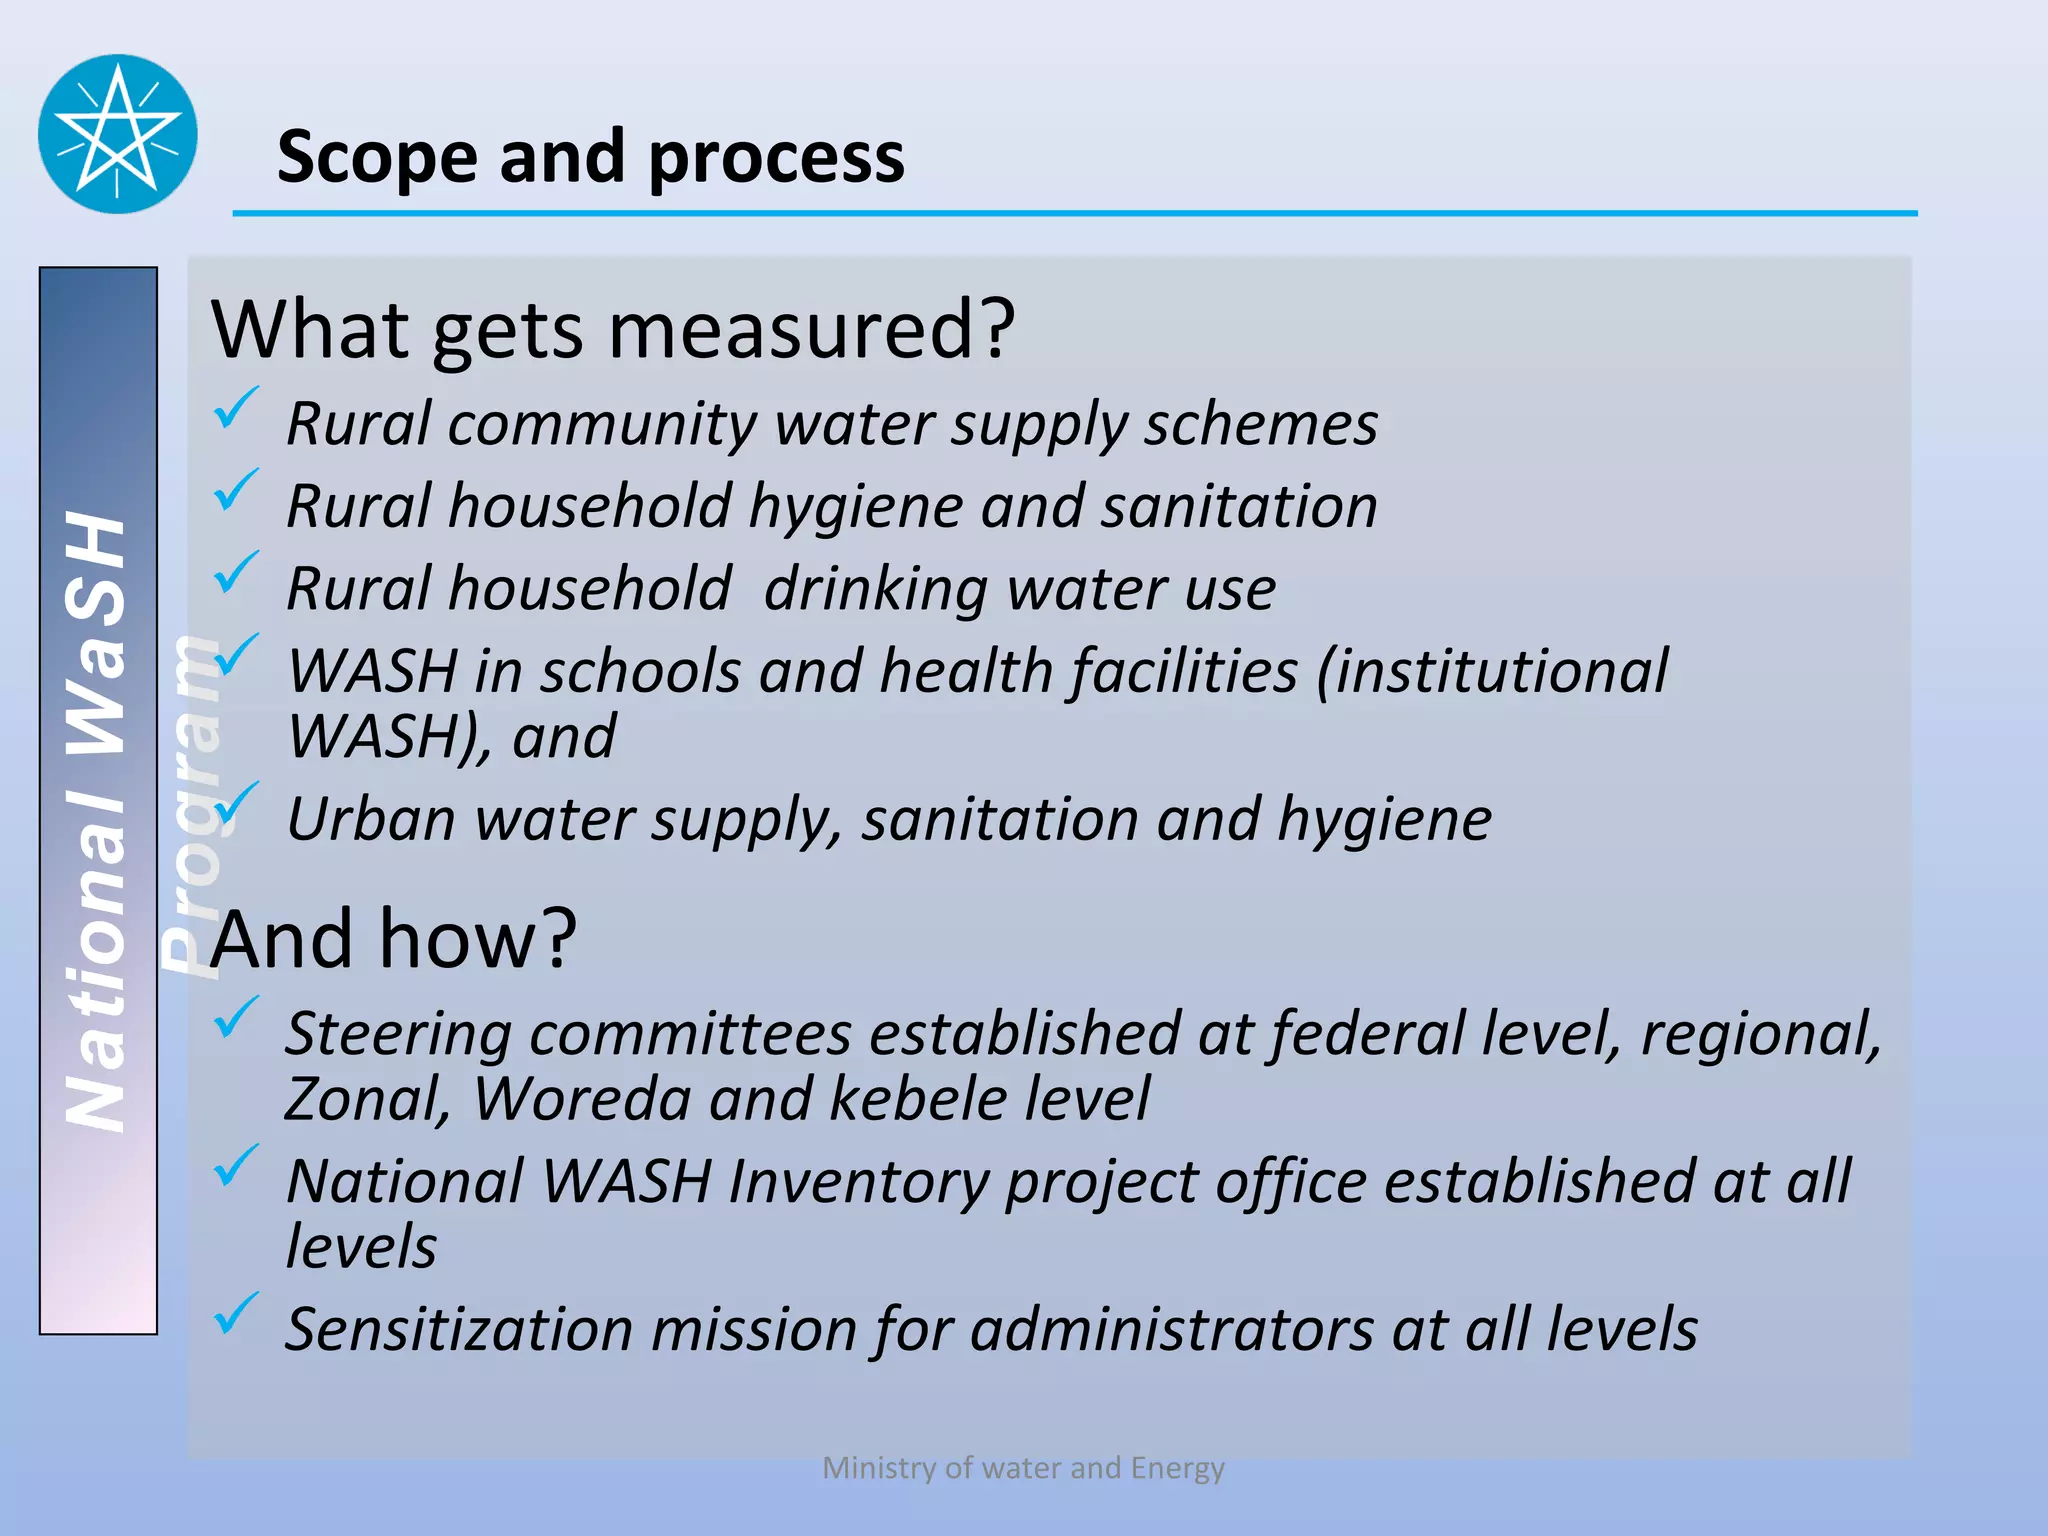
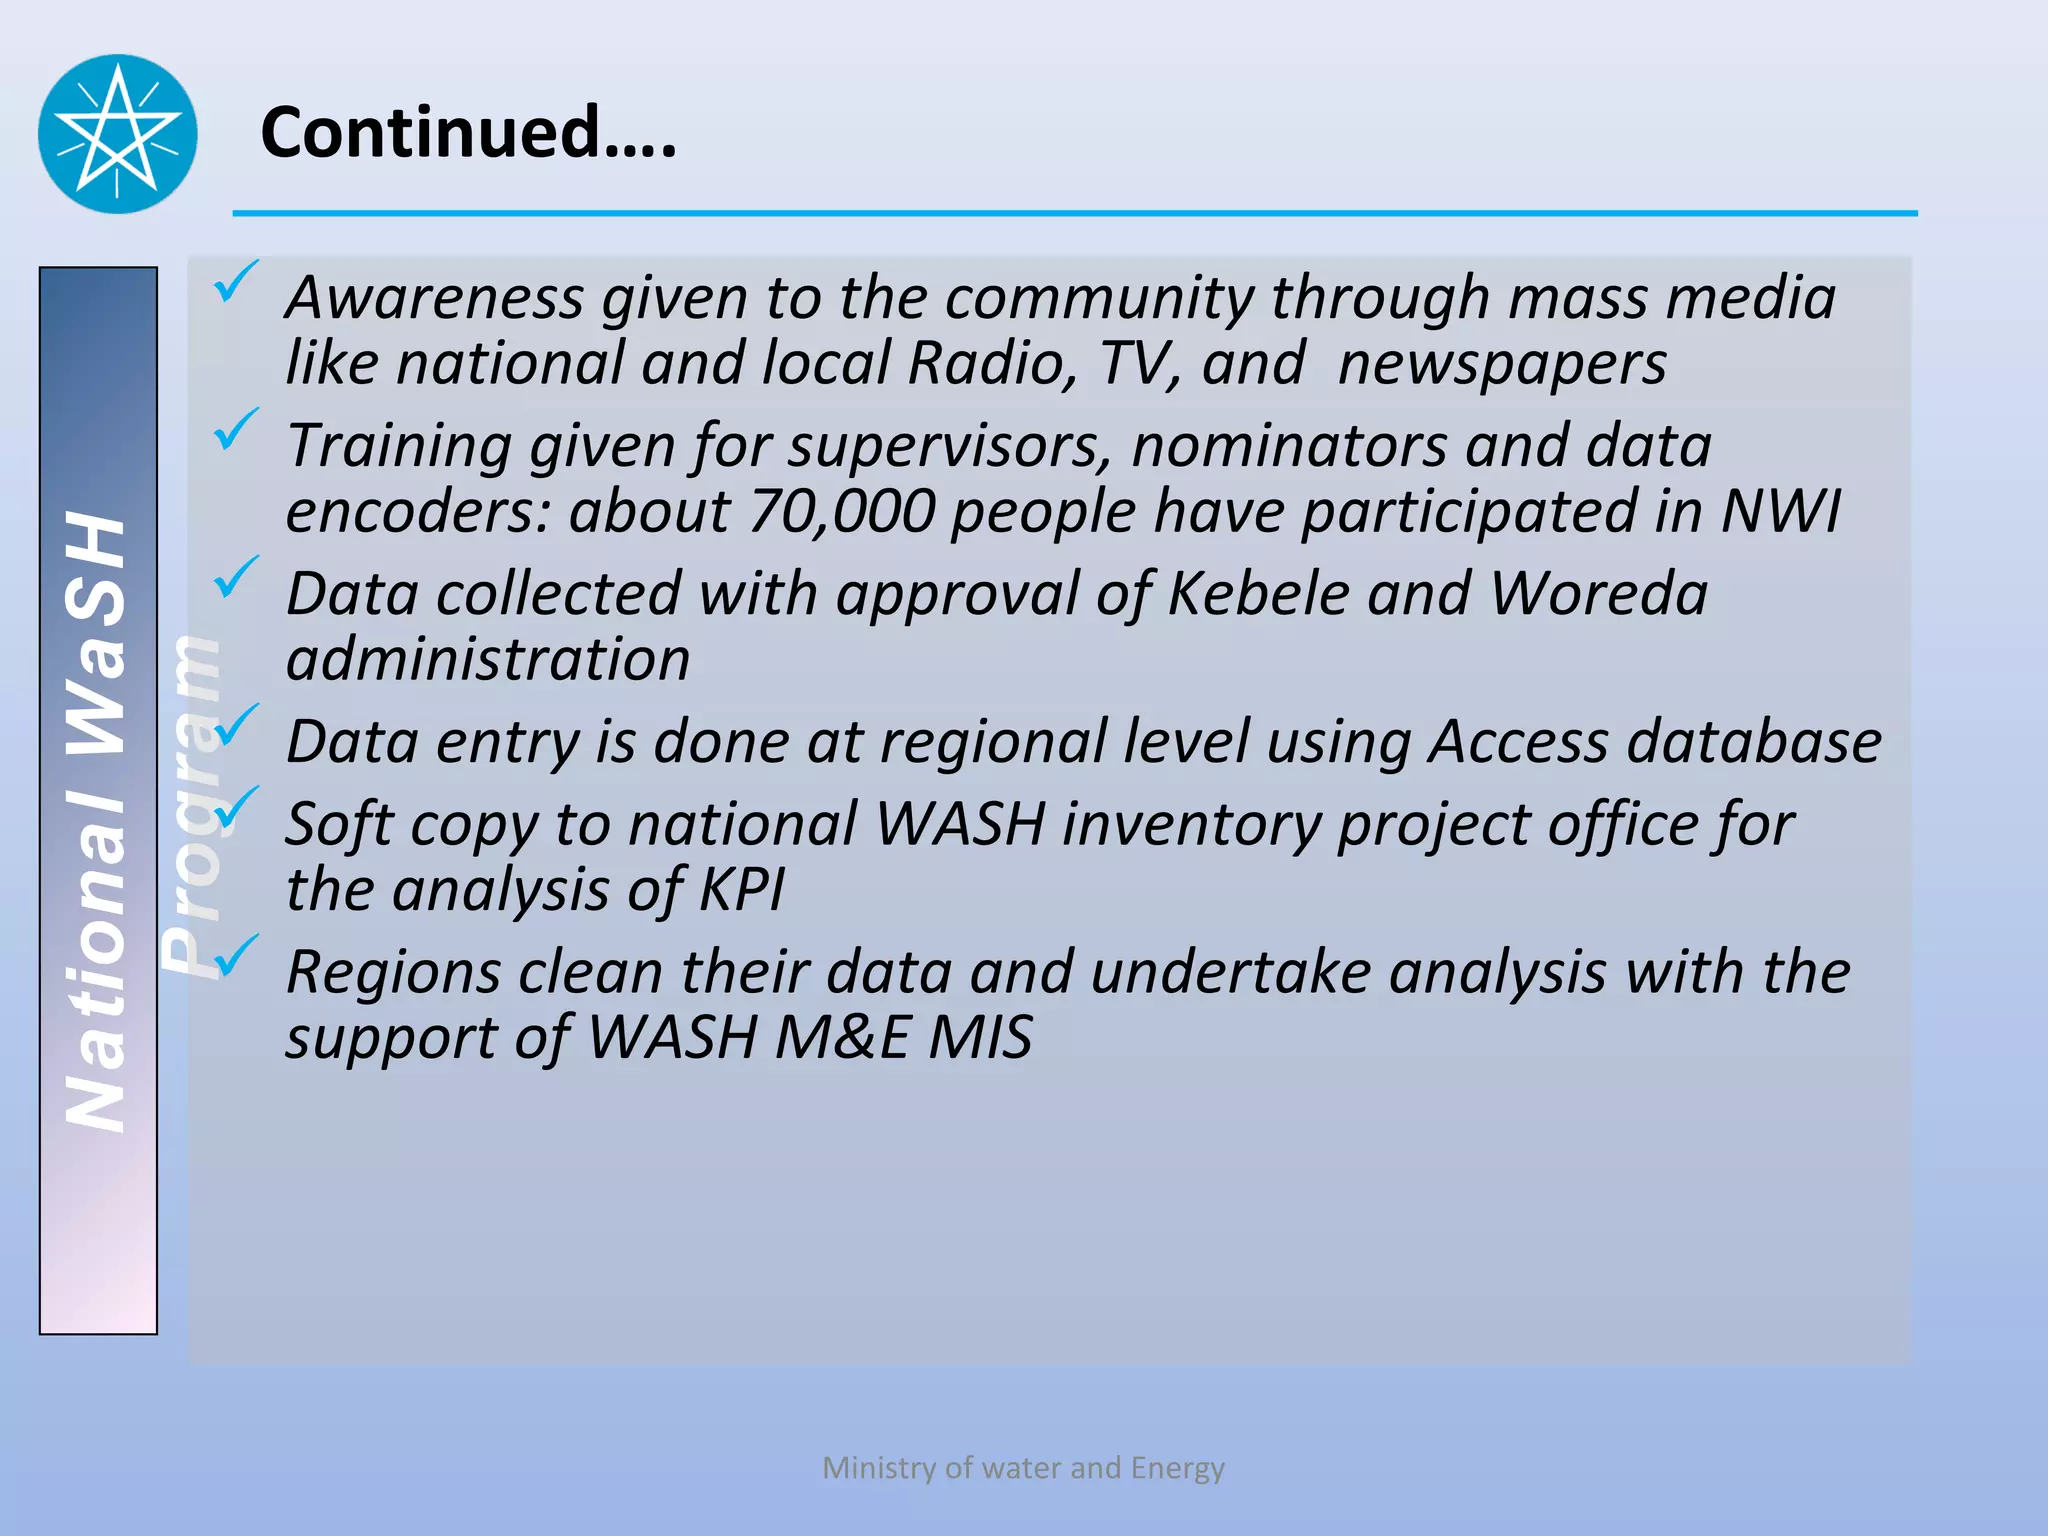
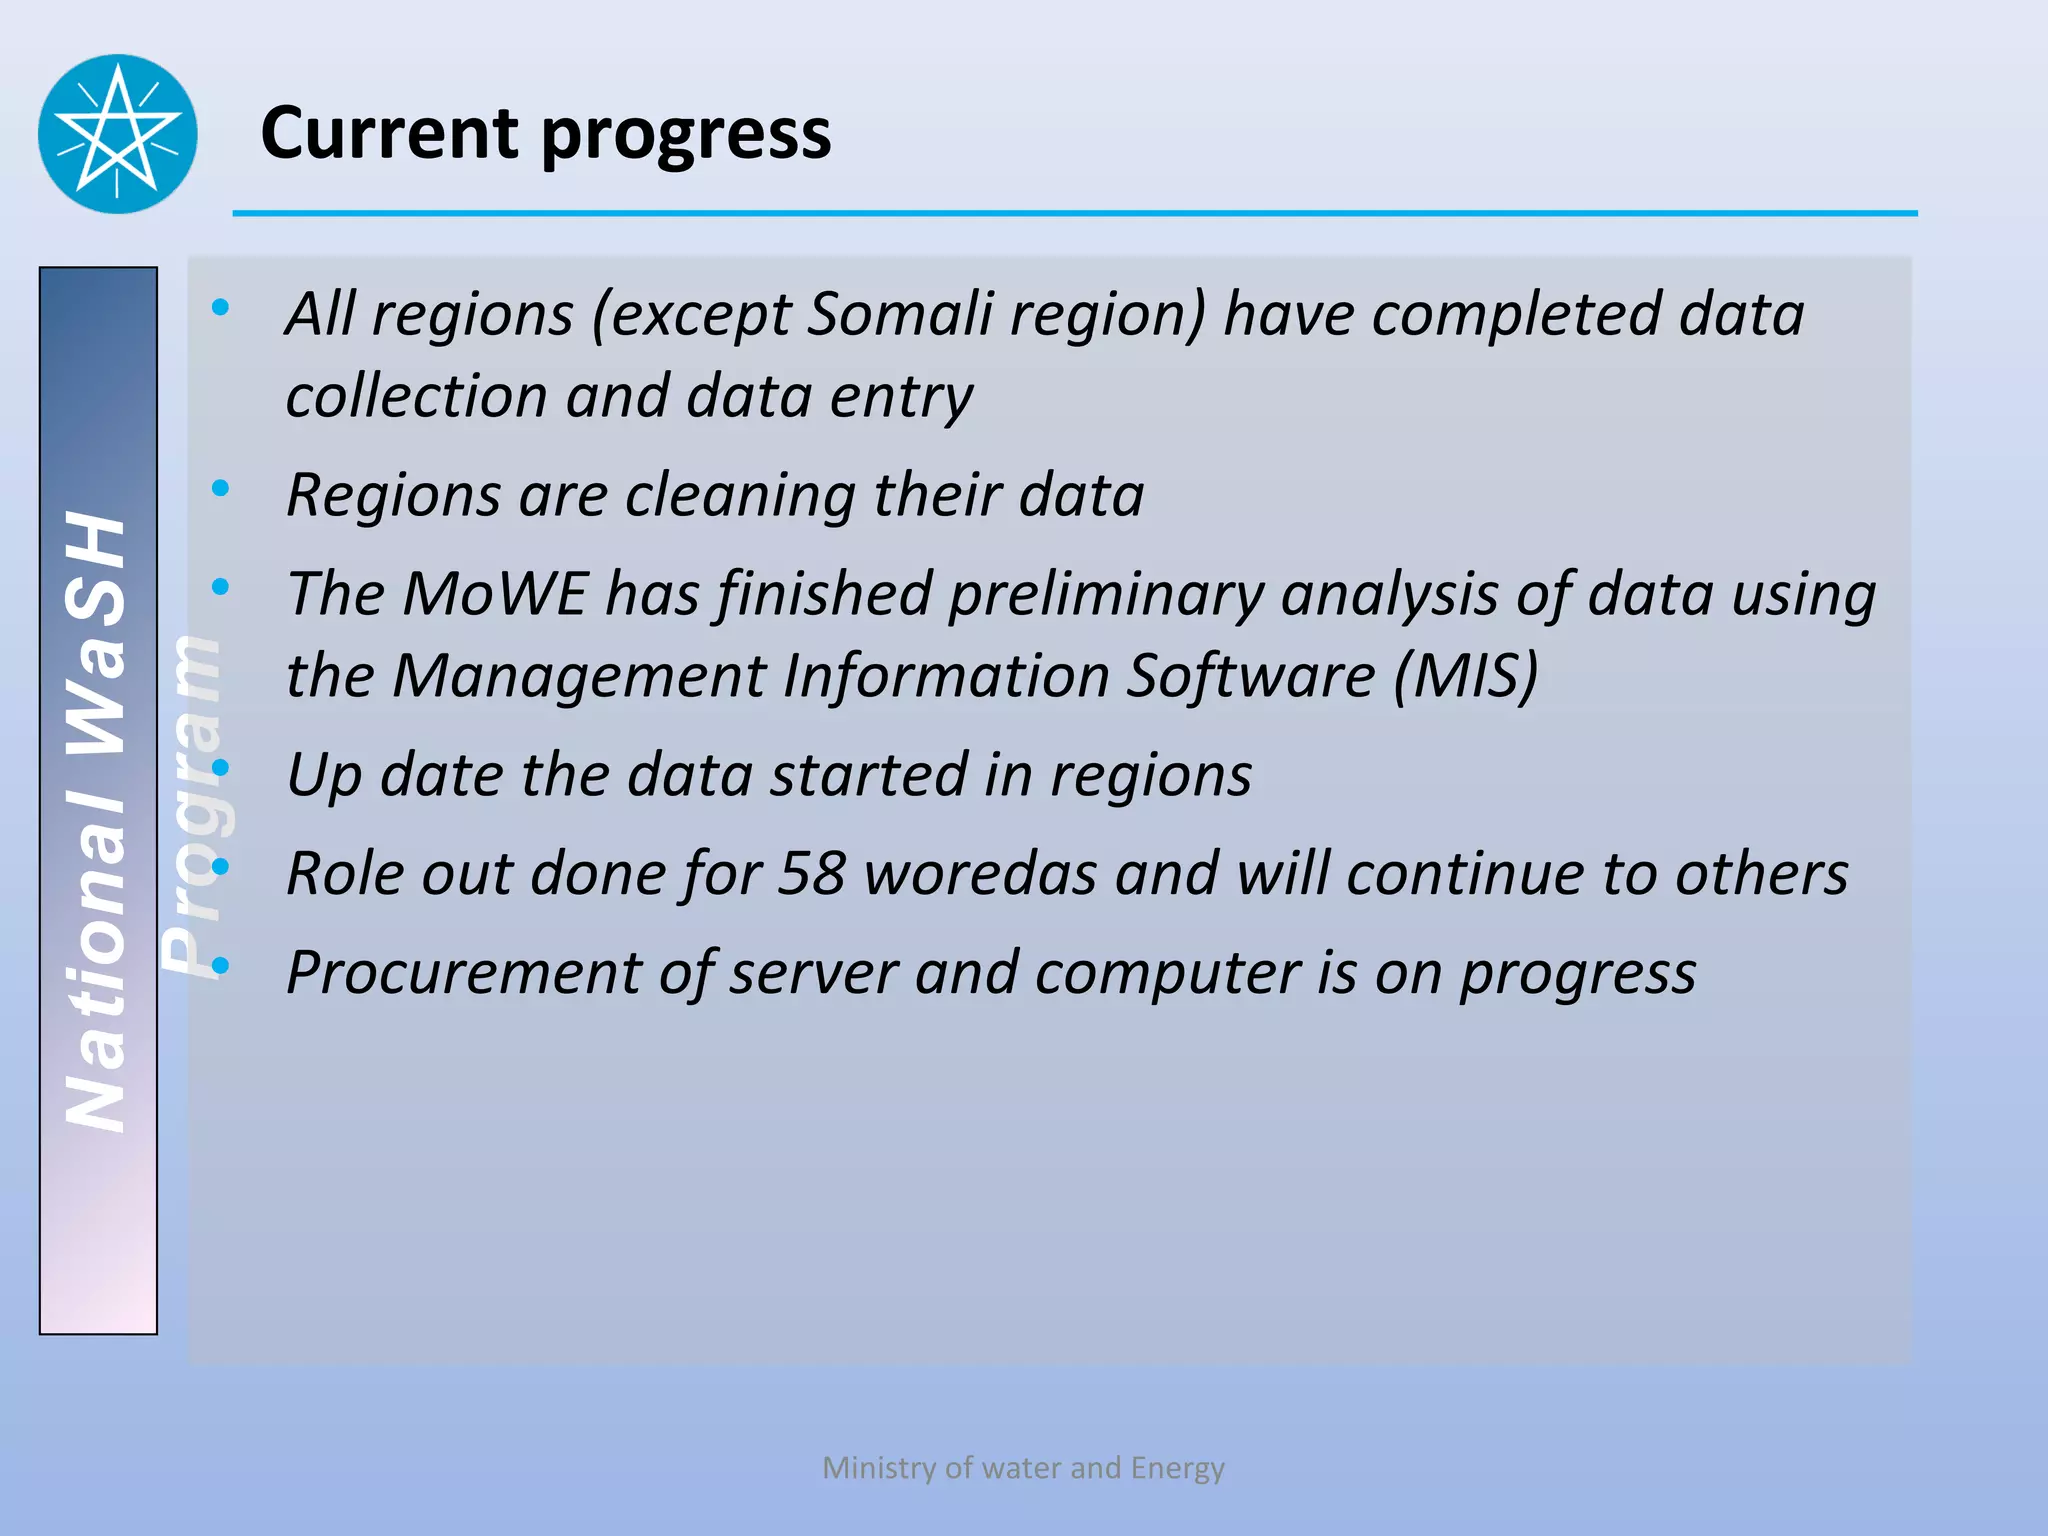
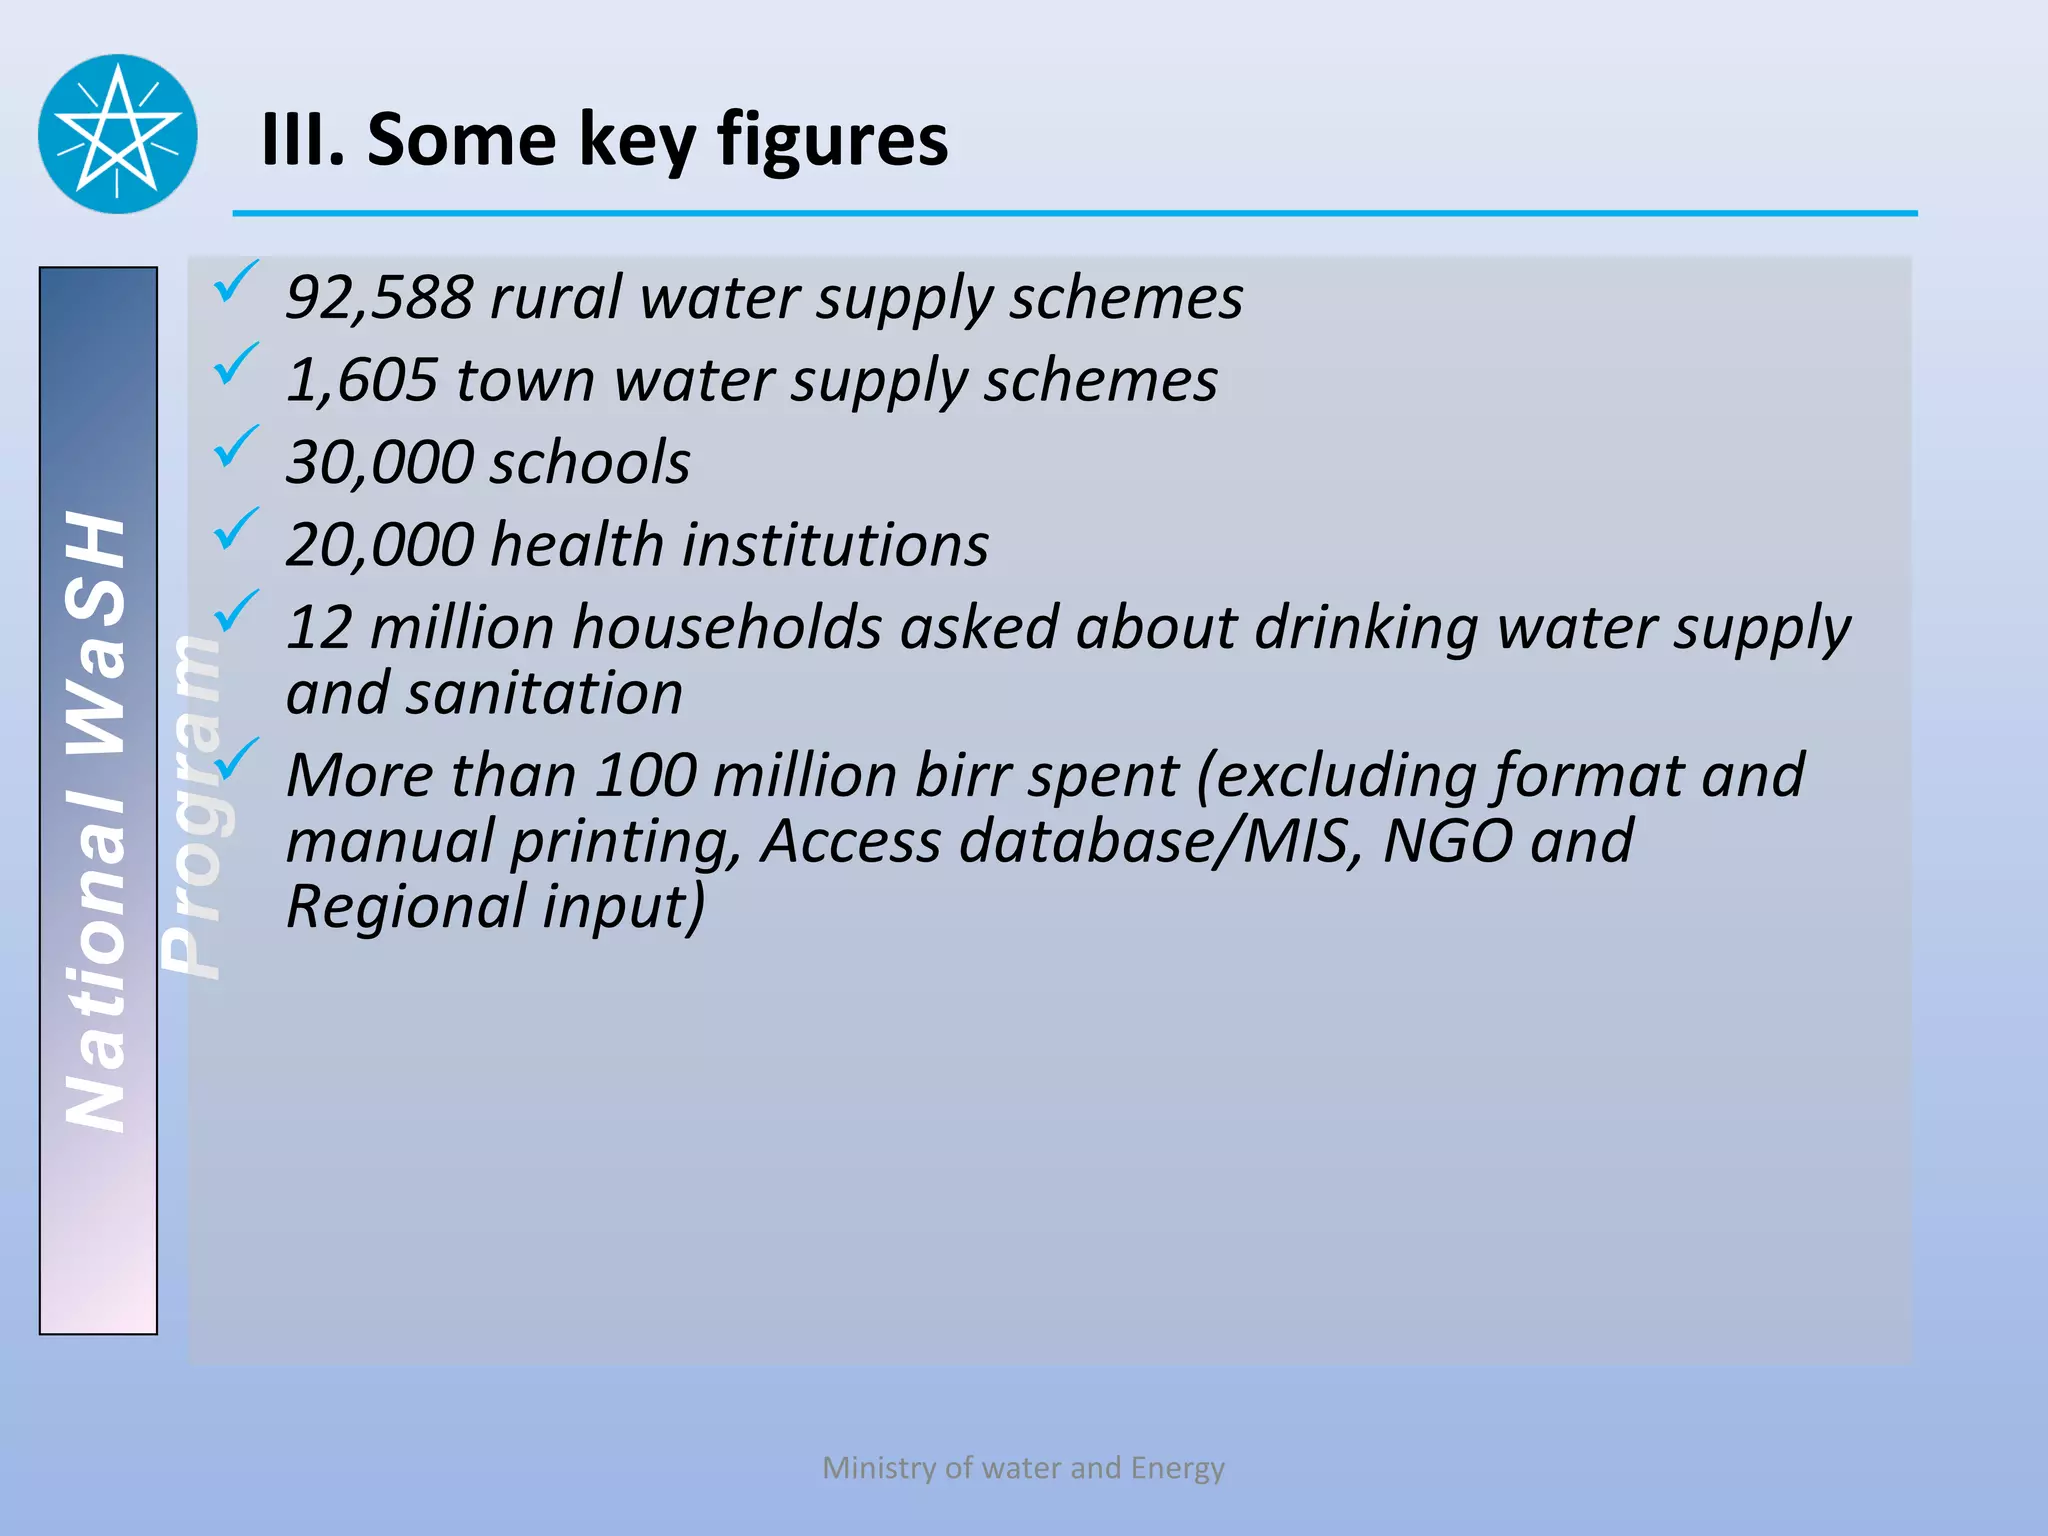
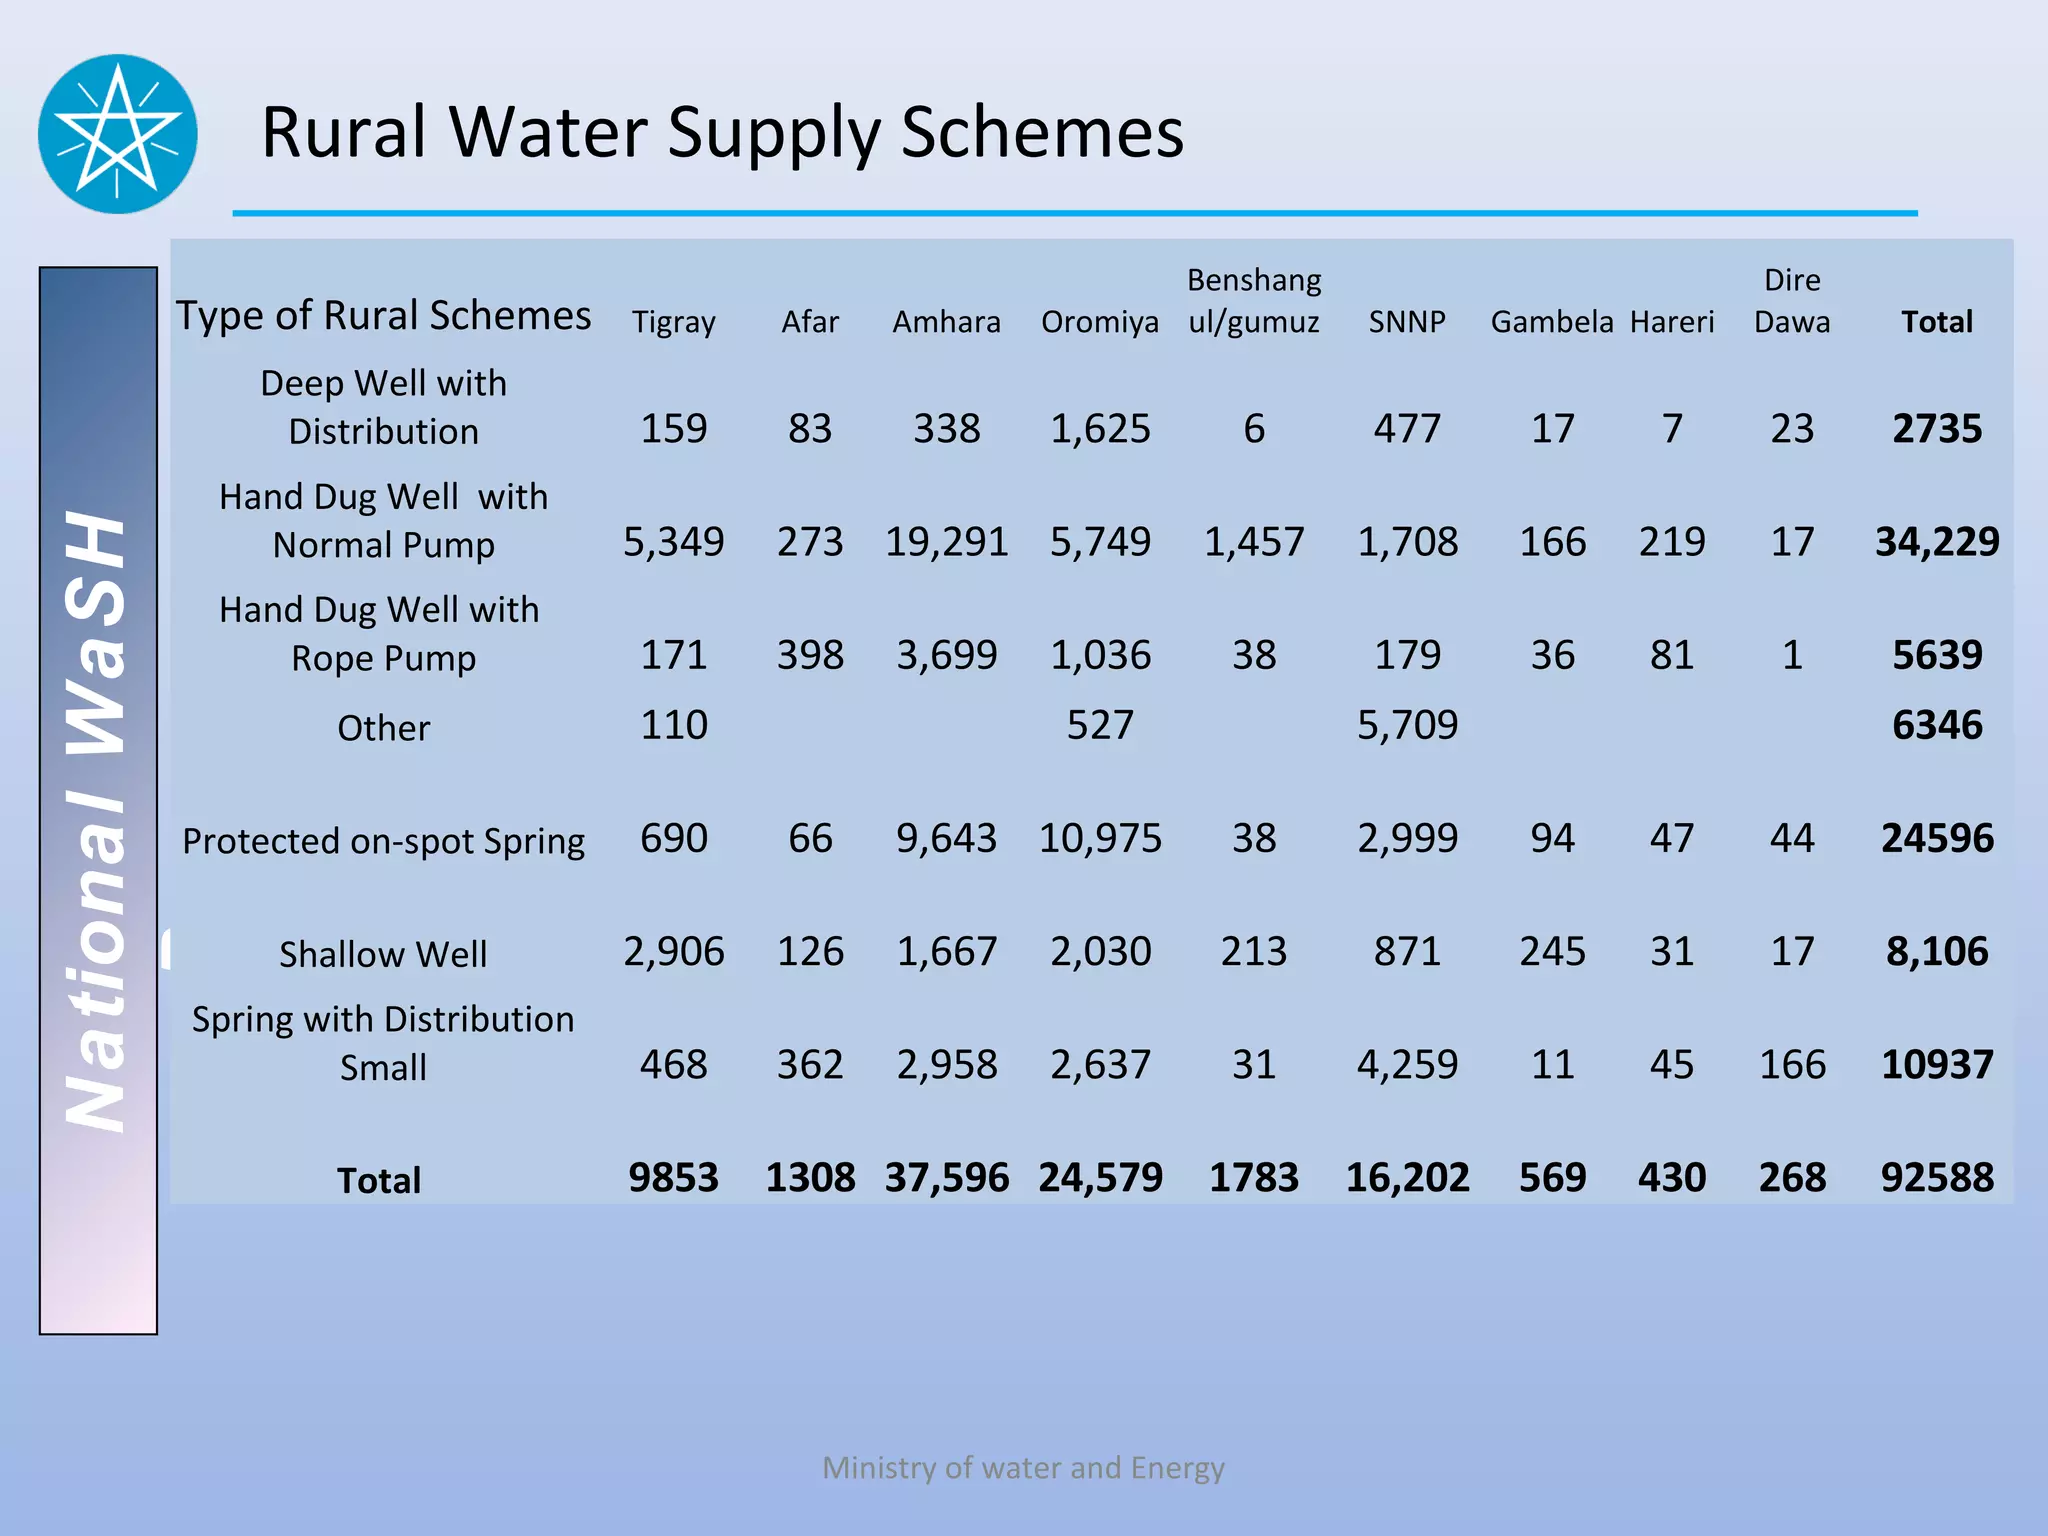
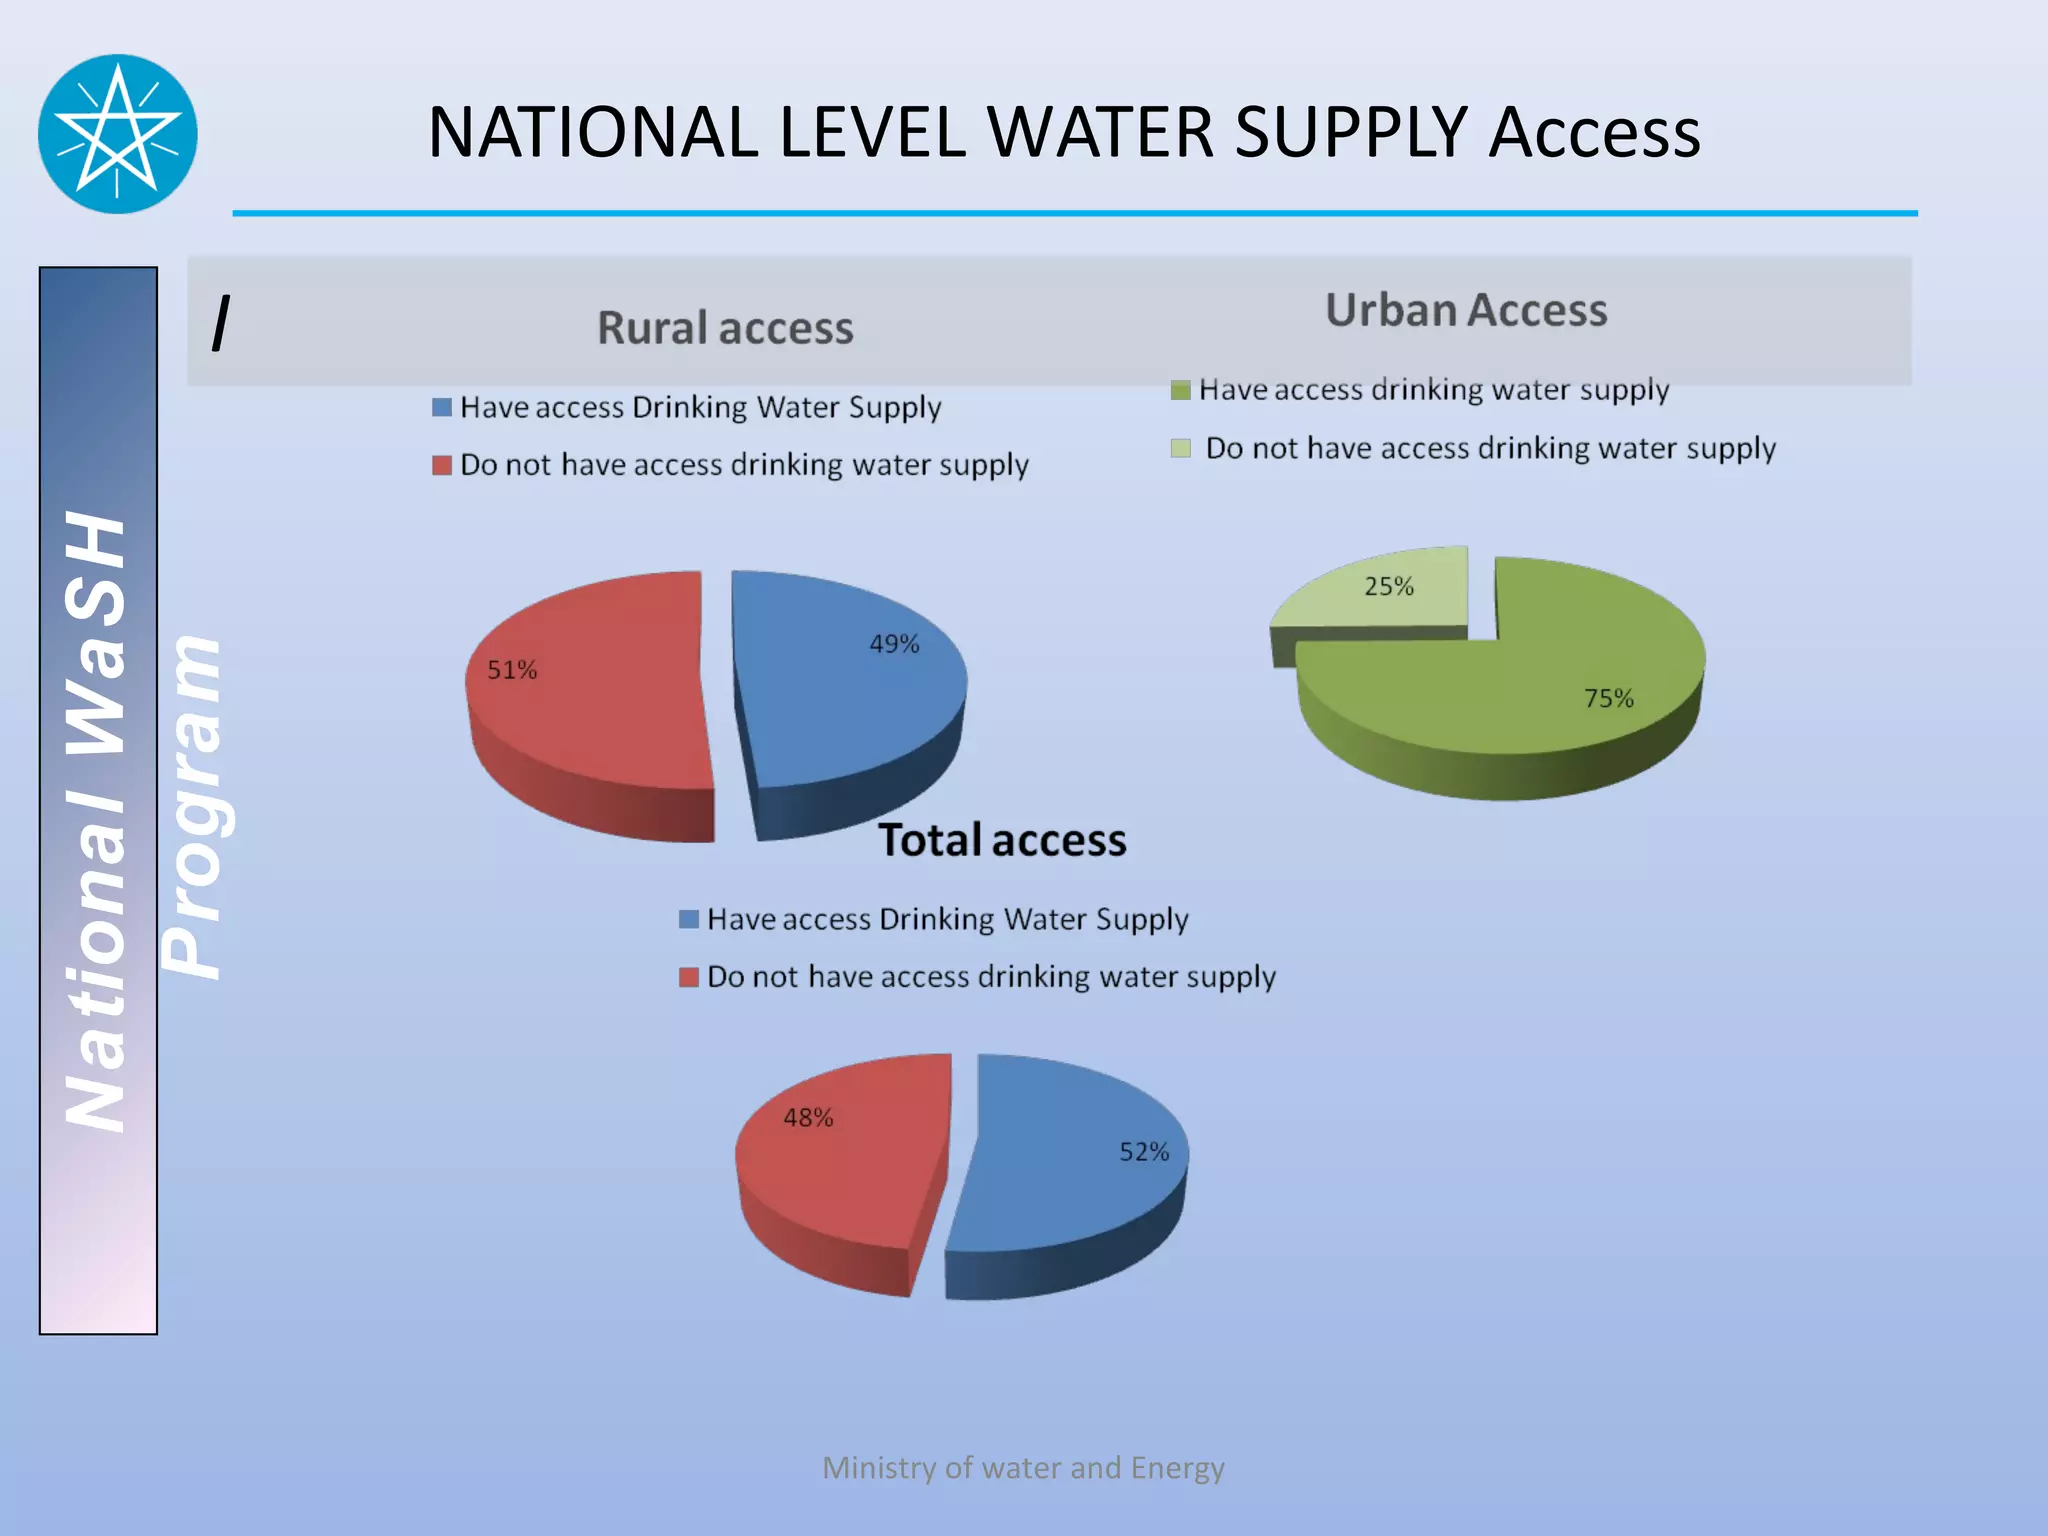
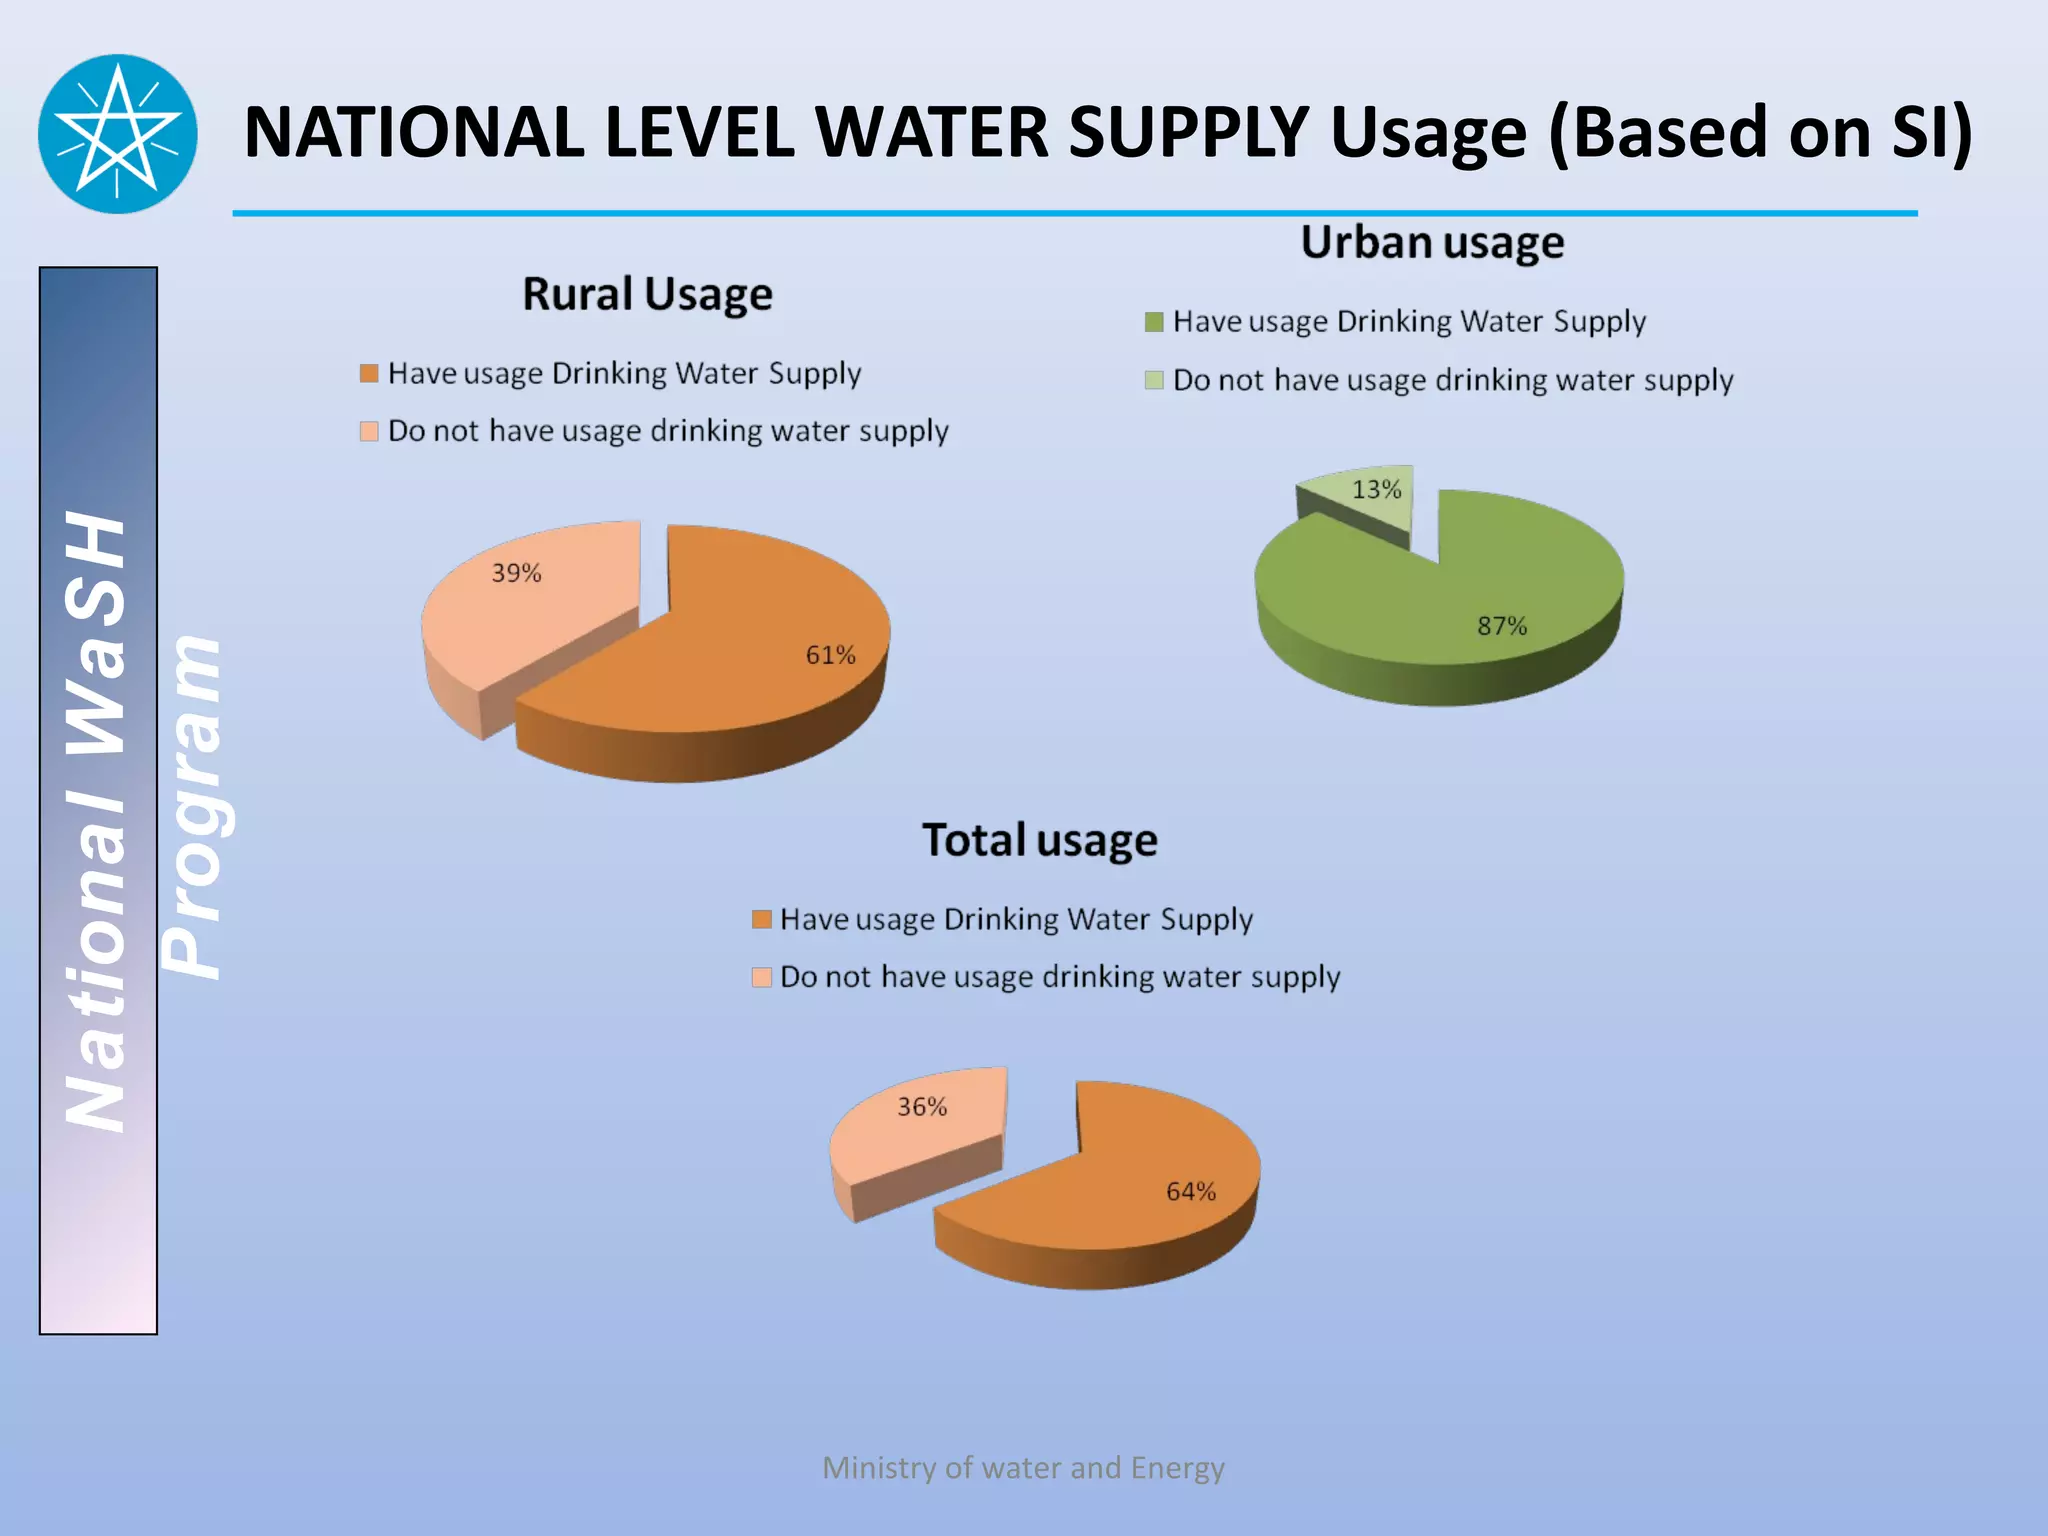
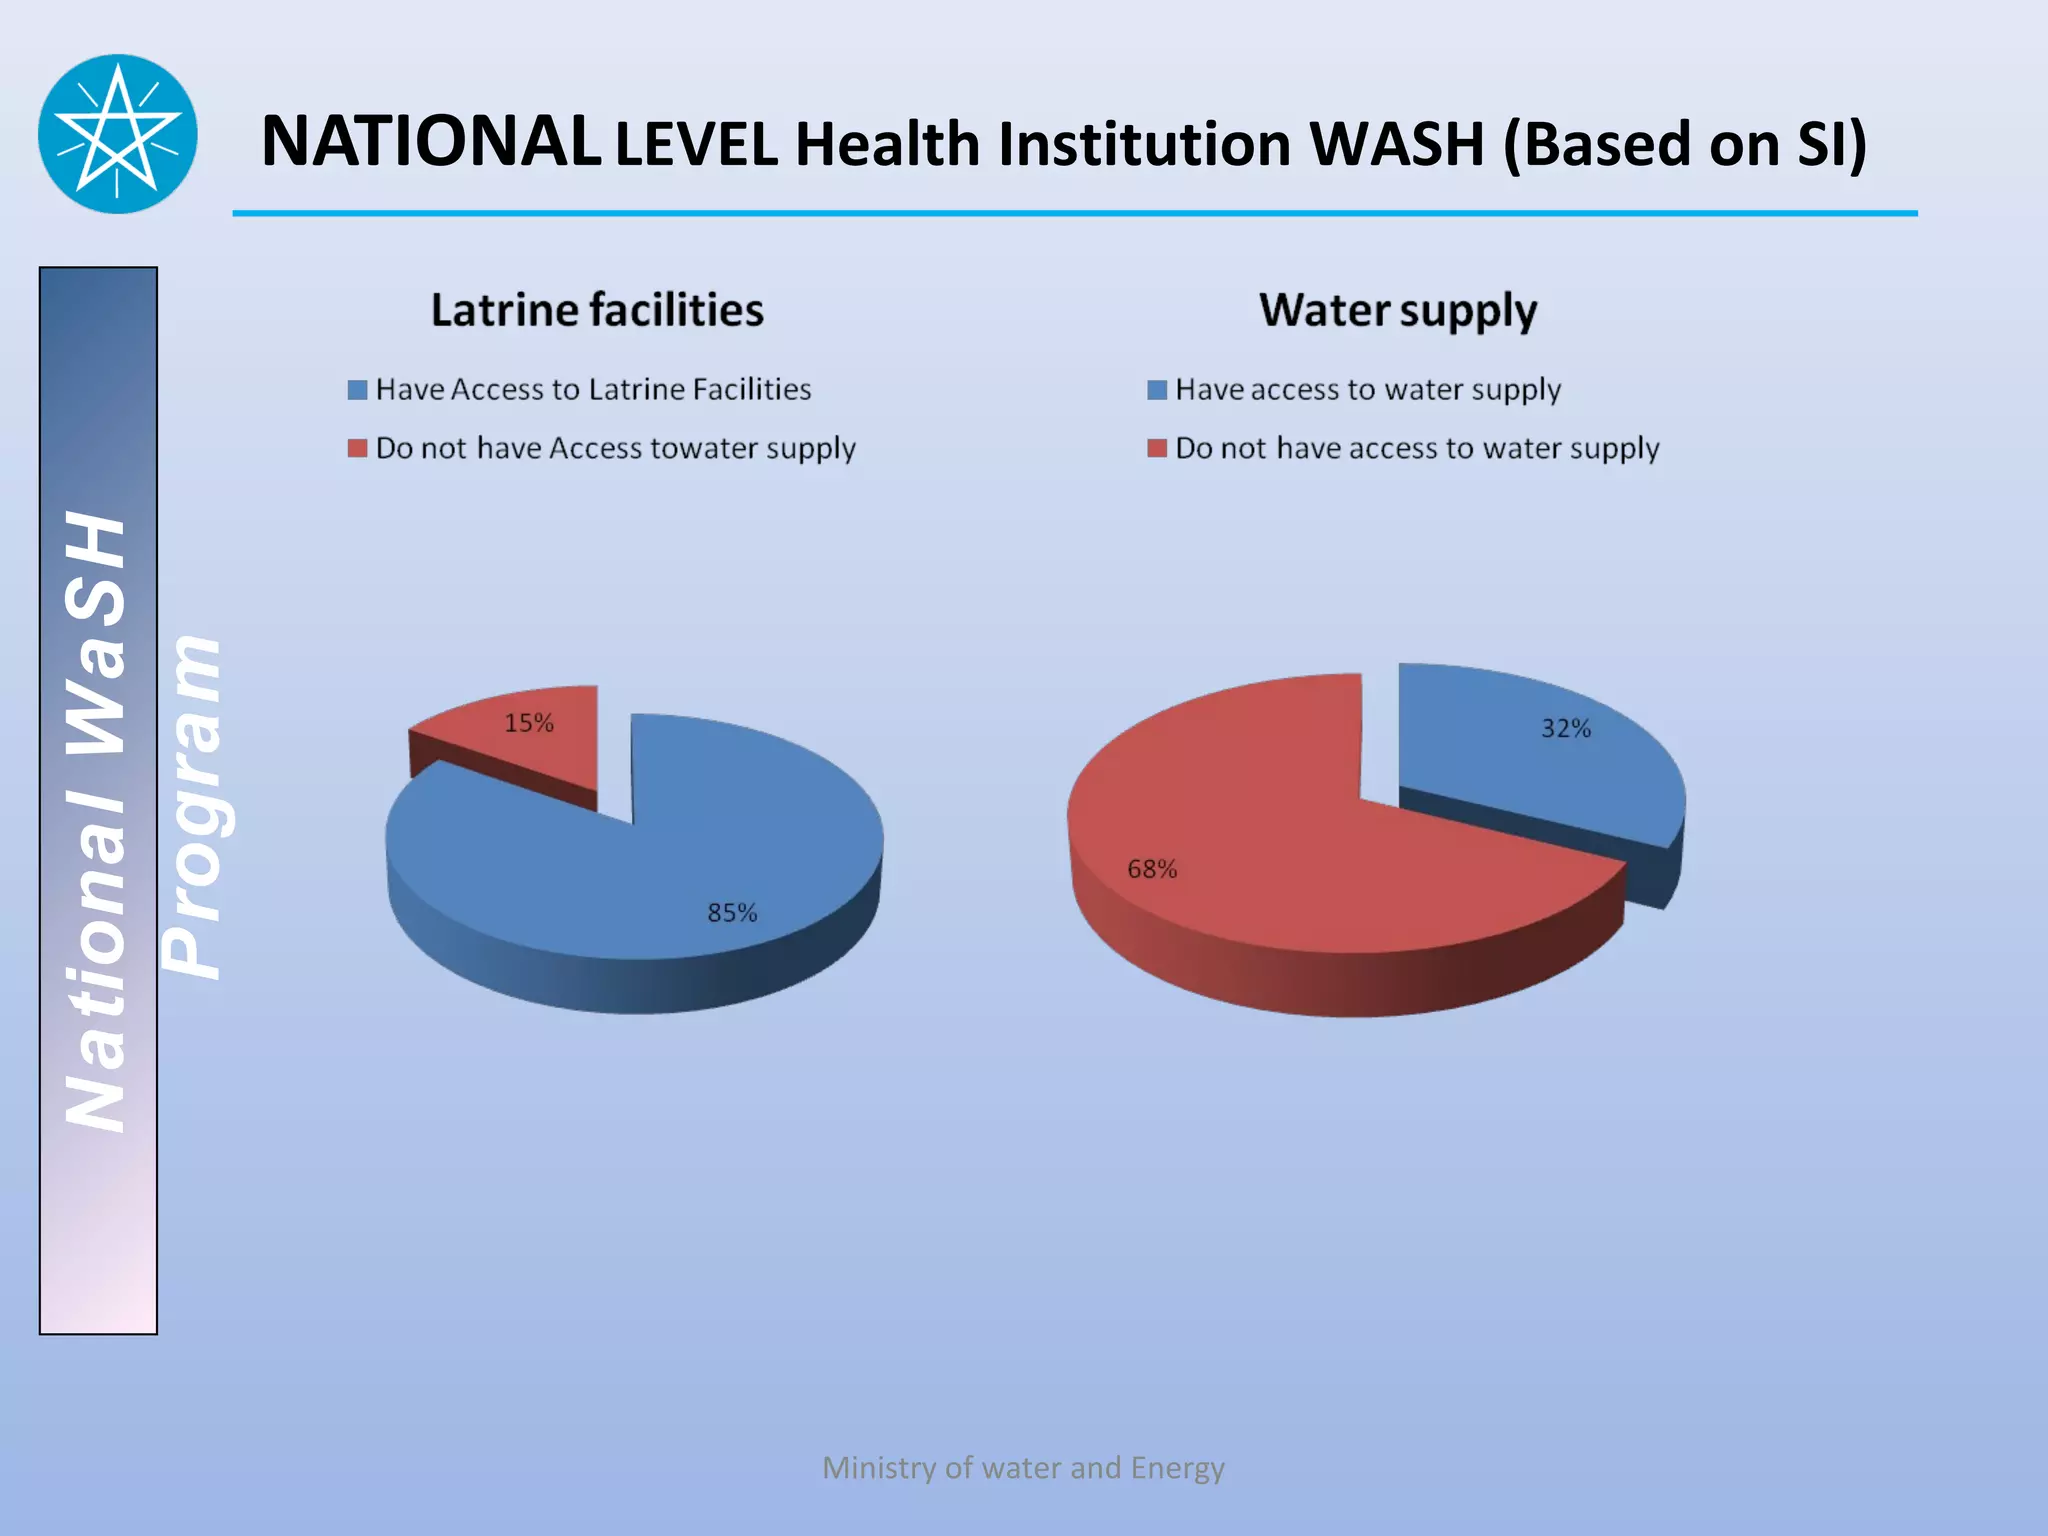
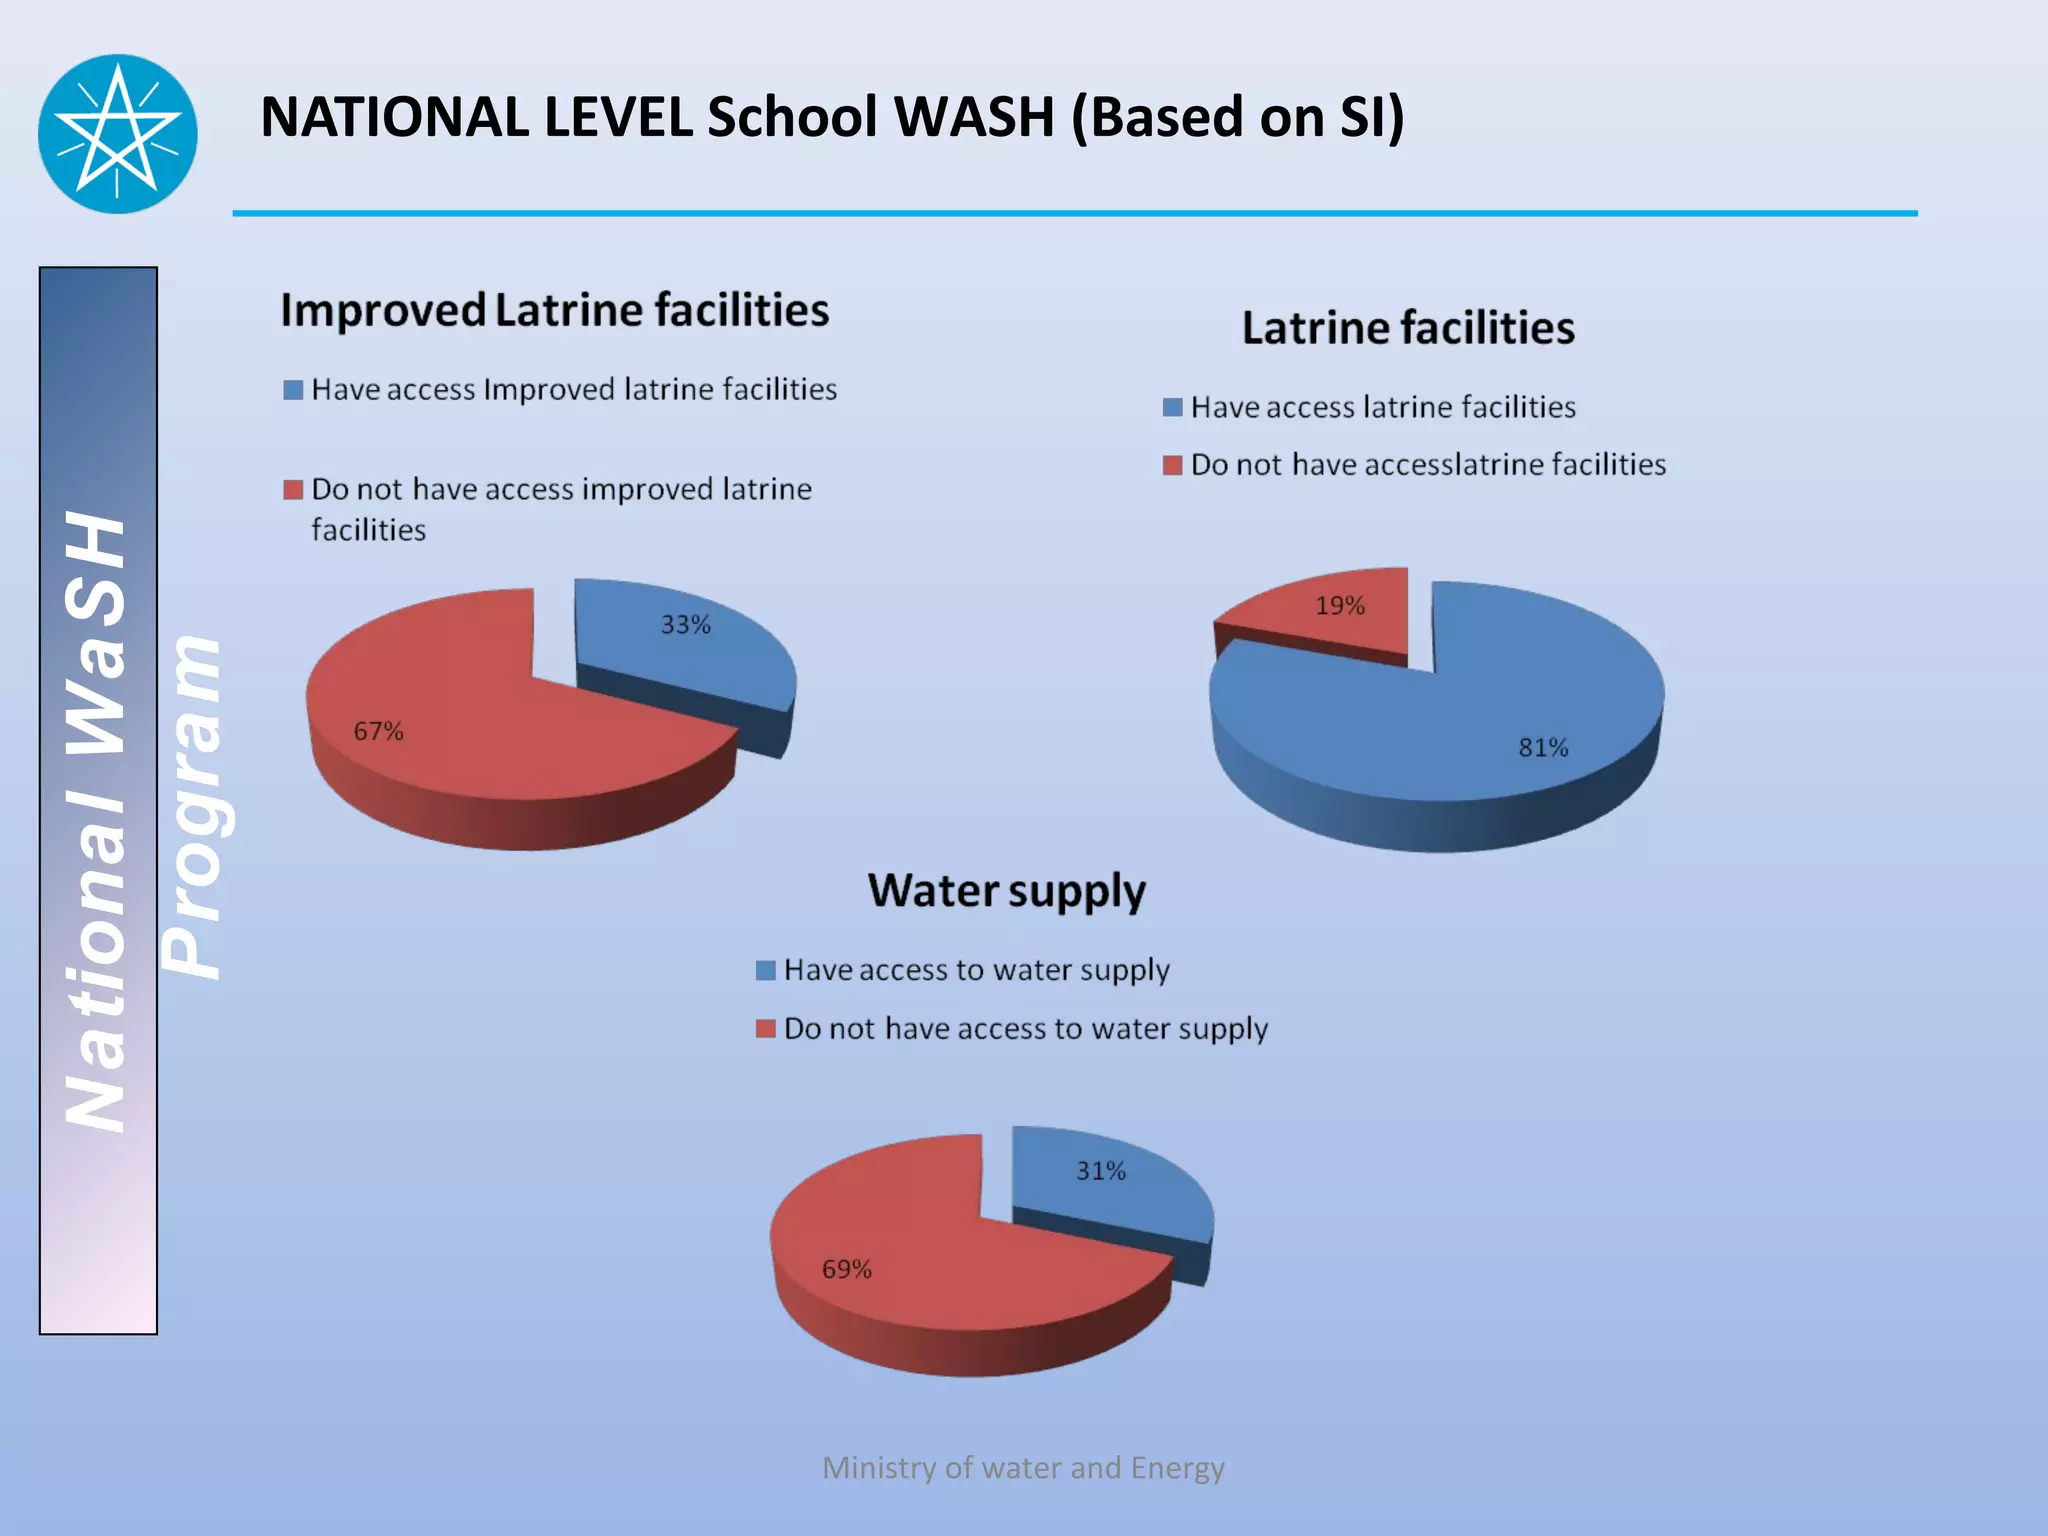
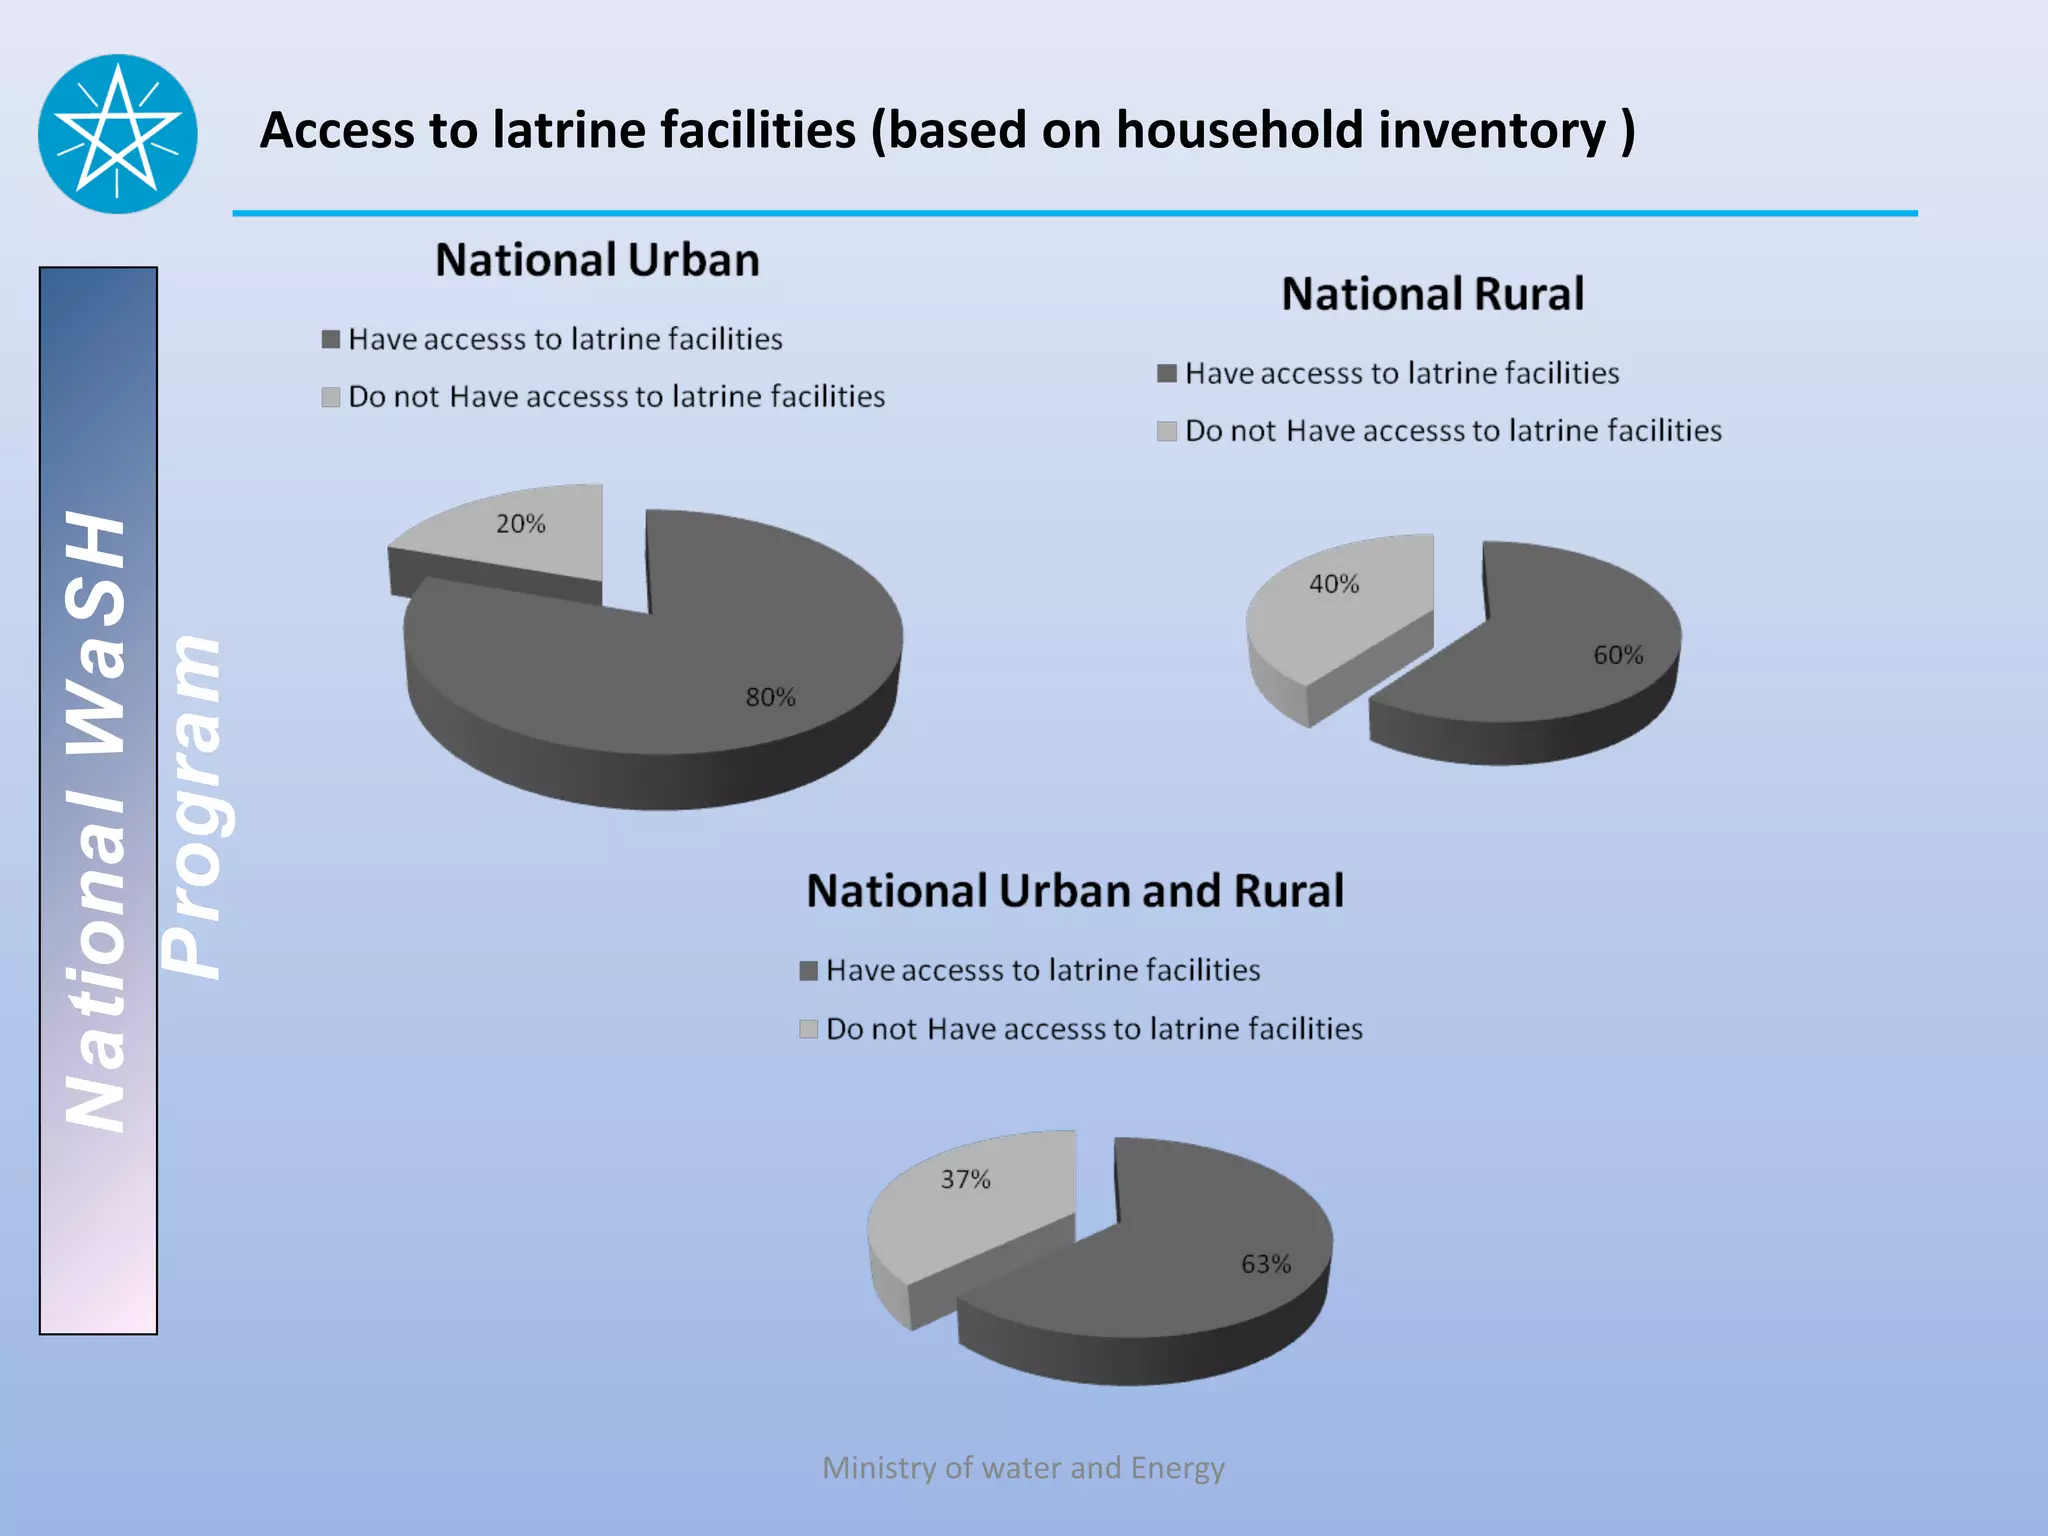
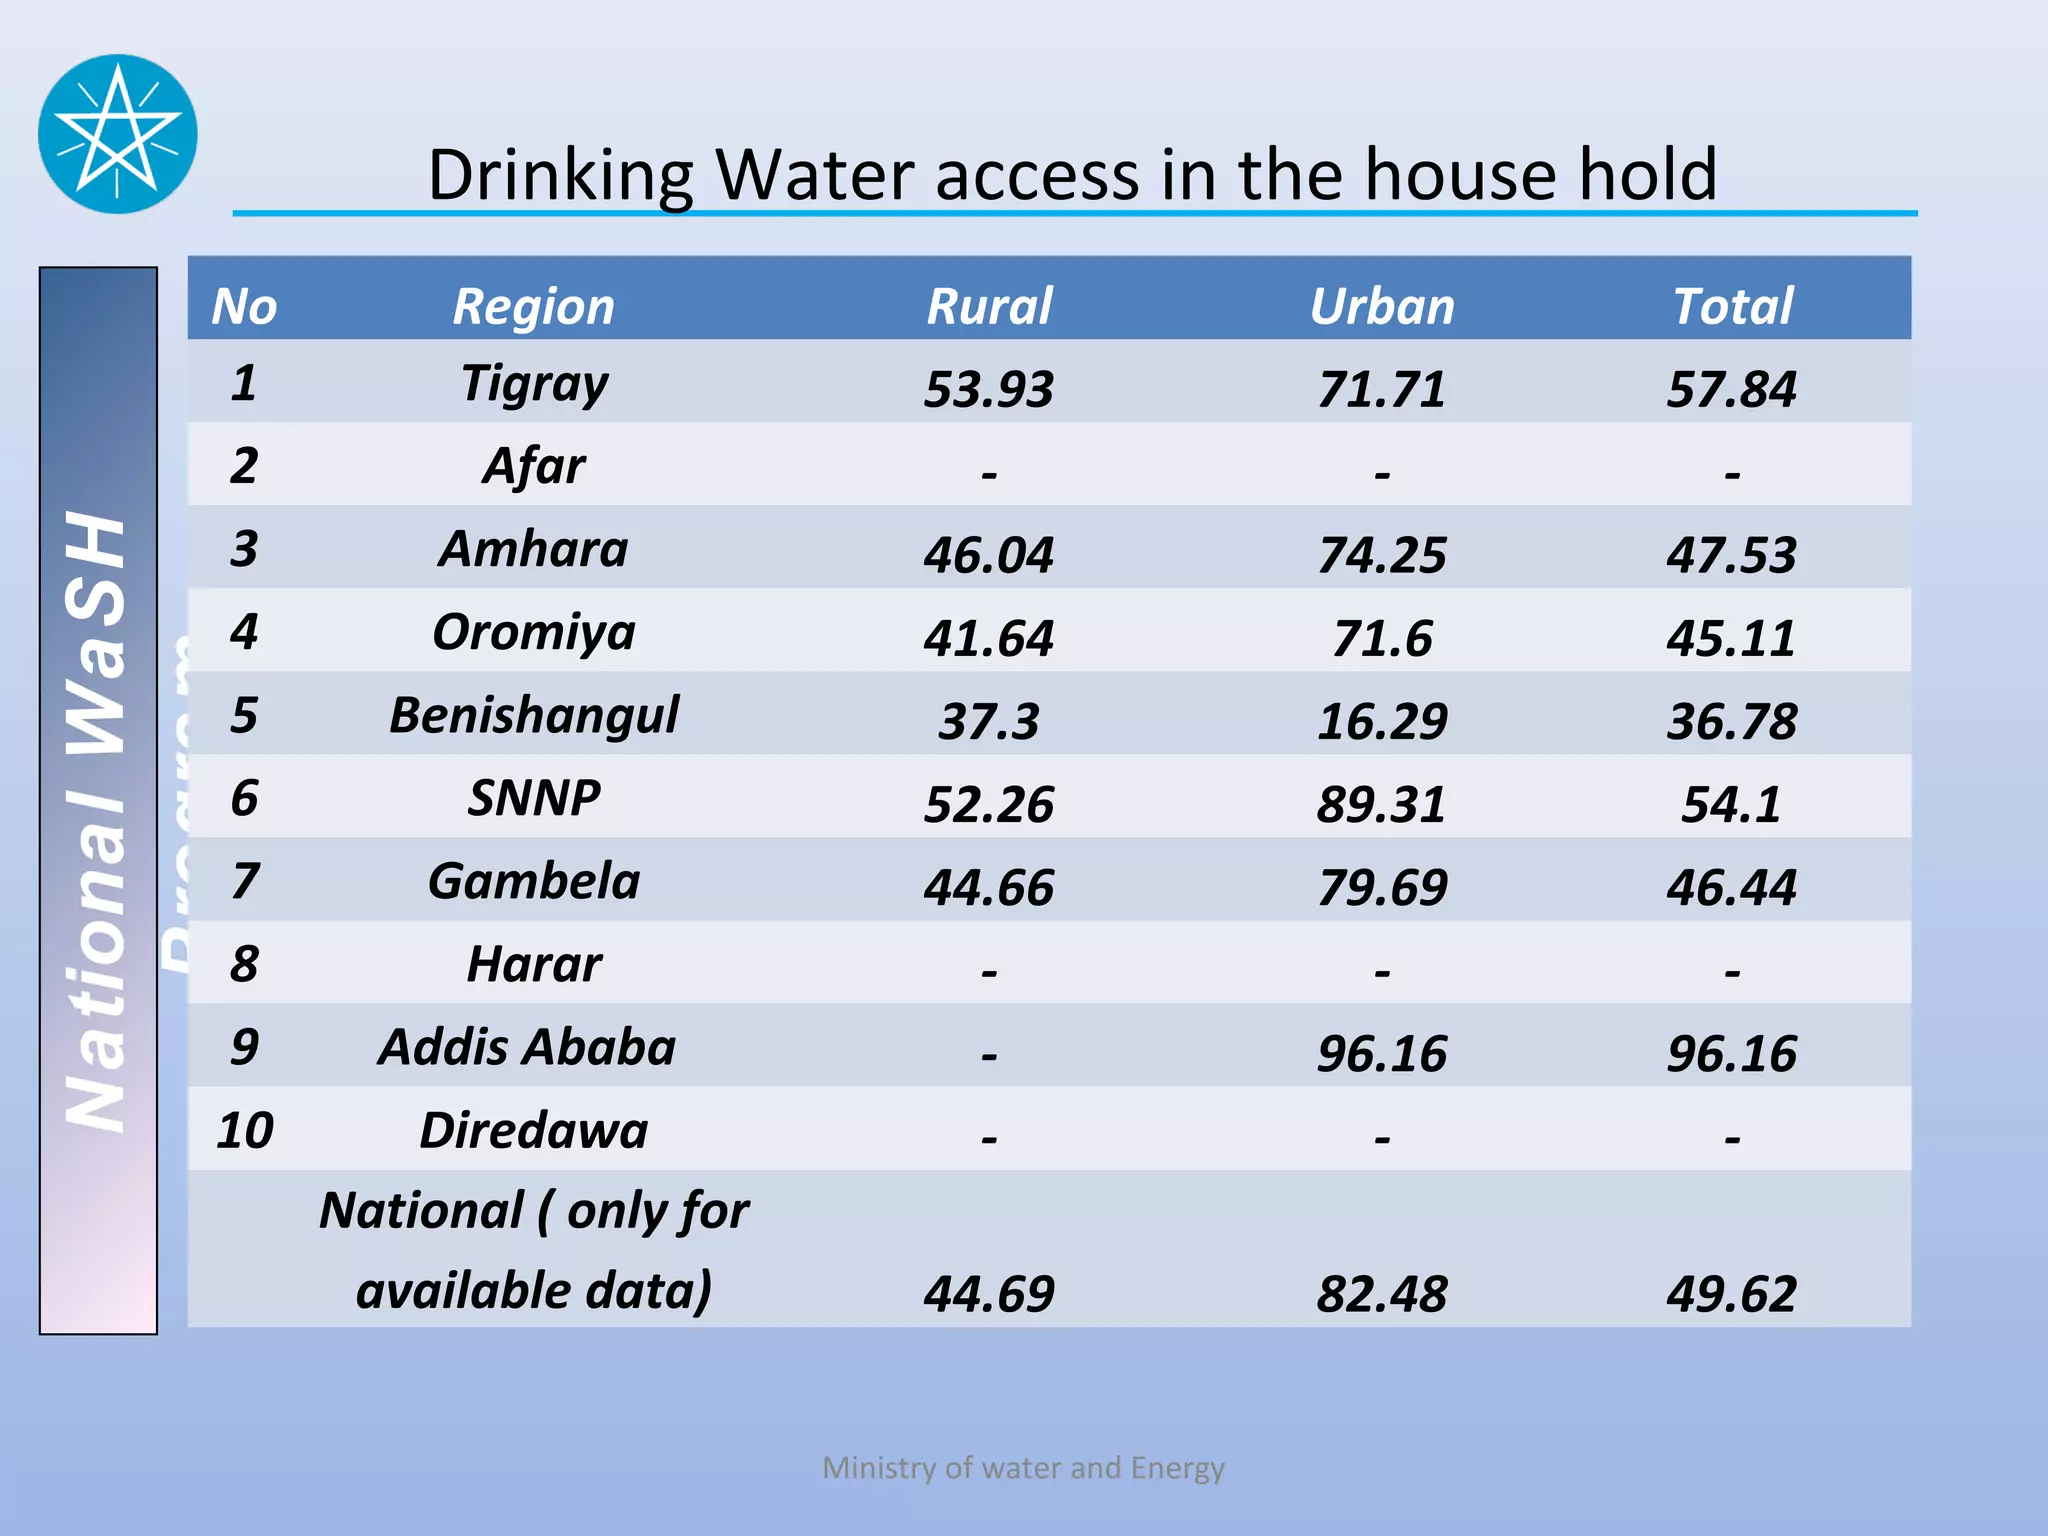
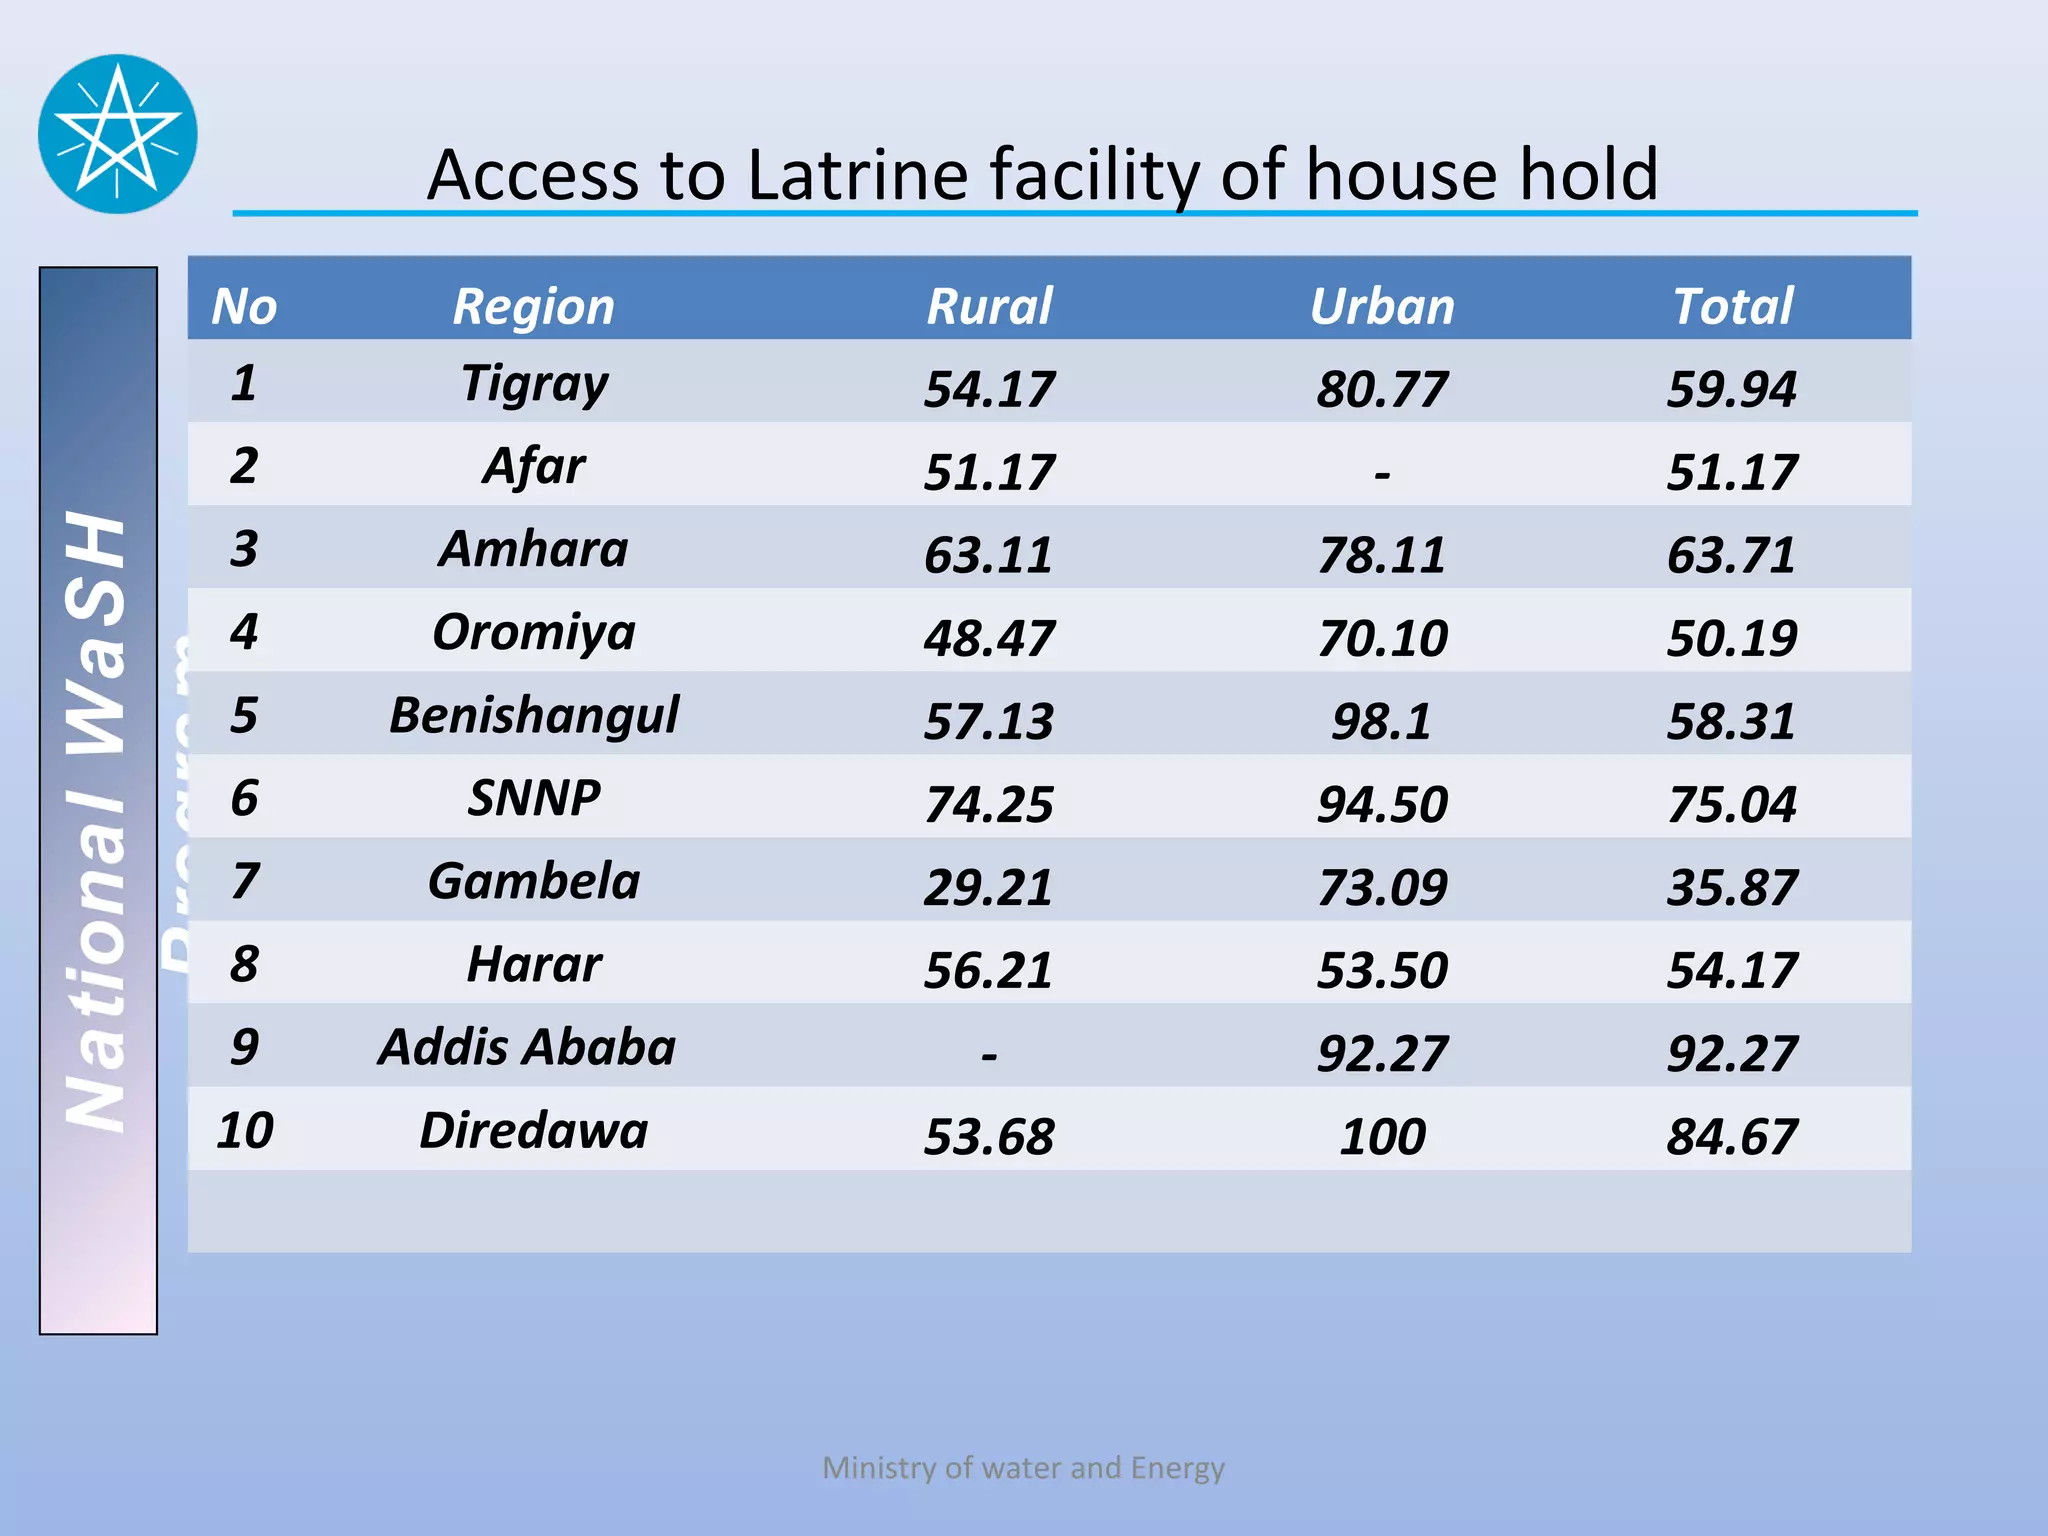
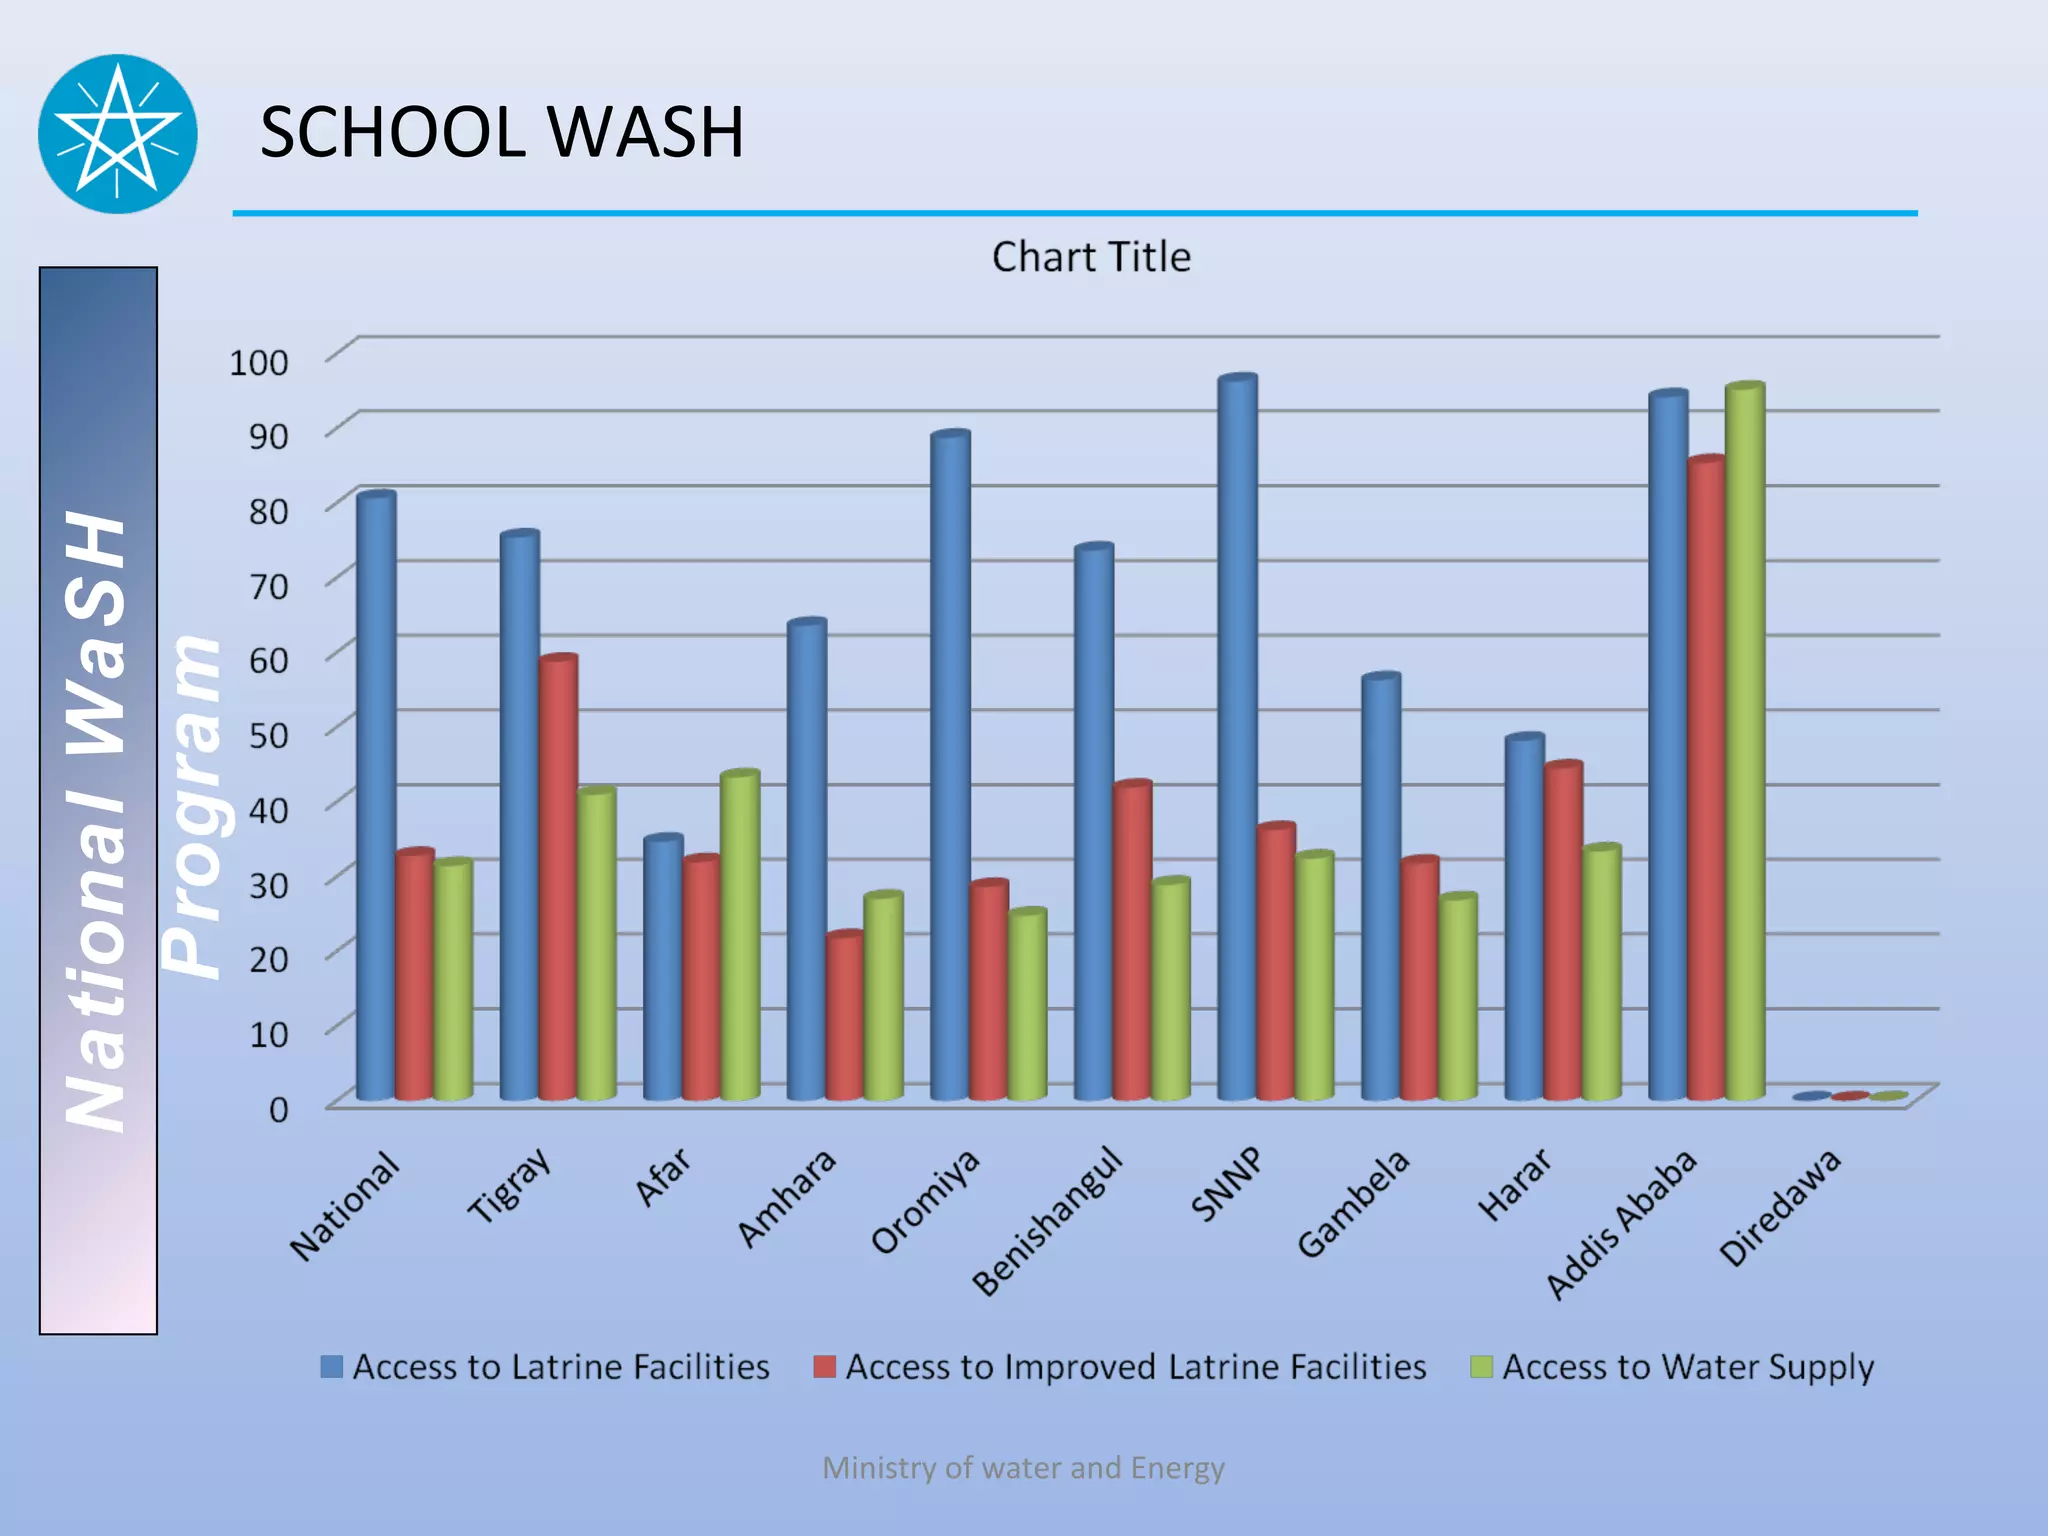
Monitoring Water Supplies and
National WaSH Program


                                Sanitation in Ethiopia
                                          Prepared by:- Tamene Hailu Debela
                                      National WASH Inventory Office (NWI)


                                                                MoWE
                                                                April, 2013
Out line

       I.       National WASH inventory
       II.      Some key figures and additional benefits
National WaSH


       III.     Selected KPI Definitions and Computation Methods
   Program


       IV.      Draft Selected KPI Result based on ME-MIS
       V.       Problems/ issues
       VI.      Next Steps


                               Ministry of water and Energy
I. National WASH Inventory

          • First of its kind in Ethiopia
          • Grew from need to strengthen monitoring and evaluation in
            the WaSH sector
National WaSH


          • Aims of the initiative
   Program


             • to provide baseline data for planning and various
                monitoring purposes
             • to establish the backbone of a reliable, sector-wide M&E
                system
             • to put an end to the dissimilarity over access figures


                               Ministry of water and Energy
Scope and process

          What gets measured?
           Rural community water supply schemes
           Rural household hygiene and sanitation
National WaSH


           Rural household drinking water use
           WASH in schools and health facilities (institutional
   Program


            WASH), and
           Urban water supply, sanitation and hygiene
          And how?
           Steering committees established at federal level, regional,
            Zonal, Woreda and kebele level
           National WASH Inventory project office established at all
            levels
           Sensitization mission for administrators at all levels
                                Ministry of water and Energy
Continued….
           Awareness given to the community through mass media
            like national and local Radio, TV, and newspapers
           Training given for supervisors, nominators and data
            encoders: about 70,000 people have participated in NWI
National WaSH


           Data collected with approval of Kebele and Woreda
            administration
   Program


           Data entry is done at regional level using Access database
           Soft copy to national WASH inventory project office for
            the analysis of KPI
           Regions clean their data and undertake analysis with the
            support of WASH M&E MIS


                               Ministry of water and Energy
Current progress

          • All regions (except Somali region) have completed data
            collection and data entry
          • Regions are cleaning their data
National WaSH


          • The MoWE has finished preliminary analysis of data using
            the Management Information Software (MIS)
   Program


          • Up date the data started in regions
          • Role out done for 58 woredas and will continue to others
          • Procurement of server and computer is on progress


                               Ministry of water and Energy
III. Some key figures
           92,588 rural water supply schemes
           1,605 town water supply schemes
           30,000 schools
           20,000 health institutions
National WaSH


           12 million households asked about drinking water supply
   Program


            and sanitation
           More than 100 million birr spent (excluding format and
            manual printing, Access database/MIS, NGO and
            Regional input)


                                 Ministry of water and Energy
Rural Water Supply Schemes
                                                                      Benshang                              Dire
        Type of Rural Schemes       Tigray   Afar   Amhara    Oromiya ul/gumuz     SNNP    Gambela Hareri   Dawa    Total
                Deep Well with
                 Distribution       159      83      338      1,625           6    477       17      7      23     2735
           Hand Dug Well with
                                    5,349    273 19,291 5,749            1,457     1,708    166     219     17     34,229
National WaSH


             Normal Pump
           Hand Dug Well with
              Rope Pump             171      398    3,699     1,036           38   179       36     81       1     5639
   Program


                    Other           110                        527                 5,709                           6346

        Protected on-spot Spring    690      66     9,643 10,975              38   2,999     94     47      44     24596

                 Shallow Well       2,906    126    1,667     2,030       213      871      245     31      17     8,106
         Spring with Distribution
                  Small             468      362    2,958     2,637           31   4,259     11     45      166    10937

                    Total           9853 1308 37,596 24,579 1783 16,202                     569     430     268    92588


                                               Ministry of water and Energy
Additional benefits

          • Integrating many WASH actors
                  the NWI has been a force for integration i.e. both between
                   different levels of government and within each administrative
                   level.
National WaSH


                  enhanced cooperation with CSOs
   Program


                  allowed lower levels of government to engage with communities
          • Data retained at woreda level
              assists woreda officials with planning and maintenance work
                  Feedback from woreda staff also indicates that the NWI
                   generated vast amounts of informal knowledge at woreda level


                                     Ministry of water and Energy
National WaSH


                IV. Selected KPI Definitions and
   Program


                      Computation Methods


                        Ministry of water and Energy
RURAL

          • Access
                  Definition :- % of rural population that is provided access to 15
                   l/c/d water within 1.5 km of the water supply point
National WaSH


                  Computation (Number of beneficiaries that have accessed and
                   could access 15 l/c/d water within 1.5 km of the water supply
   Program


                   point , including repairable non-functional water supply
                   schemes/ Total population from CSA) x 100 (%)
          • Usage
                  Definition :- % of rural population that is actually using water
                   from the water point irrespective of quantities used and distance
                   from the water point
                  Computation :-      (Number of beneficiaries actually using
                   water from water supply point: as per the data from the annual
                   inventory of water supply schemes / Total population from CSA)
                   x 100 (%)
                                      Ministry of water and Energy
URBAN

          • Access
                  Definition % of urban population that is provided access to 20
                   l/c/d improved water from the domestic/household water
National WaSH


                   consumptions inventory
                 Data NeededA = Domestic Water Consumptions
   Program


                              B = Total population from CSA
                  Computation ((A*1000)/(365*20) )/B) x 100 (%)

          • Usage
                  Definition % of population served by the water supply utilities
                 Data NeededA = Served Population
                             B = Total population from CSA
                  Computation       (Served Population/ Total number of people)
                   x 100 (%)

                                      Ministry of water and Energy
Functionality of rural schemes

          • Definition
                  % of Functional rural water supply schemes
National WaSH


          • Computation
   Program


                 Number of functional schemes/ Total number
                  of water schemes x 100 (%)


                                 Ministry of water and Energy
Health Institutions- WaSH

          • Access to Latrine Facilities
              Definition :-        % of Health Institutions having access
                           to Latrine Facilities
              Computation :- (Total No. of Health Institutions
National WaSH


               having access for Latrine Facilities/ Total No. of Health
   Program


                 Institutions in required area) x 100 (%)
          • Access to Water Supply
              Definition :-        % of Health Institutions having access to
                           water supply
              Computation :- (Total No. of Health Institutions having
                 access to water supply/Total No. of Health
               Institutions in required area) x 100 (%)


                                    Ministry of water and Energy
School – WaSH
          •     Access to Latrine Facilities
                  Definition :- % of Schools having access to Latrine
                                Facilities
                  Computation :-          (Total No. of Schools having access for Latrine
National WaSH


                   Facilities/ Total No. of Schools in required area) x 100 (%)
          •     Access to Improved Latrine Facilities
   Program


                  Definition :- % of Schools having access to Improved
                     Latrine Facilities
                  Computation :-          (Total No. of Schools having access for
                                Improved Latrine Facilities/ Total No. of Schools in
                     required area) x 100 (%)
          •     Access to Water Supply
                  Definition :-     % of schools with Drinking Water
                                Supply
                  Computation :-          (Total No. of schools with Water Supply /Total
                                number of schools in the required area) x
                     100 (%) Draft KPI Results
                                         Ministry of water and Energy
National WaSH
   Program


                V. Selected KPI Result based on ME-MIS


                             Ministry of water and Energy
NATIONAL LEVEL WATER SUPPLY Access

          I
National WaSH
   Program


                          Ministry of water and Energy
National WaSH   NATIONAL LEVEL WATER SUPPLY Usage (Based on SI)
   Program


                               Ministry of water and Energy
NATIONAL LEVEL Health Institution WASH (Based on SI)
National WaSH
   Program


                                  Ministry of water and Energy
National WaSH   NATIONAL LEVEL School WASH (Based on SI)
   Program


                                   Ministry of water and Energy
National WaSH   Access to latrine facilities (based on household inventory )
   Program


                                        Ministry of water and Energy
National WaSH   Access to Drinking water (based on household inventory )
   Program


                                       Ministry of water and Energy
National WaSH   Comparison of findings
   Program


                                Ministry of water and Energy
REGIONAL LEVEL WATER SUPPLY –Rural

                                                       Access

           No          Region                  (With in 1.5 Km)   Usage
            1          Tigray                           52.74     69.21
National WaSH


            2           Afar                            34.79     71.59
   Program


            3         Amhara                            51.58     62.83
            4         Oromiya                           49.76     61.61
            5        Benishangul                        59.68     64.87
            6           SNNP                            42.02     55.50
            7         Gambela                           64.73     76.55
            8          Harar                            65.11     68.63
           10         Diredawa                          75.63     94.43
                                   Ministry of water and Energy
Functionality status of Rural Water Supply
                    Schemes
National WaSH
   Program


                                Ministry of water and Energy
REGIONAL LEVEL WATER SUPPLY – Urban

                                                     Access       Usage

            No      Region            (Dom. Consum. 20l/c/d)   (Served Pop.)
             1      Tigray                    68.44                73.78
National WaSH


             2        Afar                    82.14                85.38
             3     Amhara
   Program


                                              65.43                93.28
             4     Oromiya                    75.38                71.84
             5   Benishangul                  46.24                78.45
             6       SNNP                     65.11                84.08
             7    Gambela                     80.23                83.15
             8      Harar                     99.99               100.00
             9   Addis Ababa                  82.22                94.10
            10    Diredawa                    87.57                90.00


                               Ministry of water and Energy
Drinking Water access in the house hold
           No        Region                  Rural                   Urban   Total
            1         Tigray                 53.93                   71.71   57.84
            2          Afar                    -                       -       -
            3        Amhara
National WaSH


                                             46.04                   74.25   47.53
            4       Oromiya                  41.64                    71.6   45.11
   Program


            5     Benishangul                 37.3                   16.29   36.78
            6         SNNP                   52.26                   89.31    54.1
            7       Gambela                  44.66                   79.69   46.44
            8         Harar                    -                       -       -
            9     Addis Ababa                  -                     96.16   96.16
           10       Diredawa                   -                       -       -
                National ( only for
                 available data)             44.69                   82.48   49.62

                                      Ministry of water and Energy
Access to Latrine facility of house hold
           No      Region            Rural                   Urban   Total
            1      Tigray            54.17                   80.77   59.94
            2        Afar            51.17                     -     51.17
            3     Amhara
National WaSH


                                     63.11                   78.11   63.71
            4     Oromiya            48.47                   70.10   50.19
   Program


            5   Benishangul          57.13                    98.1   58.31
            6       SNNP             74.25                   94.50   75.04
            7    Gambela             29.21                   73.09   35.87
            8      Harar             56.21                   53.50   54.17
            9   Addis Ababa            -                     92.27   92.27
           10    Diredawa            53.68                    100    84.67


                              Ministry of water and Energy
National WaSH   HEALTH INSTITUTIONS WASH
   Program


                              Ministry of water and Energy
National WaSH   SCHOOL WASH
   Program


                              Ministry of water and Energy
National WaSH   Different reports, different figures
   Program


                                 Ministry of water and Energy
VI. Problems/ issues
          • Data Collection:
                  The number of forms produced.; Regions had a shortfall of forms,
                   especially forms 4 & 5
                  The nature of the forms. it would be better if forms 4 and 5 were
National WaSH


                   consolidated into a single form to avoid repetition of Household names
                   etc at both the data collection and data entry phases.
   Program


                  Missing GPS data: There were problems with recording the GPS
                   coordinates of schemes. there was some confusion in using the UTM
                   reading styles and additional GPS training was given. Roughly 33% of
                   schemes do not have GPS coordinates and about 15% of schools and
                   health centres are also missing this data. The reasons for this were
                     • A lack of training and experience in using the GPS equipment and


                                        Ministry of water and Energy
Con…
                 • Other missing data.: yield, functionality status, the number of
                   households within 1.5km of the water source, health type, latrine type,
                   and water supply type, some schools don’t have information on the
                   number of students in the school.
National WaSH


                 • Timing of the NWI. The fact the NWI was carried out in the rainy season
                   and this caused challenges for the enumerators. This meant that often in
   Program


                   the day the farmer was on their farm land and the enumerator had to
                   find the farmers on their land.
                 • Other logistical challenges. there were initial worries about a lack of
                   vehicles for data collection but NGOs contributed to providing vehicles.
                   Also there were delays in the sending of budget to some regions.


                                        Ministry of water and Energy
Con…
          •     Data Entry:
                  Delays in starting data entry: Although data entry started in September
                   there have been delays due to the lengthy procurement process of
                   computers and network installation.
National WaSH


                  Duplication of kebeles unique identifiers: In Oromia there were
                   problems initially with the data entry software allowing Kebeles with
   Program


                   similar names to be entered under the same unique identifier. This was
                   solved by putting all 7276 kebeles into a single main table and giving
                   each the unique identifier that CSA has for them.
                  The time consuming business of forms 4 & 5: The biggest obstacle to
                   successful data entry is the sheer number of forms to be entered. In
                   Oromia alone there are 5.2 million Households to be entered


                                         Ministry of water and Energy
VII. Next Steps
          • Reviewing completeness:, if the NWI is to be truly national the
            Somali region inventory must be undertaken.
          • Data Cleaning by Regions: Data should be sent to the Central
            Statistical Authority (CSA) for verification.
National WaSH


          • Verification: NWI data needs to be assessed in terms of quality and
   Program


            completeness. means that the NWI data will be verified by the
            Central Statistical Agency.
              The CSA has a Data Quality Directorate, which is mandated with
                certifying the quality of any data that is to be published as a
                National Statistic.
              Data quality can only be measured by doing field based sample
                verification


                                   Ministry of water and Energy
Con…

          • Household Data: The time consuming business of forms 4 & 5’,
                entering forms 4 & 5 which represent household level data is taking
                a long time unless a substantial amount more money is invested in
                the data entry process.
National WaSH


                  So that we recommend entering only kebele-level summaries.
   Program


                  CSA is expecting household level data and although Kebele
                    summaries will not be as accurate as household level data the
                    accuracy of the kebeles summaries can be checked with
                    sampling.


                                      Ministry of water and Energy
Con…

          • Data Analysis:
                 Now the data has been entered and
                  preliminary analysis done by the MoWE using
National WaSH


                  MIS software.
   Program


                  Although final analysis must use verified data
                  from CSA, the NWIPO will use the preliminary
                  data at the moment.
                 At a later stage, analysis training will be rolled
                  out to regions to allow them to produce
                  Woreda Report Cards.

                                 Ministry of water and Energy
Con…

          • Reporting/Statistical abstracts
              After analysis reports and statistical abstracts will be produced
               for the national and regional level.
              These statistical abstracts will have disaggregated data which will
National WaSH


               be used by regions and at the national level.
   Program


              Reporting will be according to the 15 key performance indicators
               for the WASH sector.
              After analysis reports and statistical abstracts have been
               produced there has to be:
                 • A concept note must be developed for final NWI publication
                 • Data access by different levels and third parties must be
                    immediately clarified


                                    Ministry of water and Energy
Con…

          • Sustainability
                  The NWI establishes base line data for the WASH sector, but this
                   must be regularly updated. The things that need to be done to
                   ensure this happens:
National WaSH


                     • All sector stakeholders should come together to
   Program


                       discuss both their data needs as well as available
                       resources for updating.
                     • A second aspect is putting the collected data into
                       active use. This will require training (on evidence
                       based planning etc) to be rolled out to the woreda
                       level at least.


                                      Ministry of water and Energy
National WaSH Program


     THANK YOU

Monitoring water supplies and sanitation in Ethiopia

  • 1.
    Monitoring Water Suppliesand National WaSH Program Sanitation in Ethiopia Prepared by:- Tamene Hailu Debela National WASH Inventory Office (NWI) MoWE April, 2013
  • 2.
    Out line I. National WASH inventory II. Some key figures and additional benefits National WaSH III. Selected KPI Definitions and Computation Methods Program IV. Draft Selected KPI Result based on ME-MIS V. Problems/ issues VI. Next Steps Ministry of water and Energy
  • 3.
    I. National WASHInventory • First of its kind in Ethiopia • Grew from need to strengthen monitoring and evaluation in the WaSH sector National WaSH • Aims of the initiative Program • to provide baseline data for planning and various monitoring purposes • to establish the backbone of a reliable, sector-wide M&E system • to put an end to the dissimilarity over access figures Ministry of water and Energy
  • 4.
    Scope and process What gets measured?  Rural community water supply schemes  Rural household hygiene and sanitation National WaSH  Rural household drinking water use  WASH in schools and health facilities (institutional Program WASH), and  Urban water supply, sanitation and hygiene And how?  Steering committees established at federal level, regional, Zonal, Woreda and kebele level  National WASH Inventory project office established at all levels  Sensitization mission for administrators at all levels Ministry of water and Energy
  • 5.
    Continued….  Awareness given to the community through mass media like national and local Radio, TV, and newspapers  Training given for supervisors, nominators and data encoders: about 70,000 people have participated in NWI National WaSH  Data collected with approval of Kebele and Woreda administration Program  Data entry is done at regional level using Access database  Soft copy to national WASH inventory project office for the analysis of KPI  Regions clean their data and undertake analysis with the support of WASH M&E MIS Ministry of water and Energy
  • 6.
    Current progress • All regions (except Somali region) have completed data collection and data entry • Regions are cleaning their data National WaSH • The MoWE has finished preliminary analysis of data using the Management Information Software (MIS) Program • Up date the data started in regions • Role out done for 58 woredas and will continue to others • Procurement of server and computer is on progress Ministry of water and Energy
  • 7.
    III. Some keyfigures  92,588 rural water supply schemes  1,605 town water supply schemes  30,000 schools  20,000 health institutions National WaSH  12 million households asked about drinking water supply Program and sanitation  More than 100 million birr spent (excluding format and manual printing, Access database/MIS, NGO and Regional input) Ministry of water and Energy
  • 8.
    Rural Water SupplySchemes Benshang Dire Type of Rural Schemes Tigray Afar Amhara Oromiya ul/gumuz SNNP Gambela Hareri Dawa Total Deep Well with Distribution 159 83 338 1,625 6 477 17 7 23 2735 Hand Dug Well with 5,349 273 19,291 5,749 1,457 1,708 166 219 17 34,229 National WaSH Normal Pump Hand Dug Well with Rope Pump 171 398 3,699 1,036 38 179 36 81 1 5639 Program Other 110 527 5,709 6346 Protected on-spot Spring 690 66 9,643 10,975 38 2,999 94 47 44 24596 Shallow Well 2,906 126 1,667 2,030 213 871 245 31 17 8,106 Spring with Distribution Small 468 362 2,958 2,637 31 4,259 11 45 166 10937 Total 9853 1308 37,596 24,579 1783 16,202 569 430 268 92588 Ministry of water and Energy
  • 9.
    Additional benefits • Integrating many WASH actors  the NWI has been a force for integration i.e. both between different levels of government and within each administrative level. National WaSH  enhanced cooperation with CSOs Program  allowed lower levels of government to engage with communities • Data retained at woreda level  assists woreda officials with planning and maintenance work  Feedback from woreda staff also indicates that the NWI generated vast amounts of informal knowledge at woreda level Ministry of water and Energy
  • 10.
    National WaSH IV. Selected KPI Definitions and Program Computation Methods Ministry of water and Energy
  • 11.
    RURAL • Access  Definition :- % of rural population that is provided access to 15 l/c/d water within 1.5 km of the water supply point National WaSH  Computation (Number of beneficiaries that have accessed and could access 15 l/c/d water within 1.5 km of the water supply Program point , including repairable non-functional water supply schemes/ Total population from CSA) x 100 (%) • Usage  Definition :- % of rural population that is actually using water from the water point irrespective of quantities used and distance from the water point  Computation :- (Number of beneficiaries actually using water from water supply point: as per the data from the annual inventory of water supply schemes / Total population from CSA) x 100 (%) Ministry of water and Energy
  • 12.
    URBAN • Access  Definition % of urban population that is provided access to 20 l/c/d improved water from the domestic/household water National WaSH consumptions inventory Data NeededA = Domestic Water Consumptions Program B = Total population from CSA  Computation ((A*1000)/(365*20) )/B) x 100 (%) • Usage  Definition % of population served by the water supply utilities Data NeededA = Served Population B = Total population from CSA  Computation (Served Population/ Total number of people) x 100 (%) Ministry of water and Energy
  • 13.
    Functionality of ruralschemes • Definition  % of Functional rural water supply schemes National WaSH • Computation Program Number of functional schemes/ Total number of water schemes x 100 (%) Ministry of water and Energy
  • 14.
    Health Institutions- WaSH • Access to Latrine Facilities  Definition :- % of Health Institutions having access to Latrine Facilities  Computation :- (Total No. of Health Institutions National WaSH having access for Latrine Facilities/ Total No. of Health Program Institutions in required area) x 100 (%) • Access to Water Supply  Definition :- % of Health Institutions having access to water supply  Computation :- (Total No. of Health Institutions having access to water supply/Total No. of Health Institutions in required area) x 100 (%) Ministry of water and Energy
  • 15.
    School – WaSH • Access to Latrine Facilities  Definition :- % of Schools having access to Latrine Facilities  Computation :- (Total No. of Schools having access for Latrine National WaSH Facilities/ Total No. of Schools in required area) x 100 (%) • Access to Improved Latrine Facilities Program  Definition :- % of Schools having access to Improved Latrine Facilities  Computation :- (Total No. of Schools having access for Improved Latrine Facilities/ Total No. of Schools in required area) x 100 (%) • Access to Water Supply  Definition :- % of schools with Drinking Water Supply  Computation :- (Total No. of schools with Water Supply /Total number of schools in the required area) x 100 (%) Draft KPI Results Ministry of water and Energy
  • 16.
    National WaSH Program V. Selected KPI Result based on ME-MIS Ministry of water and Energy
  • 17.
    NATIONAL LEVEL WATERSUPPLY Access I National WaSH Program Ministry of water and Energy
  • 18.
    National WaSH NATIONAL LEVEL WATER SUPPLY Usage (Based on SI) Program Ministry of water and Energy
  • 19.
    NATIONAL LEVEL HealthInstitution WASH (Based on SI) National WaSH Program Ministry of water and Energy
  • 20.
    National WaSH NATIONAL LEVEL School WASH (Based on SI) Program Ministry of water and Energy
  • 21.
    National WaSH Access to latrine facilities (based on household inventory ) Program Ministry of water and Energy
  • 22.
    National WaSH Access to Drinking water (based on household inventory ) Program Ministry of water and Energy
  • 23.
    National WaSH Comparison of findings Program Ministry of water and Energy
  • 24.
    REGIONAL LEVEL WATERSUPPLY –Rural Access No Region (With in 1.5 Km) Usage 1 Tigray 52.74 69.21 National WaSH 2 Afar 34.79 71.59 Program 3 Amhara 51.58 62.83 4 Oromiya 49.76 61.61 5 Benishangul 59.68 64.87 6 SNNP 42.02 55.50 7 Gambela 64.73 76.55 8 Harar 65.11 68.63 10 Diredawa 75.63 94.43 Ministry of water and Energy
  • 25.
    Functionality status ofRural Water Supply Schemes National WaSH Program Ministry of water and Energy
  • 26.
    REGIONAL LEVEL WATERSUPPLY – Urban Access Usage No Region (Dom. Consum. 20l/c/d) (Served Pop.) 1 Tigray 68.44 73.78 National WaSH 2 Afar 82.14 85.38 3 Amhara Program 65.43 93.28 4 Oromiya 75.38 71.84 5 Benishangul 46.24 78.45 6 SNNP 65.11 84.08 7 Gambela 80.23 83.15 8 Harar 99.99 100.00 9 Addis Ababa 82.22 94.10 10 Diredawa 87.57 90.00 Ministry of water and Energy
  • 27.
    Drinking Water accessin the house hold No Region Rural Urban Total 1 Tigray 53.93 71.71 57.84 2 Afar - - - 3 Amhara National WaSH 46.04 74.25 47.53 4 Oromiya 41.64 71.6 45.11 Program 5 Benishangul 37.3 16.29 36.78 6 SNNP 52.26 89.31 54.1 7 Gambela 44.66 79.69 46.44 8 Harar - - - 9 Addis Ababa - 96.16 96.16 10 Diredawa - - - National ( only for available data) 44.69 82.48 49.62 Ministry of water and Energy
  • 28.
    Access to Latrinefacility of house hold No Region Rural Urban Total 1 Tigray 54.17 80.77 59.94 2 Afar 51.17 - 51.17 3 Amhara National WaSH 63.11 78.11 63.71 4 Oromiya 48.47 70.10 50.19 Program 5 Benishangul 57.13 98.1 58.31 6 SNNP 74.25 94.50 75.04 7 Gambela 29.21 73.09 35.87 8 Harar 56.21 53.50 54.17 9 Addis Ababa - 92.27 92.27 10 Diredawa 53.68 100 84.67 Ministry of water and Energy
  • 29.
    National WaSH HEALTH INSTITUTIONS WASH Program Ministry of water and Energy
  • 30.
    National WaSH SCHOOL WASH Program Ministry of water and Energy
  • 31.
    National WaSH Different reports, different figures Program Ministry of water and Energy
  • 32.
    VI. Problems/ issues • Data Collection:  The number of forms produced.; Regions had a shortfall of forms, especially forms 4 & 5  The nature of the forms. it would be better if forms 4 and 5 were National WaSH consolidated into a single form to avoid repetition of Household names etc at both the data collection and data entry phases. Program  Missing GPS data: There were problems with recording the GPS coordinates of schemes. there was some confusion in using the UTM reading styles and additional GPS training was given. Roughly 33% of schemes do not have GPS coordinates and about 15% of schools and health centres are also missing this data. The reasons for this were • A lack of training and experience in using the GPS equipment and Ministry of water and Energy
  • 33.
    Con… • Other missing data.: yield, functionality status, the number of households within 1.5km of the water source, health type, latrine type, and water supply type, some schools don’t have information on the number of students in the school. National WaSH • Timing of the NWI. The fact the NWI was carried out in the rainy season and this caused challenges for the enumerators. This meant that often in Program the day the farmer was on their farm land and the enumerator had to find the farmers on their land. • Other logistical challenges. there were initial worries about a lack of vehicles for data collection but NGOs contributed to providing vehicles. Also there were delays in the sending of budget to some regions. Ministry of water and Energy
  • 34.
    Con… • Data Entry:  Delays in starting data entry: Although data entry started in September there have been delays due to the lengthy procurement process of computers and network installation. National WaSH  Duplication of kebeles unique identifiers: In Oromia there were problems initially with the data entry software allowing Kebeles with Program similar names to be entered under the same unique identifier. This was solved by putting all 7276 kebeles into a single main table and giving each the unique identifier that CSA has for them.  The time consuming business of forms 4 & 5: The biggest obstacle to successful data entry is the sheer number of forms to be entered. In Oromia alone there are 5.2 million Households to be entered Ministry of water and Energy
  • 35.
    VII. Next Steps • Reviewing completeness:, if the NWI is to be truly national the Somali region inventory must be undertaken. • Data Cleaning by Regions: Data should be sent to the Central Statistical Authority (CSA) for verification. National WaSH • Verification: NWI data needs to be assessed in terms of quality and Program completeness. means that the NWI data will be verified by the Central Statistical Agency.  The CSA has a Data Quality Directorate, which is mandated with certifying the quality of any data that is to be published as a National Statistic.  Data quality can only be measured by doing field based sample verification Ministry of water and Energy
  • 36.
    Con… • Household Data: The time consuming business of forms 4 & 5’, entering forms 4 & 5 which represent household level data is taking a long time unless a substantial amount more money is invested in the data entry process. National WaSH  So that we recommend entering only kebele-level summaries. Program  CSA is expecting household level data and although Kebele summaries will not be as accurate as household level data the accuracy of the kebeles summaries can be checked with sampling. Ministry of water and Energy
  • 37.
    Con… • Data Analysis: Now the data has been entered and preliminary analysis done by the MoWE using National WaSH MIS software. Program  Although final analysis must use verified data from CSA, the NWIPO will use the preliminary data at the moment. At a later stage, analysis training will be rolled out to regions to allow them to produce Woreda Report Cards. Ministry of water and Energy
  • 38.
    Con… • Reporting/Statistical abstracts  After analysis reports and statistical abstracts will be produced for the national and regional level.  These statistical abstracts will have disaggregated data which will National WaSH be used by regions and at the national level. Program  Reporting will be according to the 15 key performance indicators for the WASH sector.  After analysis reports and statistical abstracts have been produced there has to be: • A concept note must be developed for final NWI publication • Data access by different levels and third parties must be immediately clarified Ministry of water and Energy
  • 39.
    Con… • Sustainability  The NWI establishes base line data for the WASH sector, but this must be regularly updated. The things that need to be done to ensure this happens: National WaSH • All sector stakeholders should come together to Program discuss both their data needs as well as available resources for updating. • A second aspect is putting the collected data into active use. This will require training (on evidence based planning etc) to be rolled out to the woreda level at least. Ministry of water and Energy
  • 40.

Editor's Notes

  • #2 Ministery of water and Energy
  • #3 Ministery of water and Energy
  • #4 Ministery of water and Energy
  • #5 Ministery of water and Energy
  • #6 Ministery of water and Energy
  • #7 Ministery of water and Energy
  • #8 Ministery of water and Energy
  • #9 Ministery of water and Energy
  • #10 Ministery of water and Energy
  • #11 Ministery of water and Energy
  • #12 Ministery of water and Energy
  • #13 Ministery of water and Energy
  • #14 Ministery of water and Energy
  • #15 Ministery of water and Energy
  • #16 Ministery of water and Energy
  • #17 Ministery of water and Energy
  • #18 Ministery of water and Energy
  • #19 Ministery of water and Energy
  • #20 Ministery of water and Energy
  • #21 Ministery of water and Energy
  • #22 Ministery of water and Energy
  • #23 Ministery of water and Energy
  • #24 Ministery of water and Energy
  • #25 Ministery of water and Energy
  • #26 Ministery of water and Energy
  • #27 Ministery of water and Energy
  • #28 Ministery of water and Energy
  • #29 Ministery of water and Energy
  • #30 Ministery of water and Energy
  • #31 Ministery of water and Energy
  • #32 Ministery of water and Energy
  • #33 Ministery of water and Energy
  • #34 Ministery of water and Energy
  • #35 Ministery of water and Energy
  • #36 Ministery of water and Energy
  • #37 Ministery of water and Energy
  • #38 Ministery of water and Energy
  • #39 Ministery of water and Energy
  • #40 Ministery of water and Energy
  • #41 Ministery of water and Energy