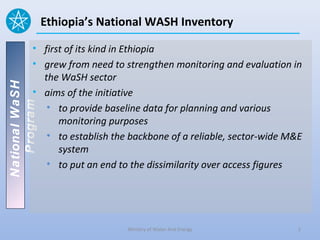
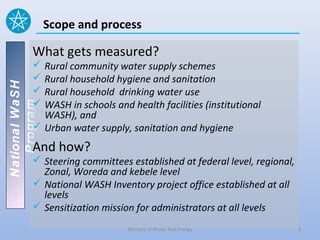
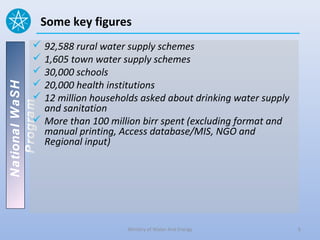
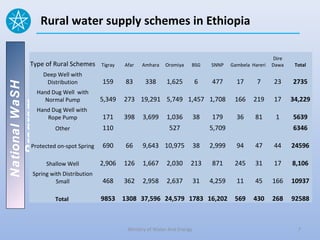
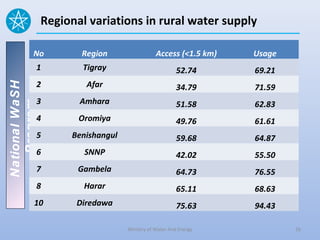
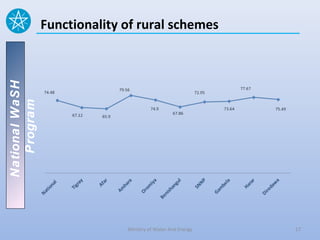
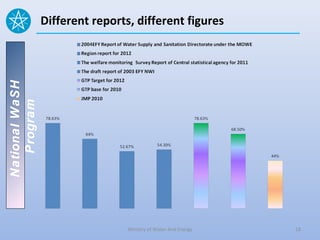
Monitoring rural water supplies
National WaSH Program


                                           in Ethiopia
                                           Prepared by:- Tamene Hailu Debela
                                       National WASH Inventory Office (NWI)


                                                                 MoWE
                                                                 April, 2013
Ethiopia’s National WASH Inventory

          • first of its kind in Ethiopia
          • grew from need to strengthen monitoring and evaluation in
            the WaSH sector
National WaSH


          • aims of the initiative
   Program


             • to provide baseline data for planning and various
                monitoring purposes
             • to establish the backbone of a reliable, sector-wide M&E
                system
             • to put an end to the dissimilarity over access figures


                               Ministry of Water And Energy           2
Scope and process

          What gets measured?
           Rural community water supply schemes
           Rural household hygiene and sanitation
National WaSH


           Rural household drinking water use
           WASH in schools and health facilities (institutional
   Program


            WASH), and
           Urban water supply, sanitation and hygiene
          And how?
           Steering committees established at federal level, regional,
            Zonal, Woreda and kebele level
           National WASH Inventory project office established at all
            levels
           Sensitization mission for administrators at all levels
                                Ministry of Water And Energy              3
Continued….
           Awareness given to the community through mass media
            like national and local Radio, TV, and newspapers
           Training given for supervisors, nominators and data
            encoders: about 70,000 people have participated in NWI
National WaSH


           Data collected with approval of Kebele and Woreda
            administration
   Program


           Data entry is done at regional level using Access database
           Soft copy to national WASH inventory project office for
            the analysis of KPI
           Regions clean their data and undertake analysis with the
            support of WASH M&E MIS


                               Ministry of Water And Energy              4
Current progress

          • All regions (except Somali region) have completed data
            collection and data entry
          • Regions are cleaning their data
National WaSH


          • The MoWE has finished preliminary analysis of data using
            the Management Information Software (MIS) developed
   Program


            by PUT services


                               Ministry of Water And Energy            5
Some key figures
           92,588 rural water supply schemes
           1,605 town water supply schemes
           30,000 schools
           20,000 health institutions
National WaSH


           12 million households asked about drinking water supply
   Program


            and sanitation
           More than 100 million birr spent (excluding format and
            manual printing, Access database/MIS, NGO and
            Regional input)


                               Ministry of Water And Energy           6
Rural water supply schemes in Ethiopia

                                                                                                             Dire
         Type of Rural Schemes        Tigray   Afar   Amhara    Oromiya    BSG      SNNP    Gambela Hareri   Dawa    Total
                  Deep Well with
                   Distribution       159      83      338      1,625          6    477       17      7      23     2735
National WaSH


                Hand Dug Well with
                  Normal Pump         5,349    273 19,291 5,749 1,457 1,708                  166     219     17     34,229
   Program


                Hand Dug Well with
                   Rope Pump          171      398    3,699     1,036          38   179       36     81       1     5639
                      Other           110                         527               5,709                           6346

          Protected on-spot Spring    690      66     9,643 10,975             38   2,999     94     47      44     24596

                   Shallow Well       2,906    126    1,667     2,030      213      871      245     31      17     8,106
           Spring with Distribution
                    Small             468      362    2,958     2,637          31   4,259     11     45      166    10937

                      Total           9853 1308 37,596 24,579 1783 16,202                    569     430     268    92588


                                                Ministry of Water And Energy                                          7
Definitions for rural water supply
          • Access:- % of rural population that is provided access to
            15 l/c/d water within 1.5km of the water supply point
          • Computation (Number of beneficiaries that have
National WaSH


            accessed and could access 15 l/c/d water within 1.5 km of
            the water supply point, including repairable non-
   Program


            functional water supply schemes/ Total population from
            CSA) x 100 (%)
          • Usage:- % of rural population that is actually using water
            from the water point irrespective of quantities used and
            distance from the water point
          • Computation:- (Number of beneficiaries actually using
            water from water supply point: as per the data from the
            annual inventory of water supply schemes / Total
            population from CSA) x 100 (%)Energy
                                Ministry of Water And                    8
National WaSH   National figures: Access
   Program


                                 Ministry of Water And Energy   9
National figures: Usage schemes
National WaSH
   Program


                               Ministry of Water And Energy   10
National figures: health Institutions
National WaSH
   Program


                                Ministry of Water And Energy   11
National figures: schools
National WaSH
   Program


                                Ministry of Water And Energy   12
National WaSH   National figures: household sanitation
   Program


                                Ministry of Water And Energy   13
National WaSH   National figures: household survey of drinking water
   Program


                                       Ministry of Water And Energy    14
National WaSH   Comparison of findings
   Program


                               Ministry of Water And Energy   15
Regional variations in rural water supply

           No          Region                  Access (<1.5 km)   Usage
            1           Tigray                         52.74      69.21
            2           Afar
National WaSH


                                                       34.79      71.59
            3          Amhara                          51.58      62.83
   Program


            4          Oromiya                         49.76      61.61
            5        Benishangul                       59.68      64.87
            6           SNNP                           42.02      55.50
            7          Gambela                         64.73      76.55
            8           Harar                          65.11      68.63
           10         Diredawa                         75.63      94.43

                                   Ministry of Water And Energy           16
Functionality of rural schemes
National WaSH
   Program


                              Ministry of Water And Energy   17
National WaSH   Different reports, different figures
   Program


                                 Ministry of Water And Energy   18
Some additional benefits

          • Integrating many WASH actors
                  the NWI has been a force for integration i.e. both between
                   different levels of government and within each administrative
                   level.
National WaSH


                  enhanced cooperation with CSOs
   Program


                  allowed lower levels of government to engage with communities
          • data retained at woreda level
              assists woreda officials with planning and maintenance work


                                     Ministry of Water And Energy                  19
Problems/ issues: data collection

          • Logistical challenges in getting sufficient forms to
            enumerators
          • Design of data entry forms: repetition could have been
National WaSH


            avoided
          • Missing GPS data: Roughly 33% schemes without GPS
   Program


            coordinates and about 15% of schools and health centres
          • Other missing data
          • Timing of the NWI during rainy season
          • Initial worries about a lack of vehicles for data collection
            but NGOs contributed to providing vehicles
          • Delays in the sending of budget to some regions


                                Ministry of Water And Energy               20
Problems/issues: data entry

          • Delays in starting data entry due to need to procure
            computers and network installation
          • Duplication of kebeles/ unique identifiers
National WaSH


          • The time consuming business of forms 4 & 5. In Oromia
            alone there are 5.2 million households to be entered
   Program


                  entering only kebele-level summaries
                  CSA is expecting household level data and although Kebele
                   summaries will not be as accurate as household level data the
                   accuracy of the kebeles summaries can be checked with sampling


                                     Ministry of Water And Energy                   21
Data verification

          • Reviewing completeness: additional data collection may
            be necessary to fill gaps. Somali region inventory to be
            undertaken.
National WaSH


          • Data cleaning by regions
          • Verification: NWI data needs to be assessed in terms of
   Program


            quality and completeness. NWI data will be verified by the
            Central Statistical Agency.
                  The CSA has a Data Quality Directorate, which is mandated with
                   certifying the quality of any data that is to be published as a
                   National Statistic.
                  Data quality can only be measured by doing field based sample
                   verification


                                      Ministry of Water And Energy                   22
Data Analysis

          • Now the data has been entered and preliminary analysis
            done by the MoWE using MIS software
          • Although final analysis must use verified data from CSA,
National WaSH


            the NWIPO will use the preliminary data at the moment
          • later, analysis training will be rolled out to regions to
   Program


            allow them to produce Woreda Report Cards


                                Ministry of Water And Energy            23
Reporting/Statistical abstracts

          • reports and statistical abstracts will be produced for the
            national and regional level
          • Include disaggregated data to be used by regions and at
National WaSH


            the national level
          • reporting on 15 key performance indicators for WASH
   Program


          • next steps after reports and abstracts:
              Concept note developed for final NWI publication
              Data access by different levels and third parties must
                be immediately clarified


                                 Ministry of Water And Energy            24
Sustainability

          • NWI establishes a baseline for the WASH sector, but this
            must be regularly updated
          • stakeholders should come together to discuss both their
National WaSH


            data needs as well as available resources for updating
          • a second aspect is putting the collected data into active
   Program


            use. This will require training (on evidence-based planning
            etc) to be rolled out to the woreda level at least.


                                 Ministry of Water And Energy             25

Monitoring rural water supplies in Ethiopia

  • 1.
    Monitoring rural watersupplies National WaSH Program in Ethiopia Prepared by:- Tamene Hailu Debela National WASH Inventory Office (NWI) MoWE April, 2013
  • 2.
    Ethiopia’s National WASHInventory • first of its kind in Ethiopia • grew from need to strengthen monitoring and evaluation in the WaSH sector National WaSH • aims of the initiative Program • to provide baseline data for planning and various monitoring purposes • to establish the backbone of a reliable, sector-wide M&E system • to put an end to the dissimilarity over access figures Ministry of Water And Energy 2
  • 3.
    Scope and process What gets measured?  Rural community water supply schemes  Rural household hygiene and sanitation National WaSH  Rural household drinking water use  WASH in schools and health facilities (institutional Program WASH), and  Urban water supply, sanitation and hygiene And how?  Steering committees established at federal level, regional, Zonal, Woreda and kebele level  National WASH Inventory project office established at all levels  Sensitization mission for administrators at all levels Ministry of Water And Energy 3
  • 4.
    Continued….  Awareness given to the community through mass media like national and local Radio, TV, and newspapers  Training given for supervisors, nominators and data encoders: about 70,000 people have participated in NWI National WaSH  Data collected with approval of Kebele and Woreda administration Program  Data entry is done at regional level using Access database  Soft copy to national WASH inventory project office for the analysis of KPI  Regions clean their data and undertake analysis with the support of WASH M&E MIS Ministry of Water And Energy 4
  • 5.
    Current progress • All regions (except Somali region) have completed data collection and data entry • Regions are cleaning their data National WaSH • The MoWE has finished preliminary analysis of data using the Management Information Software (MIS) developed Program by PUT services Ministry of Water And Energy 5
  • 6.
    Some key figures  92,588 rural water supply schemes  1,605 town water supply schemes  30,000 schools  20,000 health institutions National WaSH  12 million households asked about drinking water supply Program and sanitation  More than 100 million birr spent (excluding format and manual printing, Access database/MIS, NGO and Regional input) Ministry of Water And Energy 6
  • 7.
    Rural water supplyschemes in Ethiopia Dire Type of Rural Schemes Tigray Afar Amhara Oromiya BSG SNNP Gambela Hareri Dawa Total Deep Well with Distribution 159 83 338 1,625 6 477 17 7 23 2735 National WaSH Hand Dug Well with Normal Pump 5,349 273 19,291 5,749 1,457 1,708 166 219 17 34,229 Program Hand Dug Well with Rope Pump 171 398 3,699 1,036 38 179 36 81 1 5639 Other 110 527 5,709 6346 Protected on-spot Spring 690 66 9,643 10,975 38 2,999 94 47 44 24596 Shallow Well 2,906 126 1,667 2,030 213 871 245 31 17 8,106 Spring with Distribution Small 468 362 2,958 2,637 31 4,259 11 45 166 10937 Total 9853 1308 37,596 24,579 1783 16,202 569 430 268 92588 Ministry of Water And Energy 7
  • 8.
    Definitions for ruralwater supply • Access:- % of rural population that is provided access to 15 l/c/d water within 1.5km of the water supply point • Computation (Number of beneficiaries that have National WaSH accessed and could access 15 l/c/d water within 1.5 km of the water supply point, including repairable non- Program functional water supply schemes/ Total population from CSA) x 100 (%) • Usage:- % of rural population that is actually using water from the water point irrespective of quantities used and distance from the water point • Computation:- (Number of beneficiaries actually using water from water supply point: as per the data from the annual inventory of water supply schemes / Total population from CSA) x 100 (%)Energy Ministry of Water And 8
  • 9.
    National WaSH National figures: Access Program Ministry of Water And Energy 9
  • 10.
    National figures: Usageschemes National WaSH Program Ministry of Water And Energy 10
  • 11.
    National figures: healthInstitutions National WaSH Program Ministry of Water And Energy 11
  • 12.
    National figures: schools NationalWaSH Program Ministry of Water And Energy 12
  • 13.
    National WaSH National figures: household sanitation Program Ministry of Water And Energy 13
  • 14.
    National WaSH National figures: household survey of drinking water Program Ministry of Water And Energy 14
  • 15.
    National WaSH Comparison of findings Program Ministry of Water And Energy 15
  • 16.
    Regional variations inrural water supply No Region Access (<1.5 km) Usage 1 Tigray 52.74 69.21 2 Afar National WaSH 34.79 71.59 3 Amhara 51.58 62.83 Program 4 Oromiya 49.76 61.61 5 Benishangul 59.68 64.87 6 SNNP 42.02 55.50 7 Gambela 64.73 76.55 8 Harar 65.11 68.63 10 Diredawa 75.63 94.43 Ministry of Water And Energy 16
  • 17.
    Functionality of ruralschemes National WaSH Program Ministry of Water And Energy 17
  • 18.
    National WaSH Different reports, different figures Program Ministry of Water And Energy 18
  • 19.
    Some additional benefits • Integrating many WASH actors  the NWI has been a force for integration i.e. both between different levels of government and within each administrative level. National WaSH  enhanced cooperation with CSOs Program  allowed lower levels of government to engage with communities • data retained at woreda level  assists woreda officials with planning and maintenance work Ministry of Water And Energy 19
  • 20.
    Problems/ issues: datacollection • Logistical challenges in getting sufficient forms to enumerators • Design of data entry forms: repetition could have been National WaSH avoided • Missing GPS data: Roughly 33% schemes without GPS Program coordinates and about 15% of schools and health centres • Other missing data • Timing of the NWI during rainy season • Initial worries about a lack of vehicles for data collection but NGOs contributed to providing vehicles • Delays in the sending of budget to some regions Ministry of Water And Energy 20
  • 21.
    Problems/issues: data entry • Delays in starting data entry due to need to procure computers and network installation • Duplication of kebeles/ unique identifiers National WaSH • The time consuming business of forms 4 & 5. In Oromia alone there are 5.2 million households to be entered Program  entering only kebele-level summaries  CSA is expecting household level data and although Kebele summaries will not be as accurate as household level data the accuracy of the kebeles summaries can be checked with sampling Ministry of Water And Energy 21
  • 22.
    Data verification • Reviewing completeness: additional data collection may be necessary to fill gaps. Somali region inventory to be undertaken. National WaSH • Data cleaning by regions • Verification: NWI data needs to be assessed in terms of Program quality and completeness. NWI data will be verified by the Central Statistical Agency.  The CSA has a Data Quality Directorate, which is mandated with certifying the quality of any data that is to be published as a National Statistic.  Data quality can only be measured by doing field based sample verification Ministry of Water And Energy 22
  • 23.
    Data Analysis • Now the data has been entered and preliminary analysis done by the MoWE using MIS software • Although final analysis must use verified data from CSA, National WaSH the NWIPO will use the preliminary data at the moment • later, analysis training will be rolled out to regions to Program allow them to produce Woreda Report Cards Ministry of Water And Energy 23
  • 24.
    Reporting/Statistical abstracts • reports and statistical abstracts will be produced for the national and regional level • Include disaggregated data to be used by regions and at National WaSH the national level • reporting on 15 key performance indicators for WASH Program • next steps after reports and abstracts:  Concept note developed for final NWI publication  Data access by different levels and third parties must be immediately clarified Ministry of Water And Energy 24
  • 25.
    Sustainability • NWI establishes a baseline for the WASH sector, but this must be regularly updated • stakeholders should come together to discuss both their National WaSH data needs as well as available resources for updating • a second aspect is putting the collected data into active Program use. This will require training (on evidence-based planning etc) to be rolled out to the woreda level at least. Ministry of Water And Energy 25

Editor's Notes

  • #12 Part of the legend needs correction under latrine facilities
  • #15 The legends associated with the figures need correcting