Download to read offline
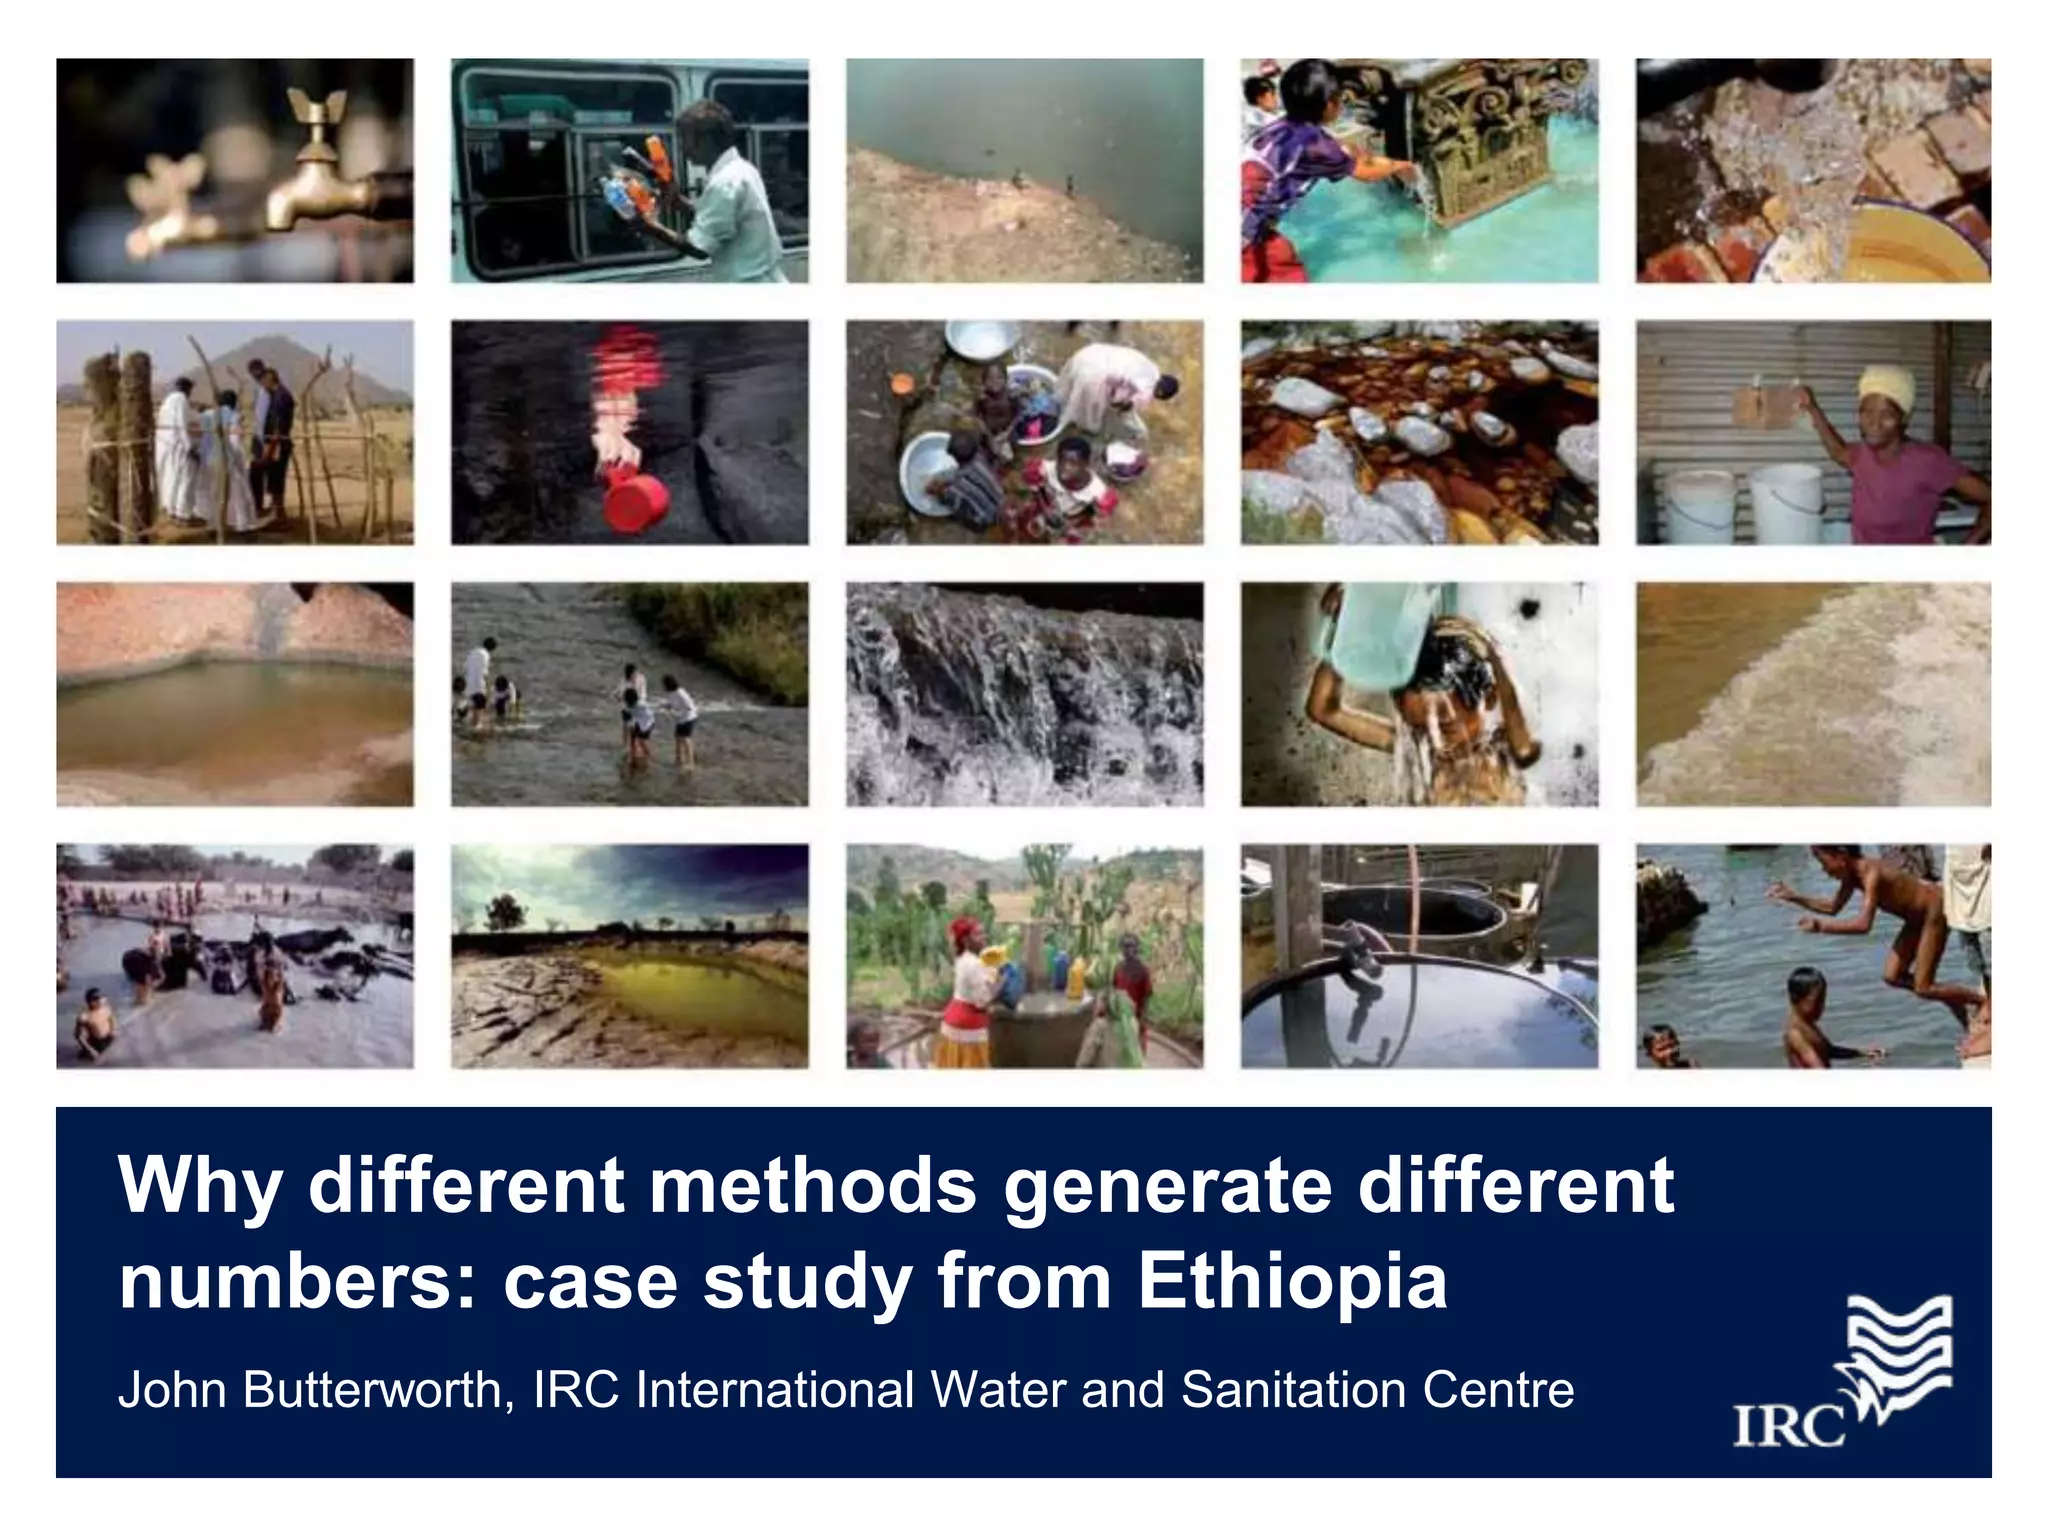

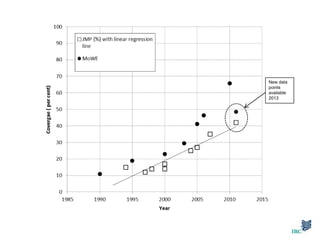

This document discusses different methods for monitoring access to water in Ethiopia and how they generate varying results. It notes that data collected directly from water providers and that collected from household surveys will naturally differ. The Ministry of Water collects provider data while the Central Statistical Agency collects household survey data, though a National WASH Inventory collects both. Neither method is considered better or worse, as each has strengths and weaknesses. Estimates for water access in Ethiopia have varied between 39-49% depending on the source. Reconciling these parallel monitoring processes and making data more transparent are priorities moving forward.


