Download as PDF, PPTX

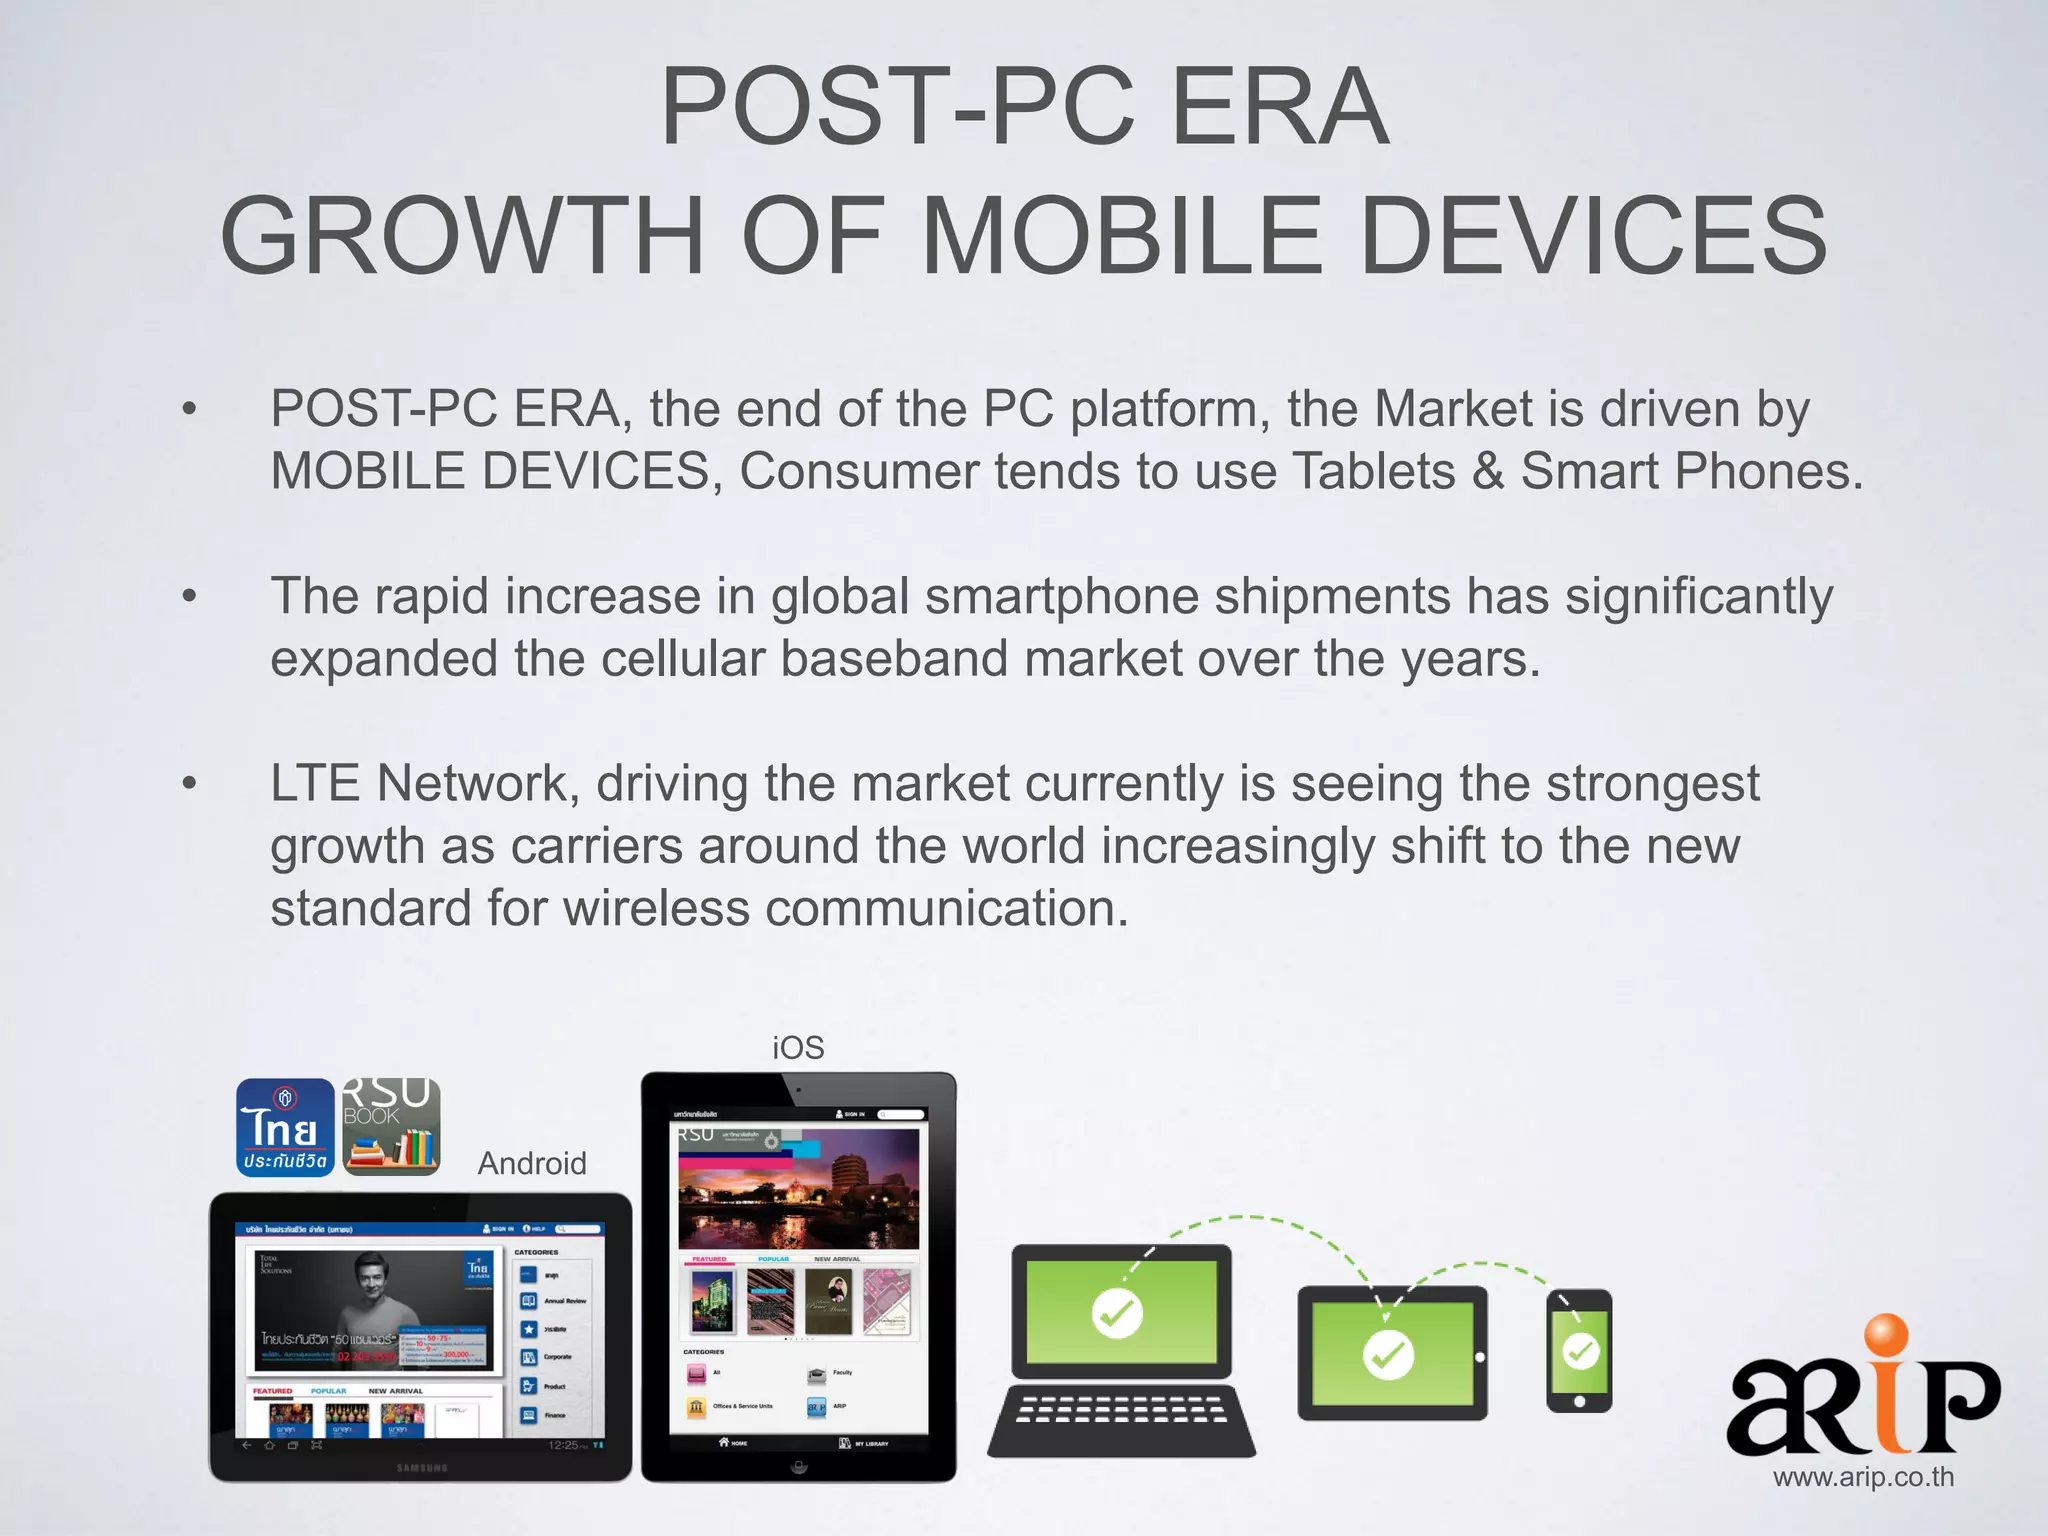

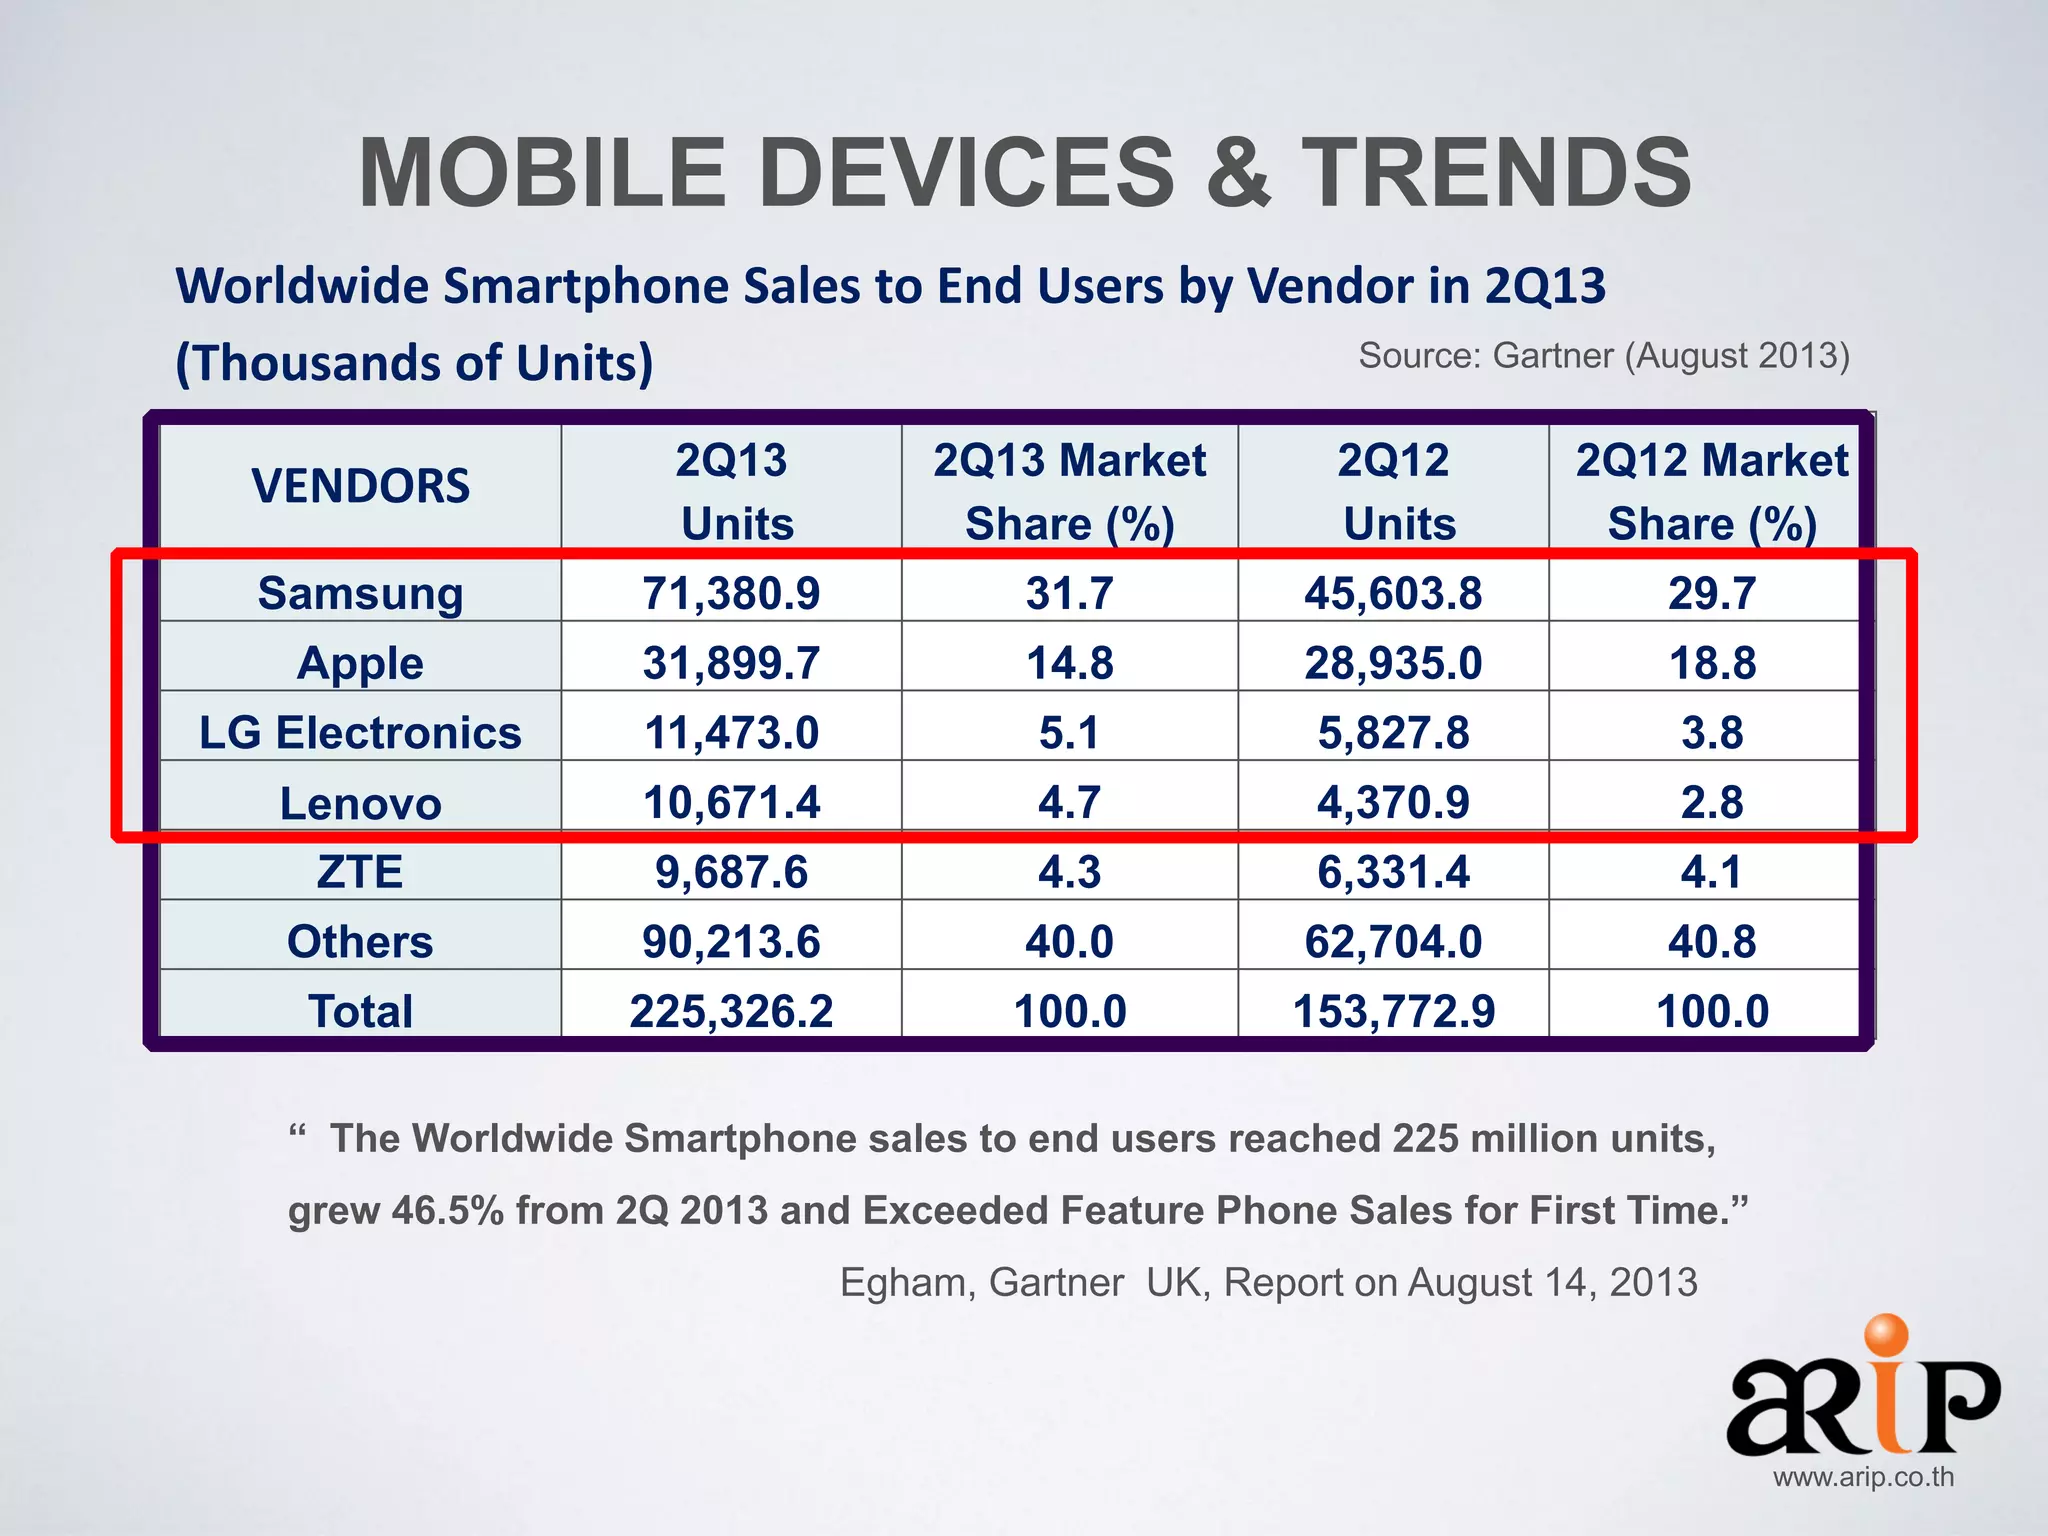

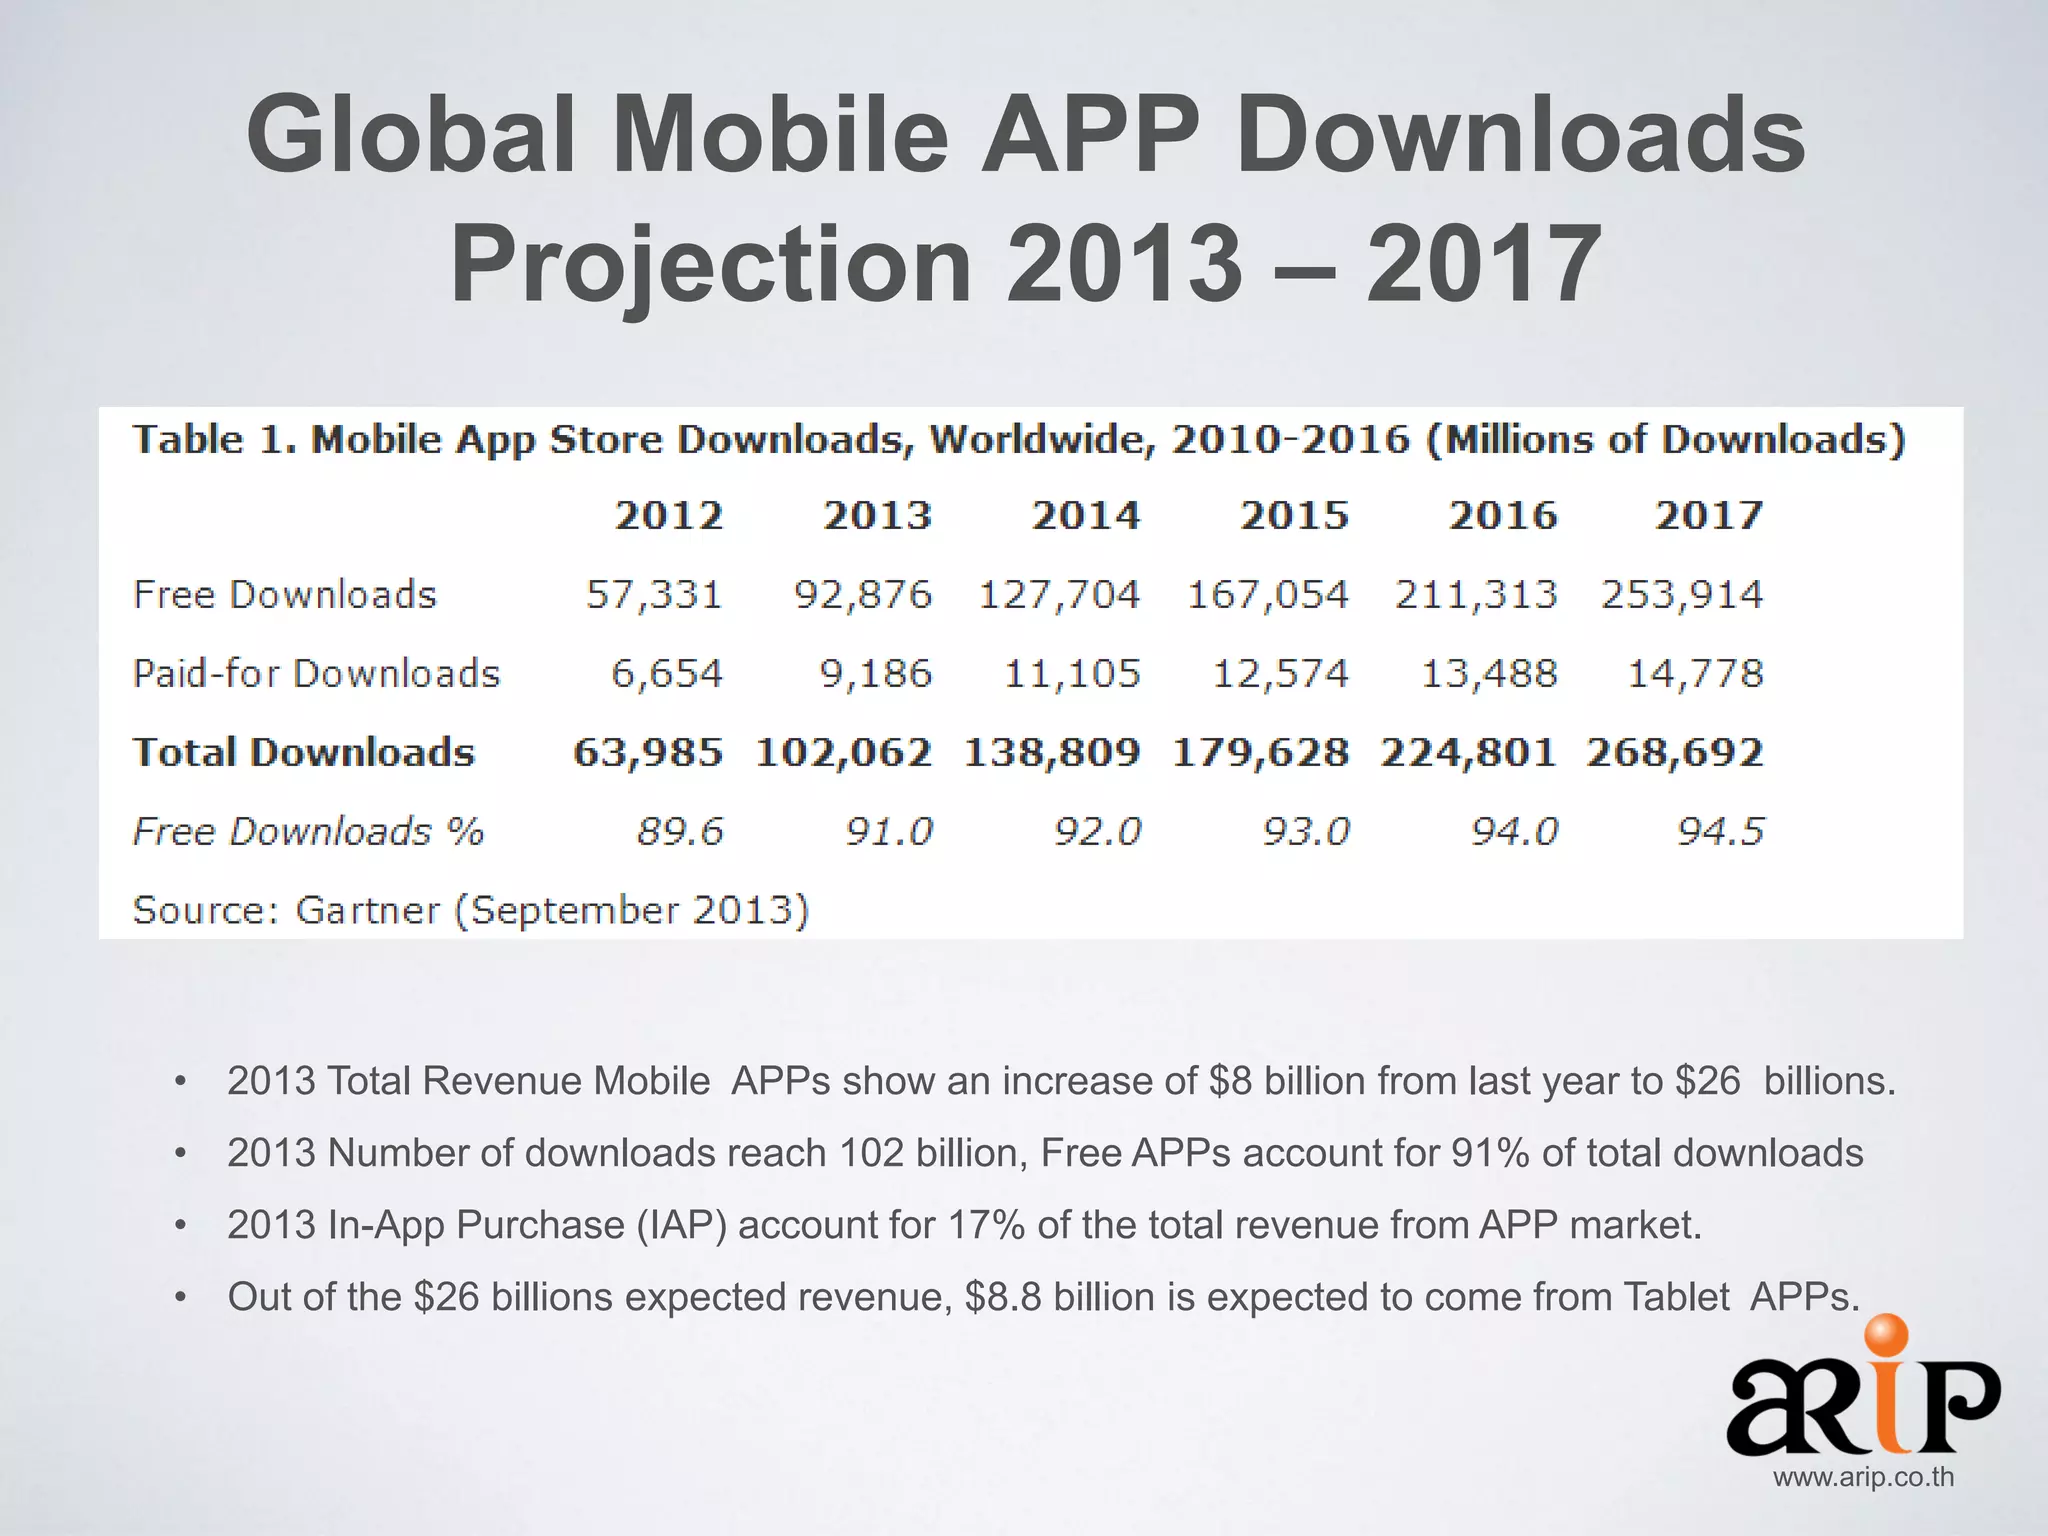

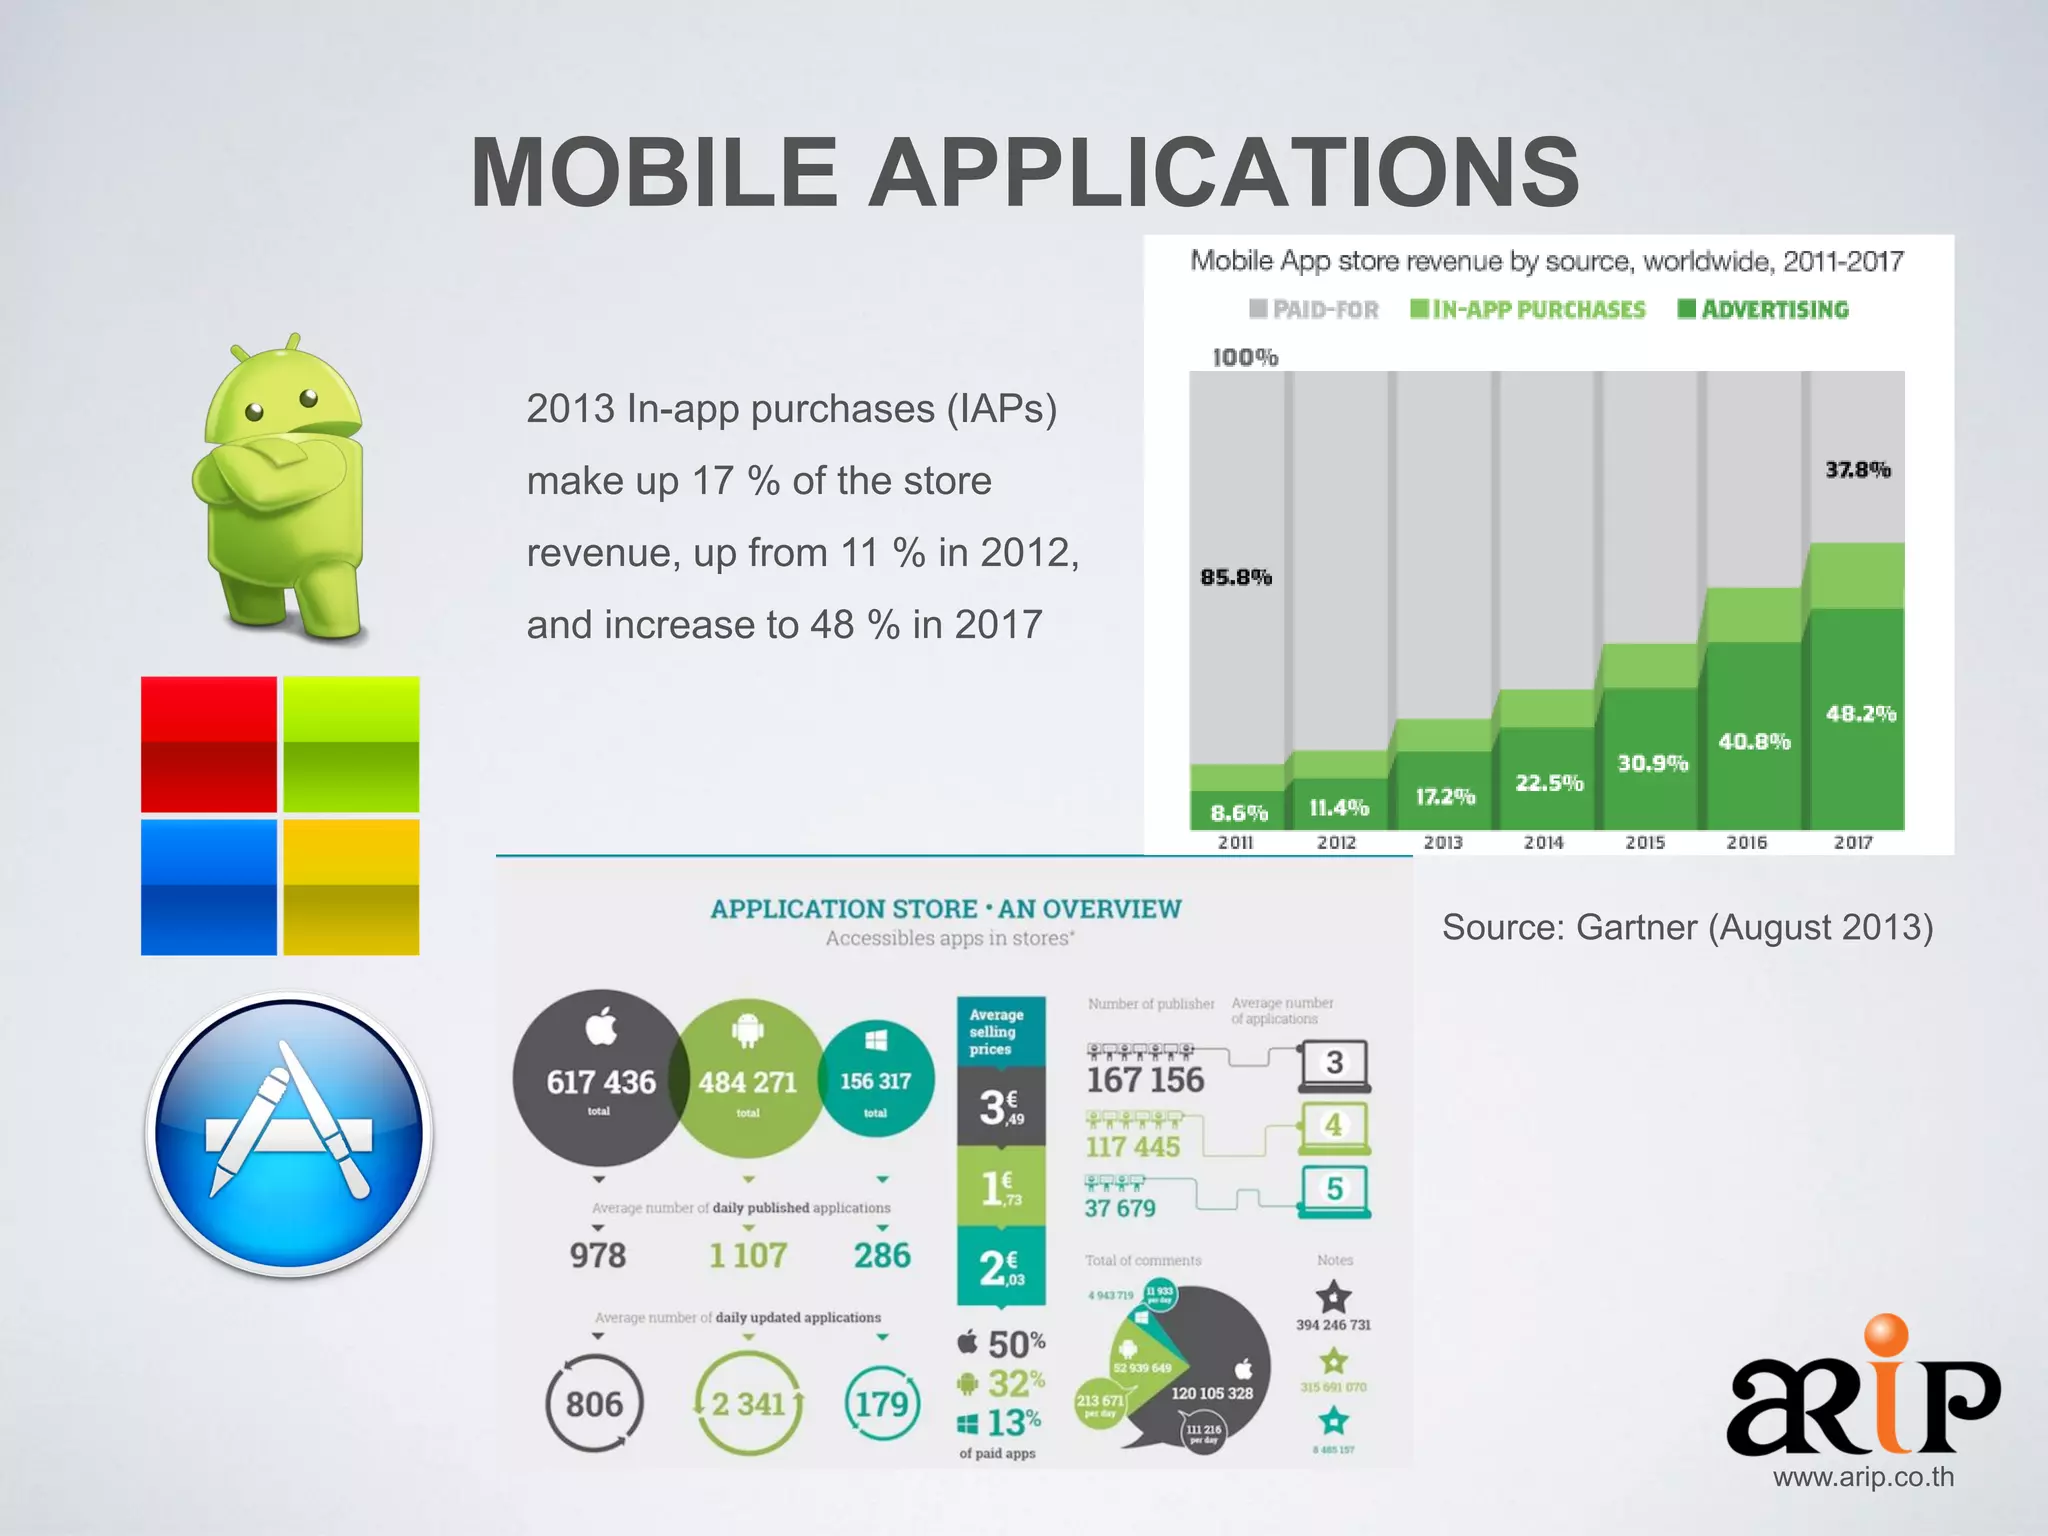


The document discusses the growth of mobile devices in the post-PC era, highlighting the rise of smartphones and tablets, with Android dominating the market. In 2013, smartphone sales reached 225 million units, surpassing feature phone sales for the first time. Additionally, mobile app downloads and revenue are projected to increase significantly, with in-app purchases becoming a major revenue source.


