Download as PDF, PPTX


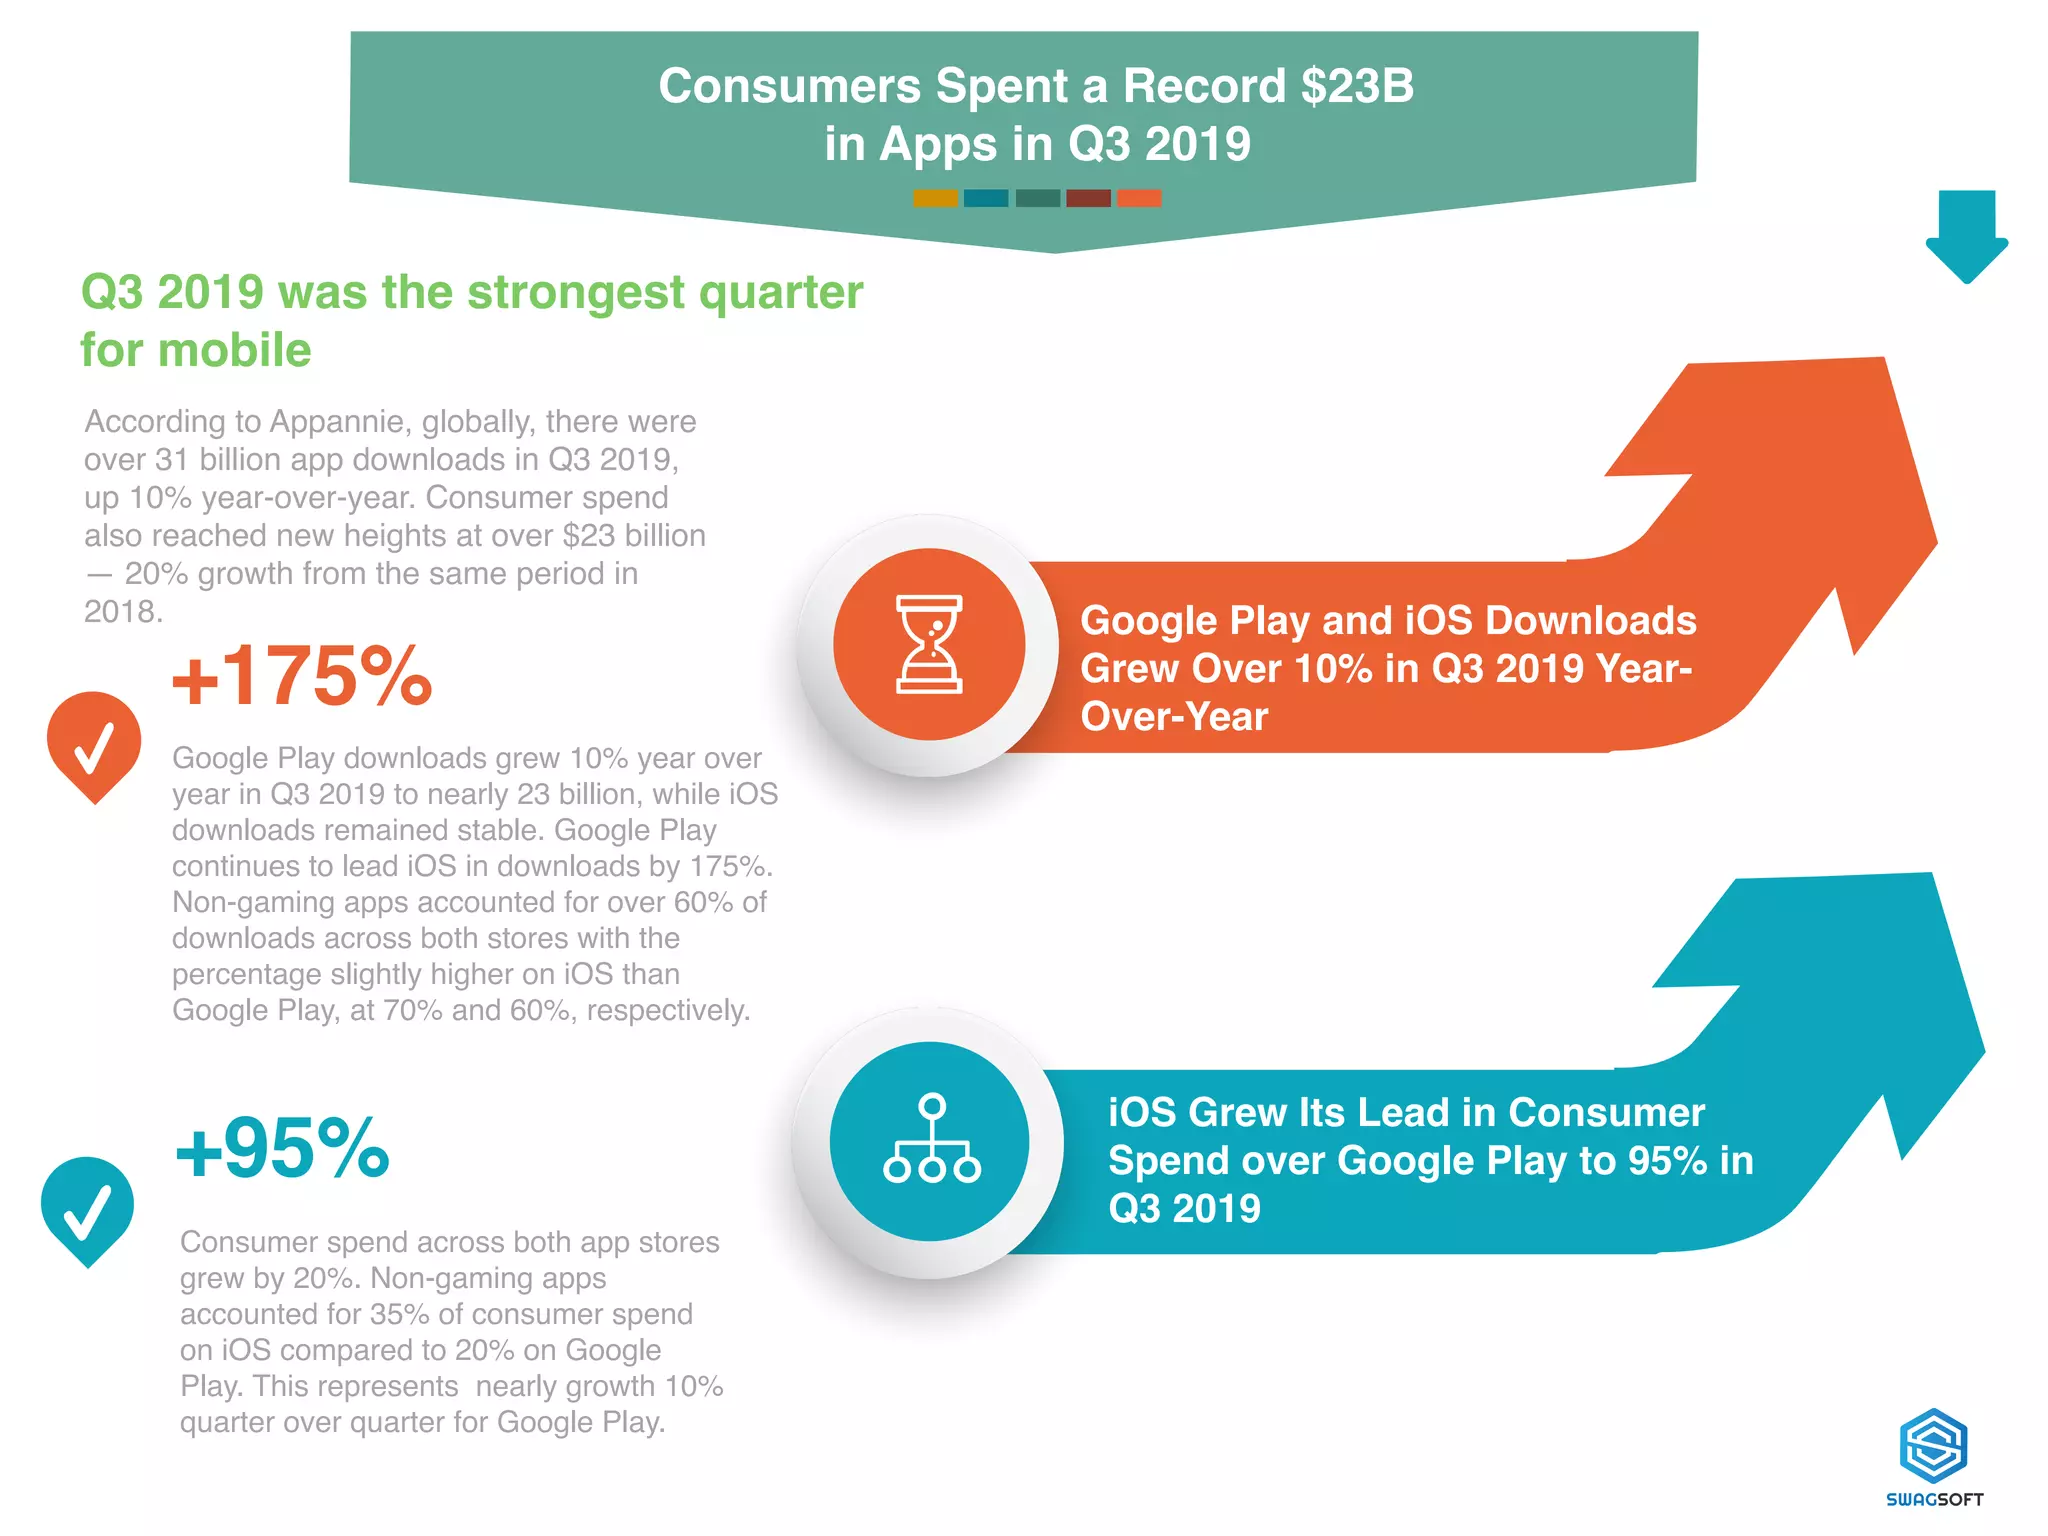


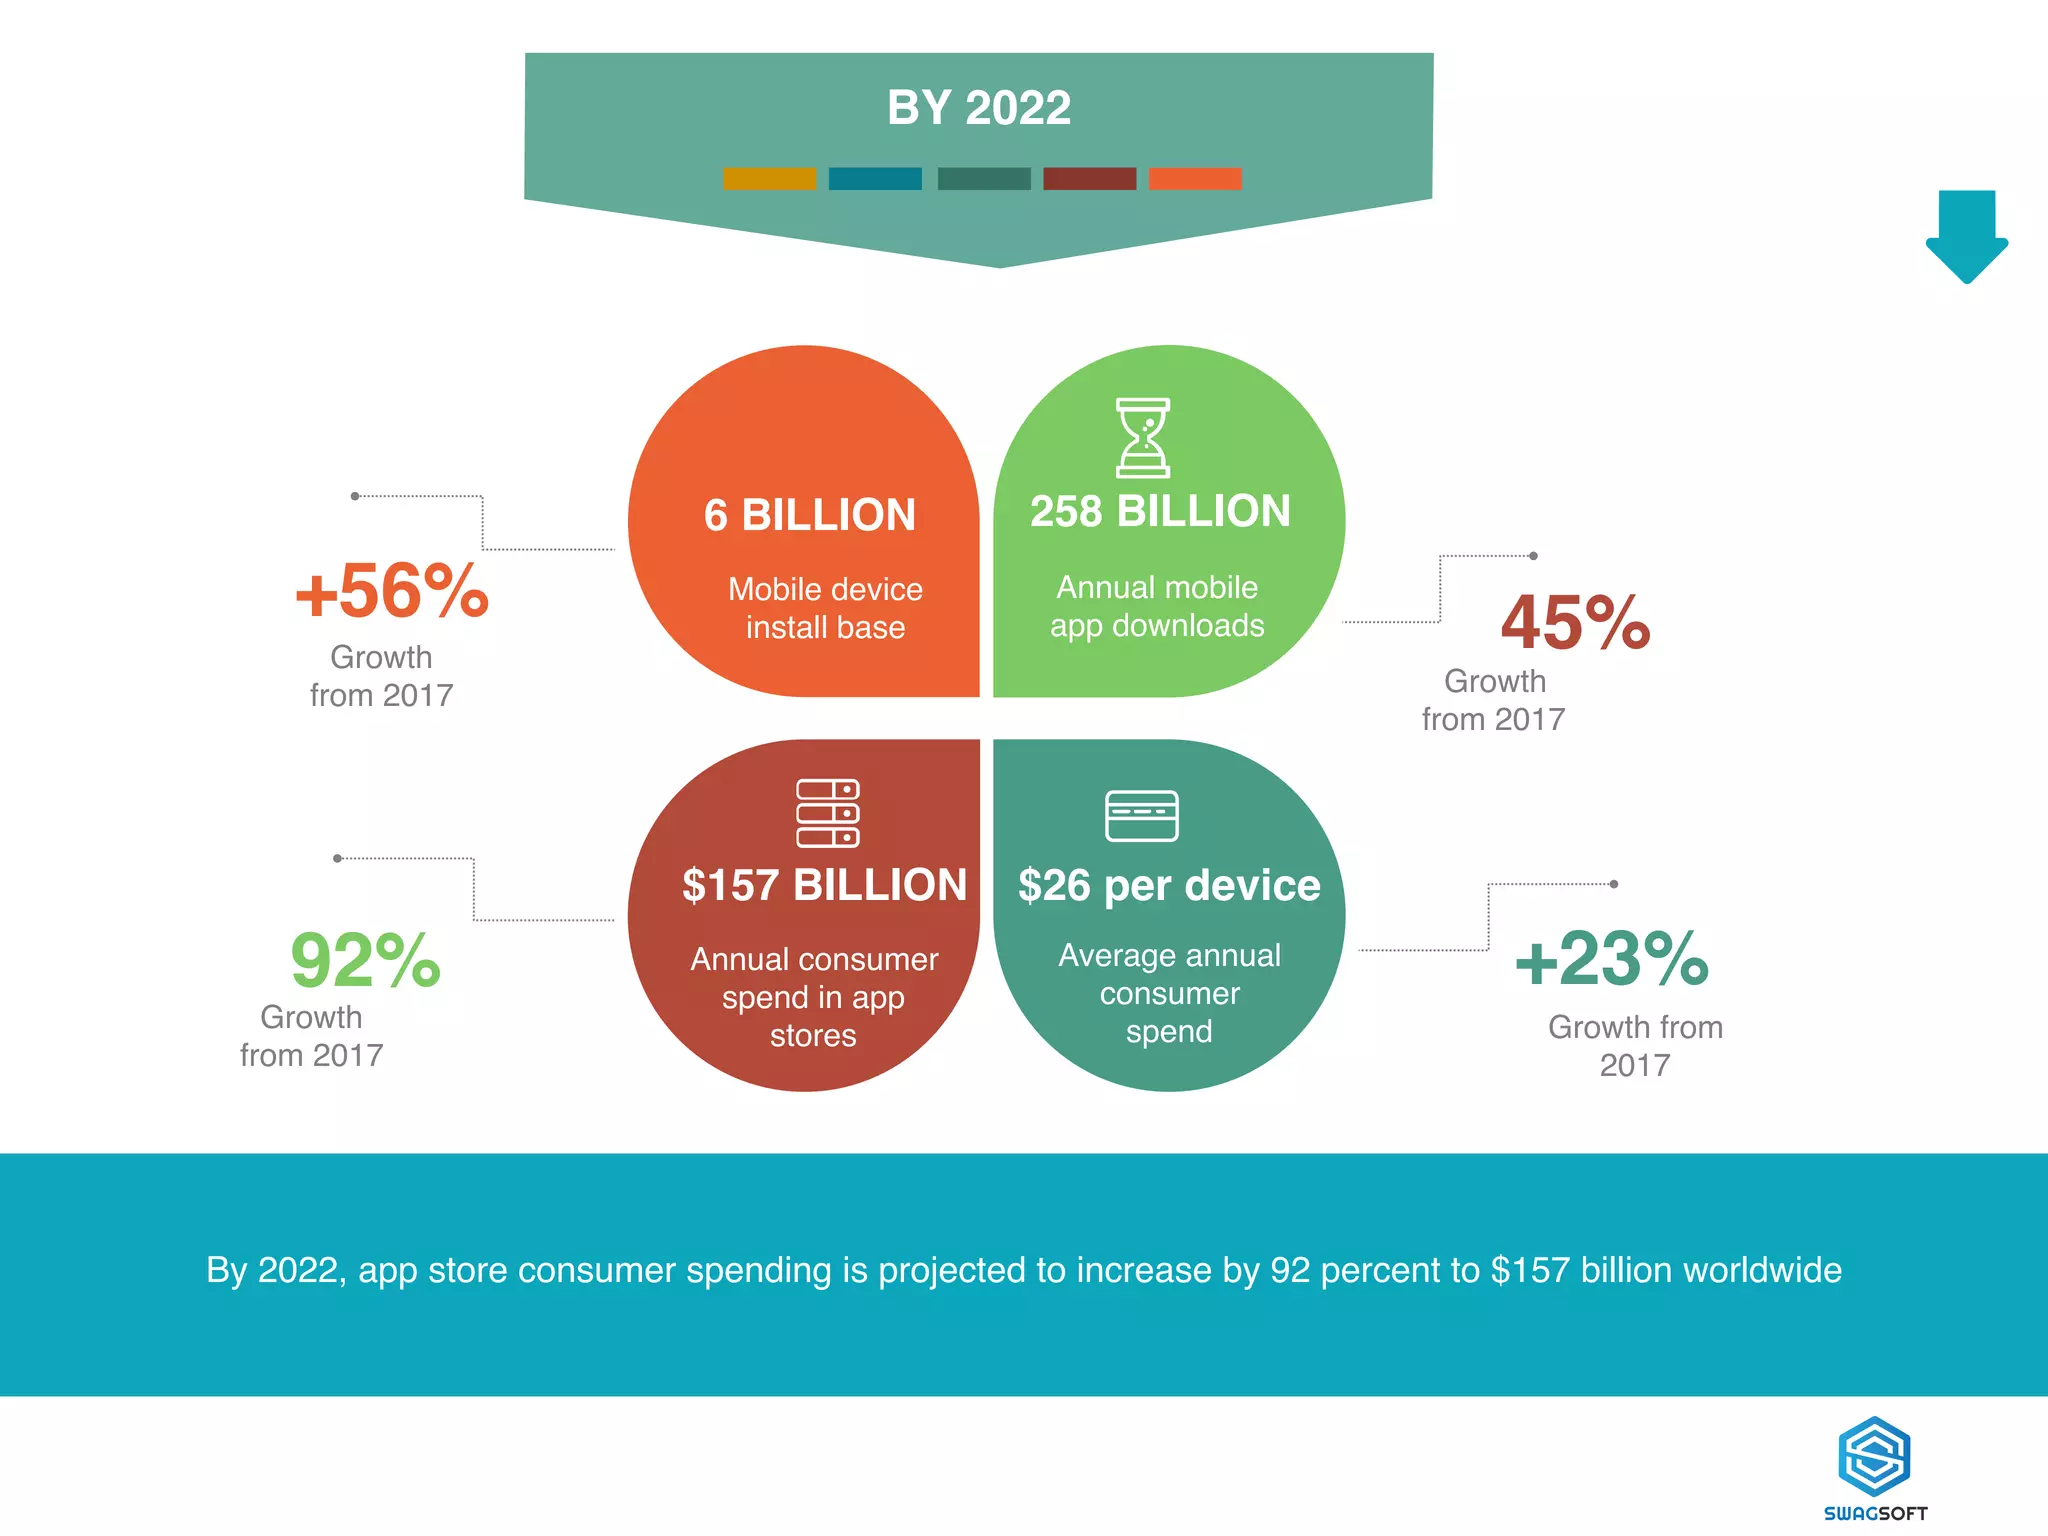
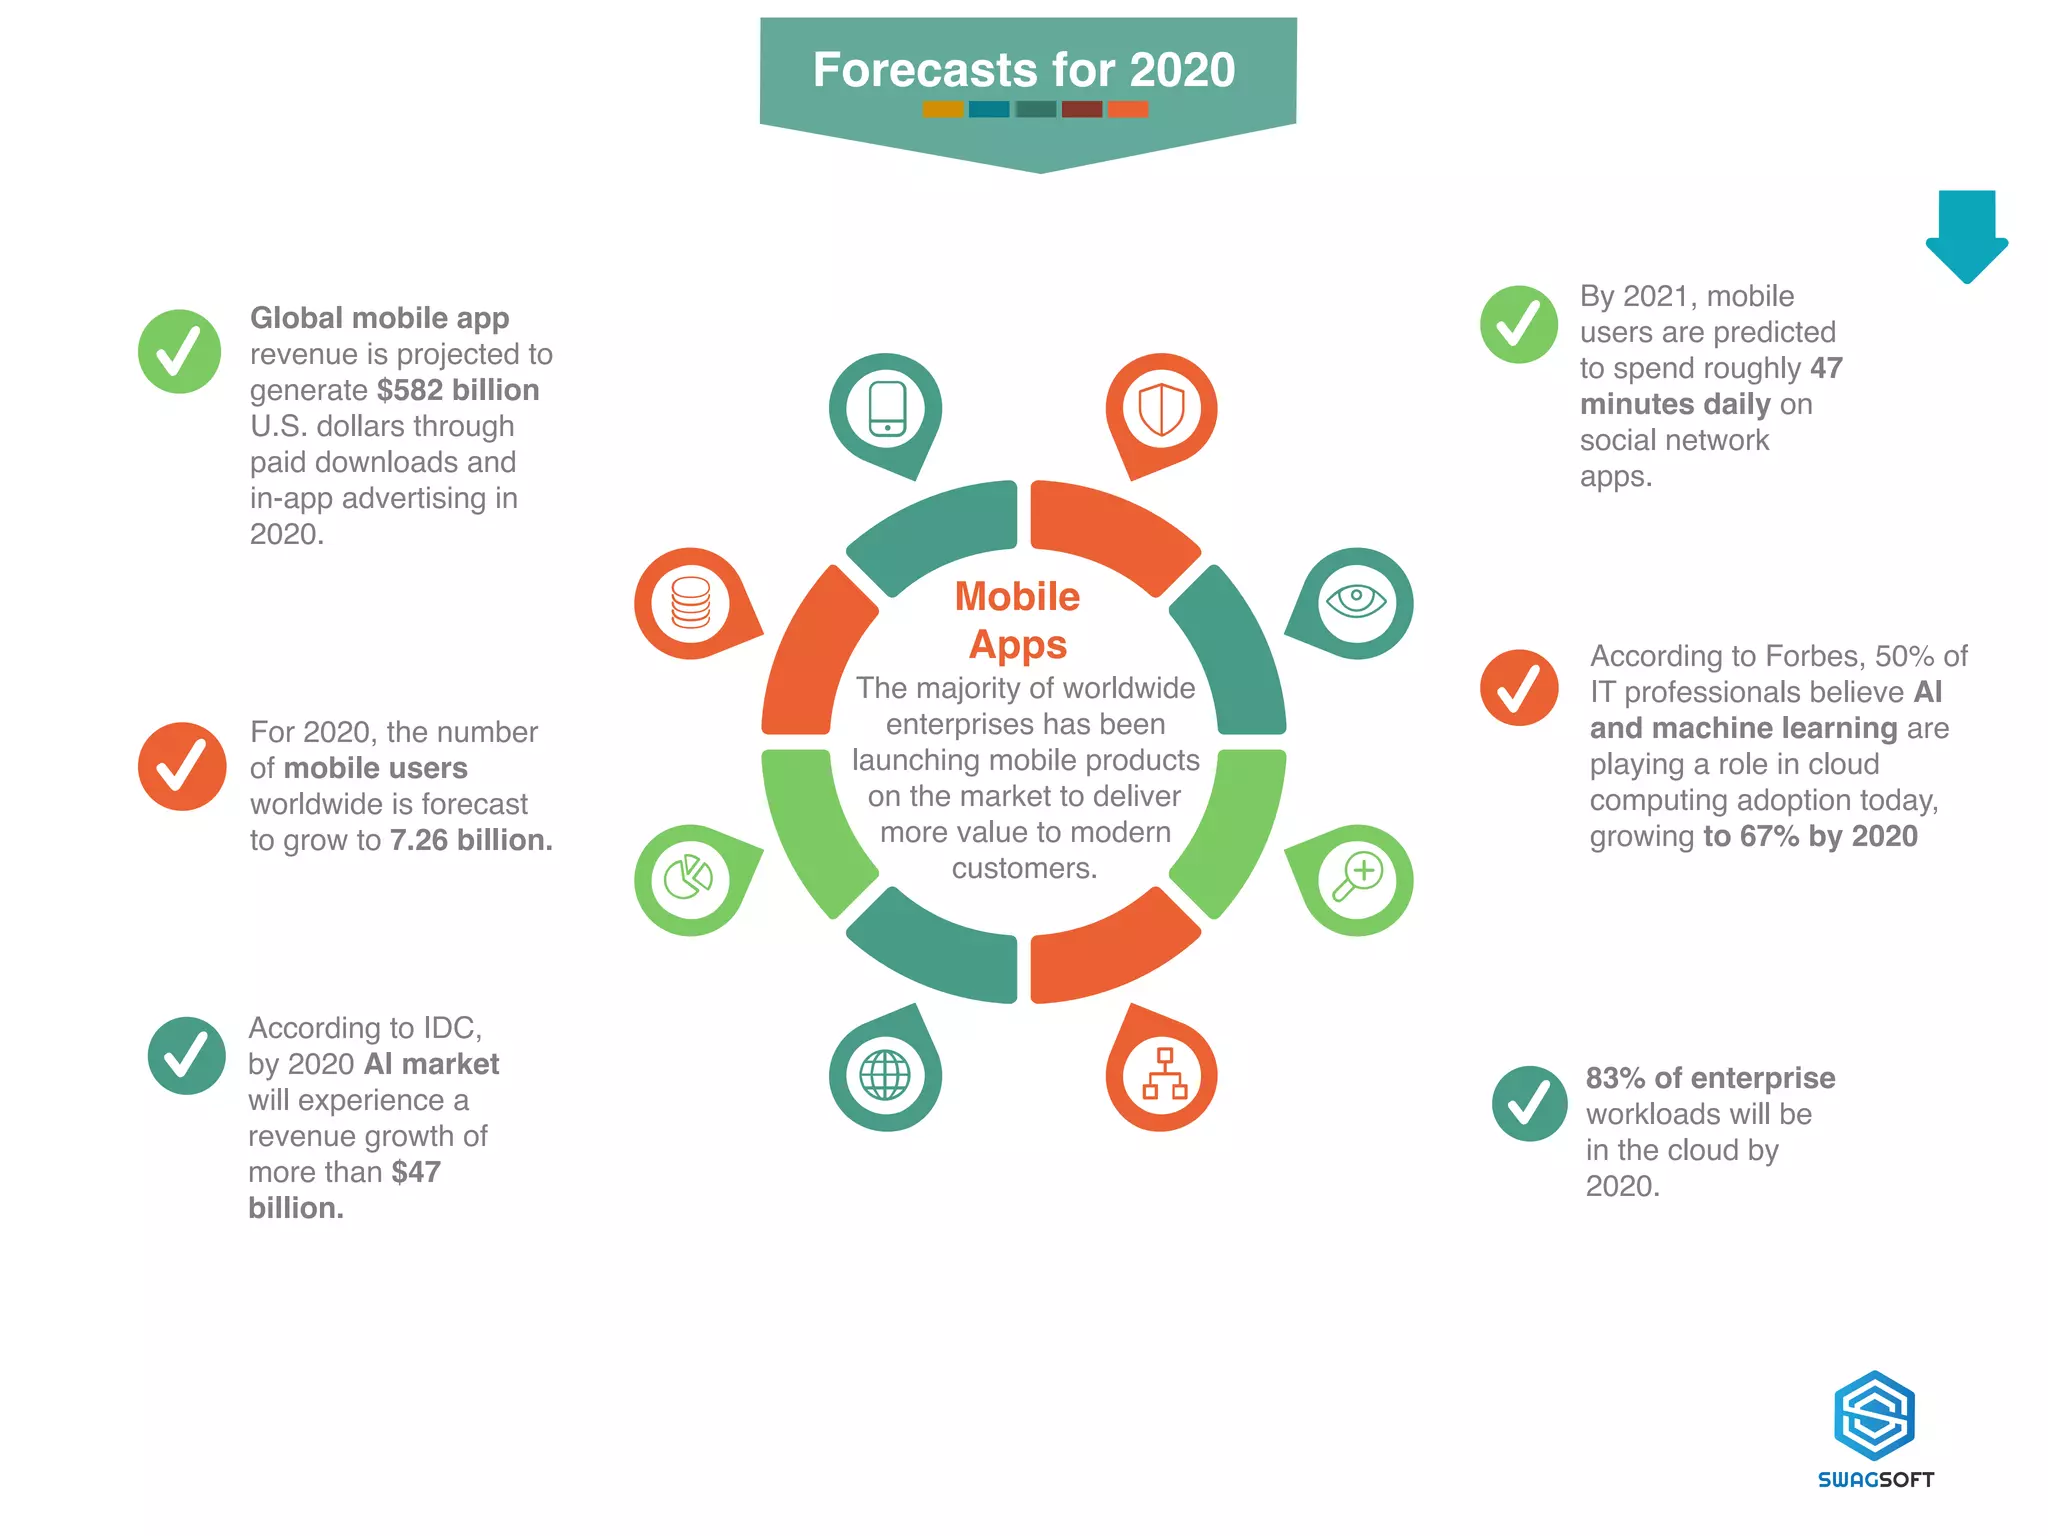


The document outlines significant trends and statistics in mobile app downloads and consumer spending between 2016 and 2021, with total downloads expected to rise from 197 billion in 2017 to 352 billion by 2021. In Q3 2019, app downloads reached over 31 billion and consumer spending surpassed $23 billion, showing substantial year-over-year growth driven primarily by non-gaming apps. Additionally, it highlights factors influencing app uninstalls and forecasts growth in mobile app revenues to $582 billion by 2020, with mobile devices projected to dominate e-commerce sales.


![[2018] Tech Trends For Journalism and Media – The Future Today Institute](https://cdn.slidesharecdn.com/ss_thumbnails/ona-trends7-171120123637-thumbnail.jpg?width=640&height=640&fit=bounds)

![[Infographic] Why Are CIOs Getting SMACT?](https://cdn.slidesharecdn.com/ss_thumbnails/infographicwhyareciosgettingsmact-140915131152-phpapp02-thumbnail.jpg?width=640&height=640&fit=bounds)


