Download as PDF, PPTX


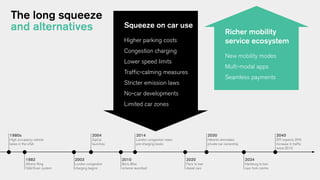
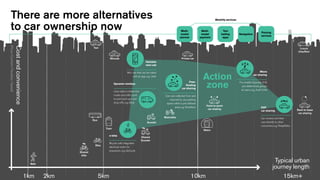
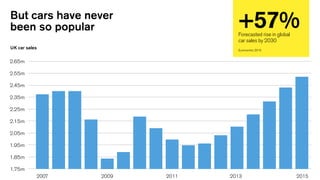
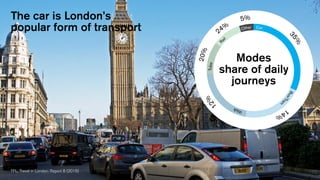
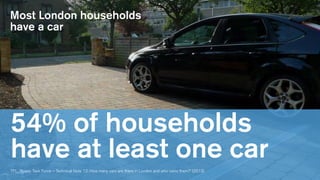


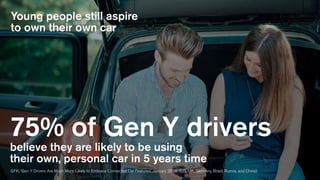
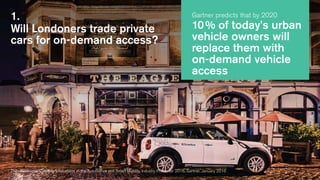


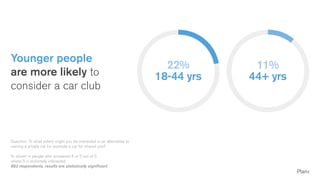
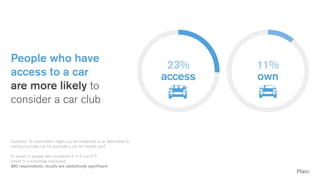

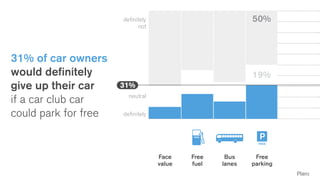
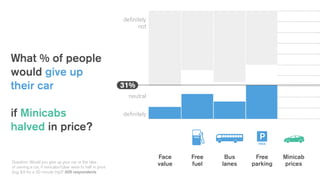
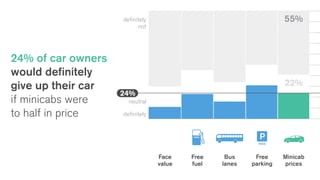
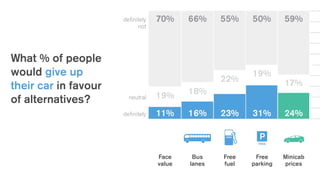
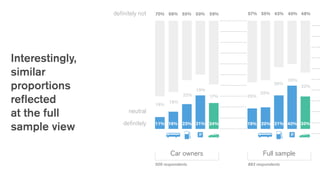
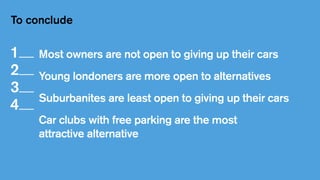


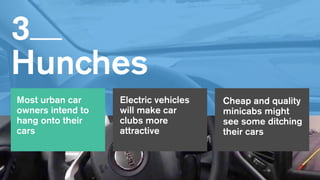
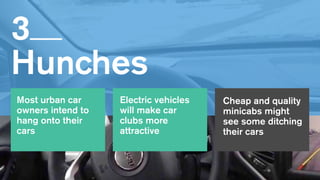


The document discusses trends in urban mobility and the potential decline of car ownership due to the rise of alternatives like car clubs and shared transportation. It highlights a survey indicating that most urban car owners are not keen to give up their cars, although younger individuals show more interest in car-sharing options. Additionally, factors such as electric vehicles and affordable ride-sharing services could influence the future of urban transport and car ownership dynamics.


